CHAPTER 6
![]()
EEG Abnormalities of Premature and Full-Term Neonates
THE TIMING OF EEG STUDIES
Ideally, the initial electroencephalogram (EEG) examination should be done within the first 24 hours after birth or after a suspected brain insult. The best estimate of the degree of damage or dysfunction can be made when the EEG documents the evolution of the abnormality over time. Typically, as time passes, the degree of abnormality lessens. The slower this change, the more severe the underlying brain abnormality. If serial studies document the rate and character of the changes, the prognostic information will be more reliable than that obtained from a single study (Briatore et al., 2013; Chequer et al., 1992; Douglass et al., 2002; Graziani et al., 1994; Hellström-Westas and Rosén, 2005; Holmes and Lombroso, 1993; Holmes et al., 1982; Klinger et al., 2001; Kumar et al., 1999; Le Bihannic et al., 2012; Menache et al., 2002; Pressler et al., 2001; Selton and Andre, 1997; Selton et al., 2010; Takeuchi and Watanabe, 1989; Tharp 1990; Tharp et al., 1989; Watanabe et al., 1999; Zeinstra et al., 2001). Serial studies also afford greater opportunity to detect electrical seizures without clinical signs (Glauser and Clancy, 1992), which themselves may be of prognostic significance (see Chapter 7).
Failure to recognize that EEG findings evolve over time may lead to a less than accurate determination of prognosis. For example, an EEG of an infant might show a suppression-burst pattern on the first day of life, a finding typically indicating the presence of severe brain dysfunction. However, hours later, after the infant’s physiological condition has stabilized, the EEG activity may become continuous with relatively normal background activity. Such changes drastically alter statements concerning the prognosis. However, a suppression-burst pattern that is sustained over several days or that changes to a depressed and undifferentiated pattern implies a poor prognosis for recovery of brain function. Failure to recognize the importance of the time course has led to contradictory statements in the literature concerning the prognostic significance of suppression-burst activity.
With this caveat, however, some statements can be made concerning the significance of the first EEG recorded early in the course of neurological illness. In infants requiring intensive care, the EEG findings obtained within the first 24 hours after birth can provide reliable prognostic information (Pezzani et al., 1986; Pressler et al., 2001); an EEG with normal findings on the first day, or with only minimally abnormal findings, reliably indicates a good prognosis unless further brain injury occurs later.
DIFFUSE ABNORMALITIES
Dyschronism: Disordered Maturational Development
An experienced neurophysiologist can usually determine conceptional age (CA) to within 2 weeks between 26 and 33 weeks CA and within 1 week between 34 and 37 weeks CA, based upon expected developmental features (see Chapter 4) (Tharp, 1990). Disordered maturational development is referred to as “dyschronism” and, if present, is an important abnormality of the neonatal EEG (Hrachovy et al., 1990).
External Dyschronism
This term refers to an EEG in which the developmental characteristics in all states are immature for the reported gestational or CA. If the developmental features of an EEG are immature for the stated gestational or CA and the features of the background activity in all states are normal, the following questions must be addressed: Is the age as determined by clinical evaluation overestimated or are the immature EEG features evidence of delayed maturation? The last explanation suggests that a cerebral insult may have occurred during intrauterine life. A discrepancy of 2 weeks or less between EEG age and estimated CA most likely indicates the presence of a transient central nervous system (CNS) dysfunction. However, discrepancies of more than 3 weeks usually indicate the possibility of persistent CNS dysfunction and are frequently accompanied by other EEG abnormalities, including marked suppression of background activity or multifocal sharp waves.
Internal Dyschronism
This term refers to different maturational characteristics between the EEG during wakefulness and in the deepest stages of nonrapid eye movement (NREM) sleep (Figures 6.1 and 6.2). For example, characteristics of the waking EEG might be consistent with a CA of 38 weeks, whereas the background activity during NREM sleep might be consistent with a CA of 34 weeks. If dyschronism of 3 or more weeks occurs between these states, other EEG abnormalities are often present. These abnormalities are usually most apparent in NREM sleep, the state that always shows the least mature characteristics (Figure 6.3). Such findings suggest significant brain dysfunction. Therefore, an EEG of any infant should include a period of the deepest stages of NREM sleep.
Transient Maturational Abnormalities
Maturational abnormalities may occur transiently in a newborn experiencing acute and ongoing encephalopathy. Therefore, the prognostic significance of an EEG for which developmental features are immature for the stated CA can be determined only by making serial tracings.
Abnormalities of Background Activity in Diffuse Brain Disturbance
There is no consensus on the classification of background abnormalities of the EEG in the neonate, particularly in considering hypoxic ischemic encephalopathy. Walsh et al. (2011) note that most of the classification systems do agree at the extremes, but that the moderately abnormal findings cause the most controversy in terms of their clinical significance.
Prolongation of Interburst Intervals in Premature Infants
The range of duration of normal interburst intervals is CA dependent (Figure 6.4) and, in older premature infants, state dependent (Figure 6.5). The longest acceptable single interburst interval duration according to CA has been reported to be 24 weeks CA, 60 seconds (Vecchierini et al., 2003); 26 weeks CA, 46 seconds; 27 weeks CA, 36 seconds (Selton et al., 2000); less than 30 weeks CA, 30 to 35 seconds; 31 to 33 weeks CA, 20 seconds; 34 to 36 weeks CA, 10 seconds; 37 to 40 weeks CA, 6 seconds (Hahn et al., 1989). In general, in considering interburst intervals within an individual record, the longest interval is measured, rather than assessing an average of intervals. Although a prolongation of the interburst interval may be secondary to a CNS insult, it may also be due to the use of sedative medications such as morphine (Young and da Silva, 2000) and sufentanil (Nguyen et al., 2003).
Episodes of Generalized and Regional Voltage Attenuation Associated With Multifocal Sharp Waves in Term Infants
Another finding of diffuse dysfunction in the term infant is the presence of generalized or regional episodes of voltage attenuation (Figure 6.6). Although abnormal, this suggests relatively mild diffuse dysfunction compared to other findings listed later. This finding often occurs in the presence of multifocal sharp waves.
Depression and Lack of Differentiation
Depressed beta activity, either focal or diffuse, is often the first manifestation of abnormal cortical function. After hypoxia-ischemia, faster frequencies tend to be depressed or obliterated. Lack of differentiation (i.e., the “undifferentiated EEG”) refers to virtual or complete disappearance of the polyfrequency activity normally present (Figure 6.7) (Selton and Andre, 1997). A depressed and undifferentiated EEG background often accompanies other abnormalities (Figure 6.8). However, in some instances, developmental milestones may persist (Figure 6.9). Infants with hypoxic-ischemic encephalopathy may be acutely treated with hypothermia. The EEG may initially be depressed and undifferentiated and may either persist or evolve during the cooling period. This may include emergence of polyfrequencies, multifocal sharp waves, continuity and, at times, electrographic seizures (Figure 6.10) (Boylan et al., 2015; Glass et al., 2014; Low et al., 2012; Shah et al., 2014; Wusthoff et al., 2011).
A depressed and undifferentiated EEG in the newborn indicates that a severe brain insult has occurred. Disorders causing such an EEG include profound hypoxia, severe metabolic disorders, infectious processes such as meningitis or encephalitis, and intraventricular hemorrhage (IVH). A depressed and undifferentiated EEG within the first 24 hours after birth that persists signifies a poor prognosis.
Suppression-Burst Pattern
The suppression-burst pattern represents an intermediate degree of diffuse brain disturbance between the depressed and undifferentiated EEG and electrocerebral silence. Activity during the bursts consists primarily of delta and theta frequencies, which, at times, are intermixed with sharp waves. The bursts are separated by periods of marked generalized voltage attenuation or electrocerebral silence (Figures 6.11–6.19). Suppression-burst patterns persist unremittingly; no change in the EEG activity is seen during the entire recording and the pattern does not react to painful stimuli. Some infants with the suppression-burst pattern may experience periodic slow myoclonic jerks (Figure 6.17). Although typically synchronuous on the two sides, the bursts may appear asynchronously, possibly in association with congenital anomalies of the brain (Figure 6.18).
Electrocerebral Silence
Electrocerebral silence represents the ultimate degree of depression and lack of differentiation in the neonate. The transition from a severely depressed and undifferentiated background to one that is isolectric may be difficult to determine (Figure 6.20) and serial EEGs may be required to demonstrate a persistent degree of cortical inactivity (Figure 6.21). An isoelectric EEG (i.e., “electrocerebral silence”) is evidence of severe cortex dysfunction, not that of the brainstem, which, in the infant, may sustain vital functions for prolonged periods in the absence of cortical function. Indeed, prolonged survival may occur in infants whose EEGs continue to show electrocerebral silence (Mizrahi et al., 1985). The finding of electrocerebral silence on EEG in the newborn is not used to support a determination of brain death.
Specialized Generalized Patterns
Hypsarrhythmia
The classical hypsarrhythmic pattern as described by Gibbs and Gibbs (1952) rarely appears before 44 weeks CA. However, one modification of this pattern in the neonatal period is the suppression-burst variant (Hrachovy et al., 1984) (Figure 6.19). The bursts consist of asynchronous, high-voltage slow activity mixed with multifocal spikes and sharp waves. The primary features that distinguish this variant of hypsarrhythmia are the periodicity of the bursts and the high voltage of the activity within the bursts.
Patients with infantile spasms and this variant have a poor prognosis for long-term outcome, regardless of whether the pattern develops in the neonatal period or in later months of life (Maheshwari and Leavons, 1975). In addition, when this pattern does appear in the neonatal period, it is closely associated with the presence of inborn errors of metabolism, most notably nonketotic hyperglycemia.
Holoprosencephaly
The term holoprosencephaly is applied to a spectrum of related cerebral malformations resulting from faulty diverticulation of the prosencephalon. The malformation varies in severity, from arhinencephaly (in which the olfactory bulbs and tracts are absent but the brain is otherwise normal) to alobar holoprosencephaly (in which lobes are not demarcated and the cerebrum is monoventricular, with or without a dorsal cyst). A variety of median facial defects (including cyclopia, orbital hypotelorism, cleft lip, cleft palate, and hypoplasia of the premaxilla) are associated with the cerebral malformations (DeMyer and Zeman, 1963; Yakovlev, 1959).
The EEG findings associated with holoprosencephaly were described by DeMyer and White (1964). They include: (a) multifocal spike and polyspike activity mixed with slow waves; (b) periods of monorhythmic beta-, alpha-, theta-, or delta-frequency activity, occurring singly or in various combinations; (c) asynchrony between hemispheres; (d) isoelectric or relatively low-voltage activity; (e) periodic patterns; and (f) lack of any normal organization (Figures 6.22–6.24). These findings occur in various combinations in a single patient. Equally dramatic are the continuous and abrupt changes from one pattern to another, such that within few minutes, most or all of the aforementioned features can be visualized. This constellation of findings is not seen in other disorders of infancy and is therefore diagnostic for holoprosencephaly. Infants with holoprosencephaly often have unusual or stereotyped movements suggestive of seizures. However, there is no correlation between these movements and EEG changes. The prognosis is poor; about 50% of infants die within the first month of life; about 80% will not survive past the first year.
PATTERNS THAT MAY BE FOCAL OR GENERALIZED
Sustained Rhythmic Alpha and Theta Activity
Sustained, rhythmic 4 to 7 Hz activity (theta) and/or 8 to 10 Hz (alpha), 40 to 100 µV activity that is generalized or focal is an abnormal finding. However, precise correlations to specific etiologic factors have not, for the most part, been determined. This activity may occur almost continuously or paroxysmally in brief runs and may occur as theta, alpha, or mixed activity (Figures 6.25–6.30).
When alpha activity occurs focally, it is most prevalent in the central or temporal regions, where it may occur independently on the two sides. Although this activity may be most prominent in the awake state, it is usually present in all states and is usually accompanied by other abnormalities such as abnormal sharp waves. Generalized rhythmic alpha activity has been associated with various underlying abnormalities, most commonly congenital heart disease; However, it also may be seen in infants who have received CNS-active drugs such as diazepam and phenobarbital (Hrachovy and O’Donnell, 1999). It is important to distinguish this pattern from the alpha seizure pattern (see Chapter 7).
Sustained Rhythmic Delta Activity
In some instances bifrontal slow (delta) activity is considered an abnormal finding. Abnormal bifrontal slow activity can be differentiated from normal bifrontal slow activity by its presence in all stages of sleep and wakefulness and its unrelenting character (Figure 6.31). Abnormal rhythmic slow (delta) activity also may be present in the occipital regions bilaterally (Figure 6.32).
FOCAL ABNORMALITIES
Periodic Complexes
Periodic and quasiperiodic discharges in a newborn’s EEG have been reported to occur in association with various CNS injuries. They are believed to be suggestive of the presence of neonatal herpes simplex virus encephalitis (HSVE) (Mikati et al., 1990; Mizrahi and Tharp, 1982) (Figure 6.33). While such periodic discharges may be associated with HSVE, some may also be interpreted as electrical seizures of the depressed brain type (see Chapter 7). In addition, periodic discharges are not, however, peculiar to HSVE and may occur with various other CNS insults such as infarction (Randò et al., 2000; Scher and Beggarly, 1989).
Unilateral Depression of Background Activity
Mild shifting asymmetry of the background EEG activity between hemispheres is a common finding in the newborn, particularly during NREM sleep. However, an abnormal finding is a marked voltage asymmetry of background rhythms between hemispheres that persists in all states (Figures 6.16 and 6.34–6.36). Unilateral depression may occur in association with a wide range of structural cerebral lesions such as infarction, hemorrhage, focal cystic lesions, and rarely, congenital malformations. In addition, other intracranial abnormalities such as subdural fluid collections may be associated with this EEG finding. However, focal depression of the background activity may also persist for variable periods after electrical seizures. A marked asymmetry of the background activity may also result from nonintracranial causes such as subgaleal swelling, scalp edema, or technical error.
Focal Slow Activity
Just as in older infants, the finding of focal slow activity that persists at a specific site may indicate the presence of a focal destructive lesion such as infarct, hemorrhage, or, more specific to neonates, congenital anomalies of the brain (Figure 6.37).
Central Positive Sharp Waves
These waves are 50 to 250 µV surface-positive transients lasting 100 to 250 ms and occurring either unilaterally or bilaterally in the central regions (Figures 6.38–6.40). A lower voltage after-going surface-negative component may be present. The waves usually occur singly or in brief runs. Central positive sharp waves are not epileptiform discharges, and the physiological processes causing them remain unknown. They have been described most notably in infants with IVH (Blume and Dreyfus-Brisac, 1982; Cukier et al., 1972; Lomboso, 1982; Tharp et al., 1981), and white matter necrosis (periventricular leukomalacia) (Lombroso, 1982; Marret et al., 1986; Novotny et al., 1987). They have also been associated with “major ultrasound lesions” such as grade III IVH, periventricular hemorrhagic infarction, cystic periventricular leukomalacia, persistent periventricular echodensities, and persistent ventricular dilatation (Castro Conde et al., 2004). The timing of the recording in relation to the occurrence of the hemorrhage may influence their appearance (Clancy and Tharp, 1984; Kidokoro et al., 2009). Current thought is that the finding of central positive sharp waves is not specific for IVH but rather for white matter necrosis, which may result from a variety of insults, including IVH (Novotny et al., 1987). In addition, the abundance and rate of recurrence of central positive sharp waves within a single record of an infant appear to correlate with long-term neurological outcome; a rate of greater than 2 per second has been associated with a poor outcome (Blume and Dreyfus-Brisac, 1982; Kidokoro et al., 2009; Nosralla et al., 2009). Other conditions such as meningitis, hydorcephalus, amino-aciduria (Tharp, 1980), and asphyxia (da Costa and Lombroso, 1980) have also been associated with central positive sharp waves.
Temporal Sharp Waves
The problems of determining whether sharp waves that occur in the temporal regions are normal or abnormal have been previously discussed (see Chapter 5). Whereas some sharp waves occurring in the temporal regions are considered normal, others may not meet the criteria to be called abnormal and are thus of questionable significance. However, there are temporal sharp waves that are clearly abnormal. Criteria for abnormality include morphology, polarity, rate of recurrence, and persistence at one site (Figures 6.41–6.44). They may be, although not always, associated with focal injury in the region of occurrence. They are not considered to be interictal epileptiform findings (see Chapter 7).
Extratemporal Focal Sharp Waves
Abnormal sharp waves that appear as slow sharp transients or rapid spikes may occur in the frontal (Figures 6.45–6.51), central, (Figures 6.52–6.54) and occipital (Figures 6.55–6.57) regions. When persistently focal, they may suggest focal brain injury, although often no well-defined structural lesion can be documented by neuroimaging.
Multifocal Sharp Waves
As already noted, sharp waves in the newborn EEG are common, with certain sharp-wave activity being considered “normal.” Multiple foci of high-voltage, long-duration, sharp-wave activity are commonly seen in infants who have experienced a diffuse CNS insult (Figures 6.58–6.61). Such abnormal sharp waves usually predominate in the temporal regions and may persist over one hemisphere. As noted, multifocal sharp waves usually accompany various other EEG abnormalities, including depressed and undifferentiated background activity, episodes of attenuation, and rhythmic bifrontal delta activity. Multifocal sharp waves may be the only abnormality after a CNS insult and may also be the last remaining evidence of CNS dysfunction in serial tracings. This abnormality is usually maximal in NREM sleep, and in some infants it may occur only in this state (Figure 6.3). Multifocal sharp waves cannot be used as evidence that a seizure has occurred or will occur, because the sharp waves do show a significant association with neonates with seizures.
LIST OF FIGURES
Dyschronism
Figure 6.1 Internal dyschronism.
Figure 6.2 Internal dyschronism.
Figure 6.3 Internal dyschronism with state-dependent abnormality on the EEG.
Prolongation of Interburst Intervals
Figure 6.4 Low-voltage bursting and prolonged interburst interval in prematurity.
Figure 6.5 Excessive discontinuity.
Voltage Attenuation
Figure 6.6 Generalized and regional episodes of voltage attenuation.
Depression and Lack of Differentiation
Figure 6.7 Undifferentiated background activity.
Figure 6.8 Undifferentiated background activity with periods of generalized voltage attenuation.
Figure 6.10 Monitoring during hypothermia protocol.
Suppression-Burst Pattern
Figure 6.12 Suppression-burst activity with activity of normal character within the bursts.
Figure 6.14 Suppression-burst activity with predominance of fast activity within the bursts.
Figure 6.15 Suppression-burst activity with rhythmic alpha activity within the bursts.
Figure 6.16 Suppression-burst activity with persistent asymmetry of activity within the bursts.
Figure 6.17 Suppression-burst activity with synchronous bursts associated with myoclonus.
Figure 6.18 Asynchronous suppression-burst pattern.
Figure 6.19 Suppression burst with multifocal, high-voltage spikes.
Severe Depression of Background
Figure 6.20 Depressed and undifferentiated background activity.
Holoprosencephaly
Figure 6.22 Dynamic pattern of holoprosencephaly.
Figure 6.23 Dynamic pattern of holoprosencephaly.
Figure 6.24 Dynamic pattern of holoprosencephaly with persistent focal features.
Sustained Rhythmic Alpha–Theta Activity
Figure 6.25 Rhythmic bifrontal theta activity.
Figure 6.26 Paroxsymal bifrontal theta activity.
Figure 6.27 Rhythmic bifrontal theta activity followed by rhythmic bifrontal alpha activity.
Figure 6.28 Generalized rhythmic alpha activity with variable interhemispheric asynchrony.
Figure 6.29 Generalized rhythmic alpha and theta activity.
Figure 6.30 Generalized rhythmic theta activity.
Sustained Rhythmic Delta Activity
Figure 6.31 Rhythmic, monomorphic, bifrontal delta activity.
Figure 6.32 Rhythmic bioccipital slow activity.
Periodic Complexes
Unilateral Depression of Background Activity
Figure 6.34 Voltage asymmetry.
Figure 6.35 Voltage asymmetry with mildly abnormal background activity.
Figure 6.36 Voltage asymmetry associated with abnormal background activity.
Focal Slow Activity
Figure 6.37 Focal slow activity in the left occipital region.
Central Positive Sharp Waves
Figure 6.38 Surface positive sharp waves in the premature.
Figure 6.39 Occurrence and location of surface positive sharp waves.
Figure 6.40 Surface positive sharp waves with moderate voltage.
Temporal Sharp Waves
Figure 6.41 Temporal sharp waves with complex morphology.
Figure 6.42 Surface positive temporal sharp waves.
Figure 6.43 Asynchronous, independent surface positive temporal sharp waves.
Figure 6.44 Surface positive sharp waves in the temporal region with complex morphology.
Extratemporal Focal Sharp Waves
Figure 6.45 Abnormal frontal sharp waves.
Figure 6.46 Bursts of abnormal frontal sharp waves.
Figure 6.47 Independent bilateral abnormal frontal sharp waves.
Figure 6.48 Bilateral frontal spikes.
Figure 6.49 Bilateral frontal sharp waves.
Figure 6.50 Frontal sharp waves and independent central spikes.
Figure 6.51 Midline and lateralized frontal spikes and sharp waves.
Figure 6.52 Central rapid spikes.
Figure 6.53 Repetitive midline central spikes.
Figure 6.54 Central midline, rhythmic theta, and lateralized central spikes.
Figure 6.55 Occipital spike and slow waves.
Figure 6.56 Occipital spikes and independent temporal and central sharp waves.
Figure 6.57 Bilateral, independent occipital spikes.
Figure 6.58 Multifocal sharp waves.
Figure 6.59 Multifocal spikes and sharp waves.
Figure 6.60 Multifocal sharp waves with rhythmic morphology.
Figure 6.61 Surface positive and surface negative multifocal sharp waves.
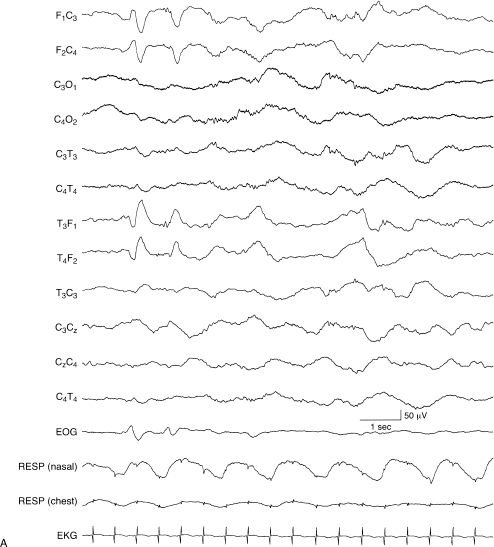
Figure 6.1 (A) and (B) Internal dyschronism. (A) Transitional sleep, 38 to 40 weeks CA. The developmental features of the EEG in this term infant in transitional sleep are consistent with a conceptional age of 38 to 40 weeks and are within the range of normal variation.
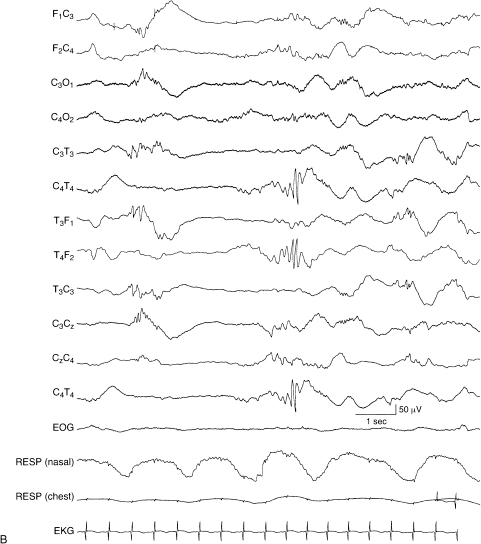
Figure 6.1 (B) In deep NREM sleep, during the same recording of the infant, the developmental features of the EEG are consistent with the CA of 33 weeks, with central beta–delta complexes and temporal alpha bursts. This NREM sleep recording is also without abnormalities.

Figure 6.2 (A)–(C) Internal dyschronism. (A) The awake EEG is characterized by continuous polyfrequency activity consistent with the stated conceptional age of 39 weeks.
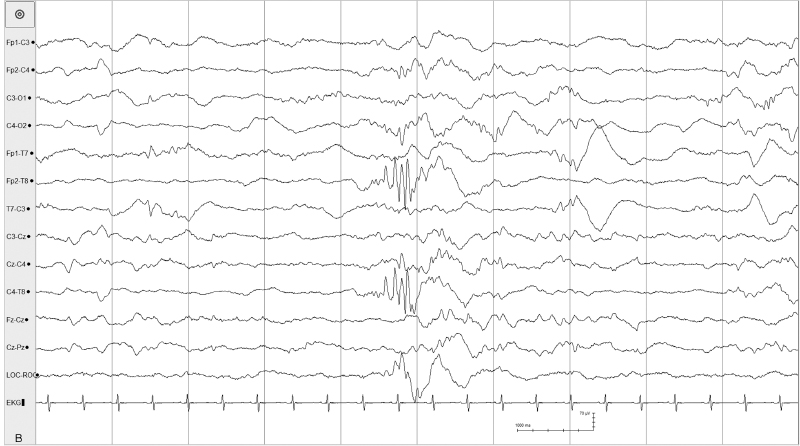
Figure 6.2 (B) The EEG in the same infant during sleep is consistent with a CA of 32 to 33 weeks. The background is discontinuous with some asynchrony. There is a temporal alpha burst and beta–delta complexes.
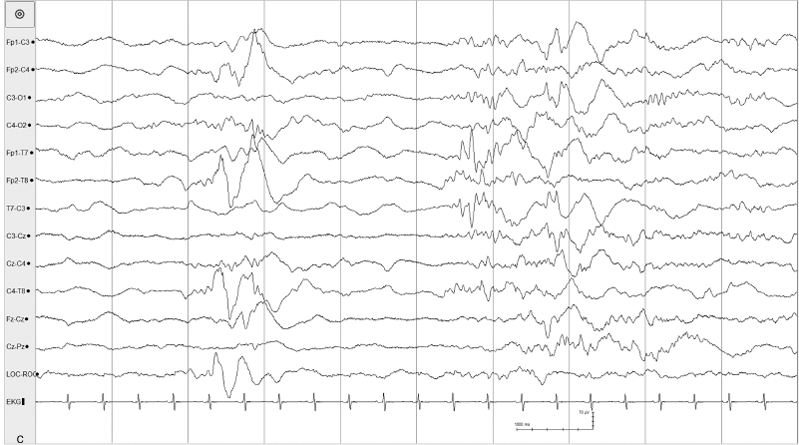
Figure 6.2 (C) Further discontinuity, asynchrony, and a temporal theta burst and beta–delta complexes. This infant had MRI findings of simplified gyral pattern, focal polymicrogyria, delayed myelination, and evidence of small lacune focal intrauterine ischemic insult.
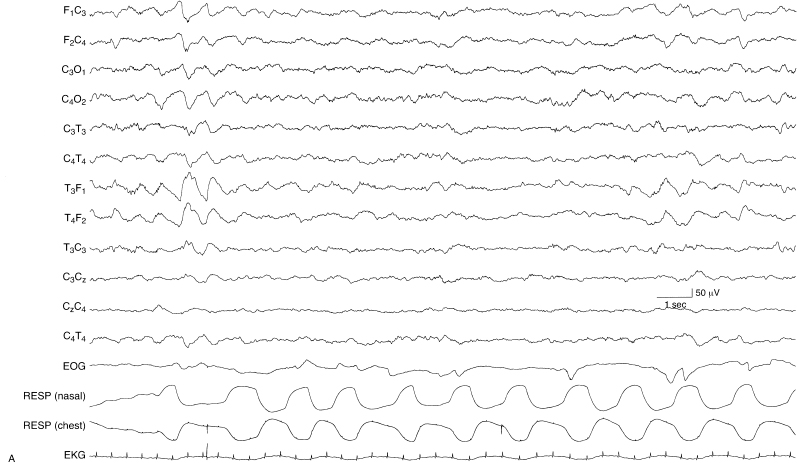
Figure 6.3 (A) and (B) Internal dyschronism with state-dependent abnormality on the EEG. (A) The awake EEG of this term infant, suspected of hypoxic-ischemic encephalopathy, is within the range of normal variation and its developmental features are consistent with that conceptional age.
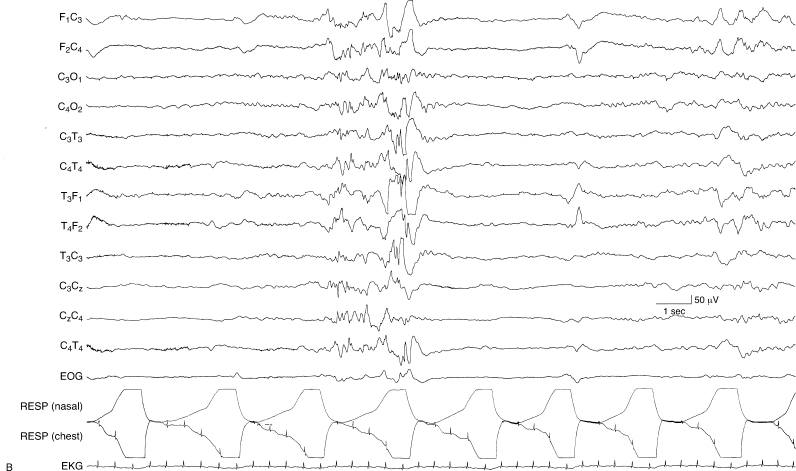
Figure 6.3 (B) During NREM sleep, the EEG is abnormal, with excessive discontinuity, asynchronous activity including sharp waves and spikes during periods of bursting, and no well-defined developmental milestones.
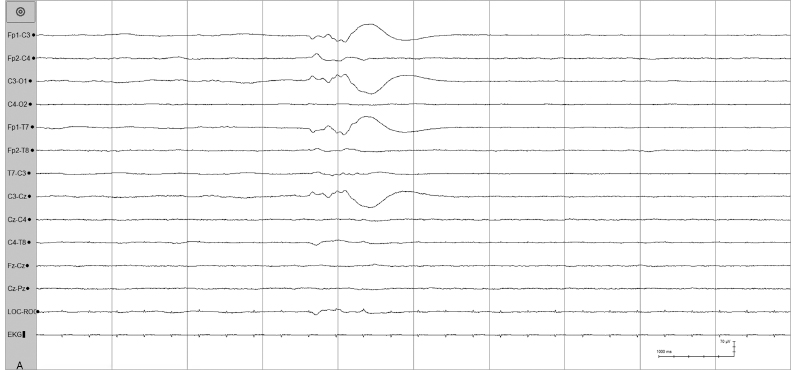
Figure 6.4 (A) and (B) Low-voltage bursting and prolonged interburst interval in prematurity. (A) Low-voltage bursting with relatively brief interburst intervals in a 26-week CA infant.
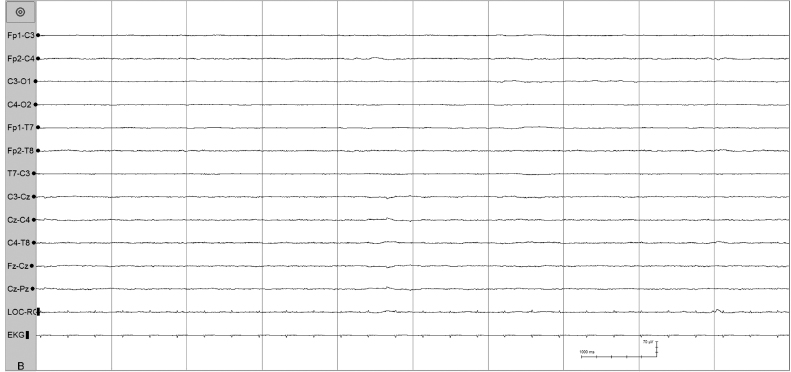
Figure 6.4 (B) In the same recording, this is a segment of an interburst interval which eventually lasted 100 seconds.
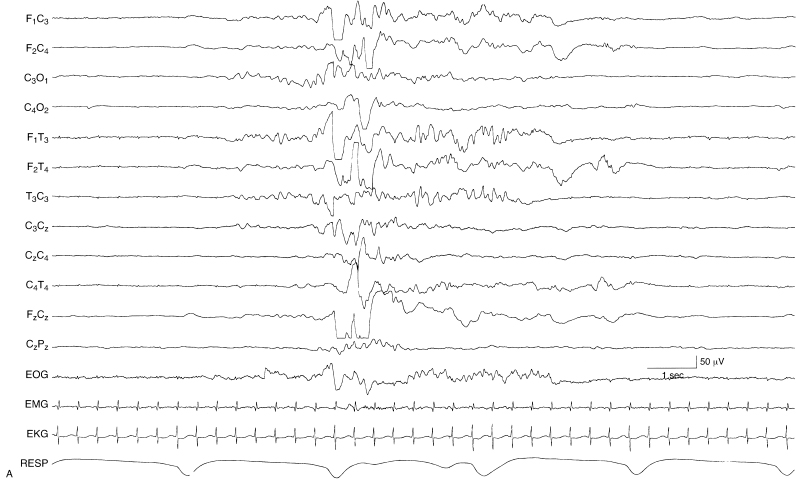
Figure 6.5 (A) and (B) Excessive discontinuity. During NREM sleep, the degree of discontinuity is excessive for the infant’s CA of 35 weeks. This is shown in two contiguous segments (A) and (B). In addition, there is an absence of beta–delta complexes. This infant was found to have grade III IVH bilaterally.
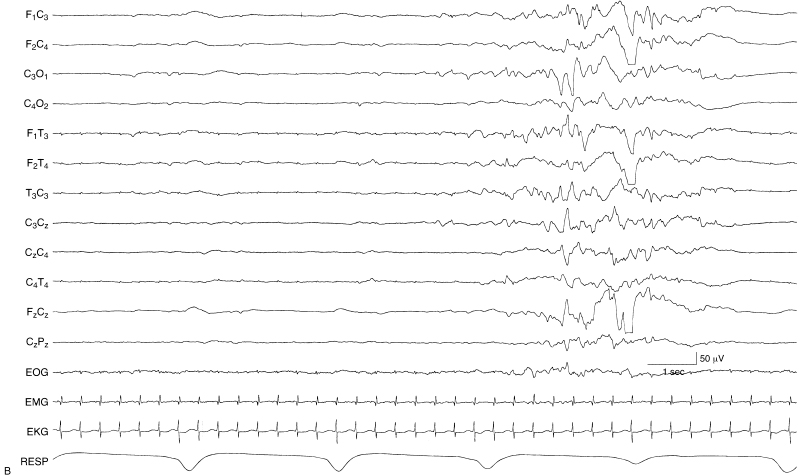
Figure 6.5 (continued)
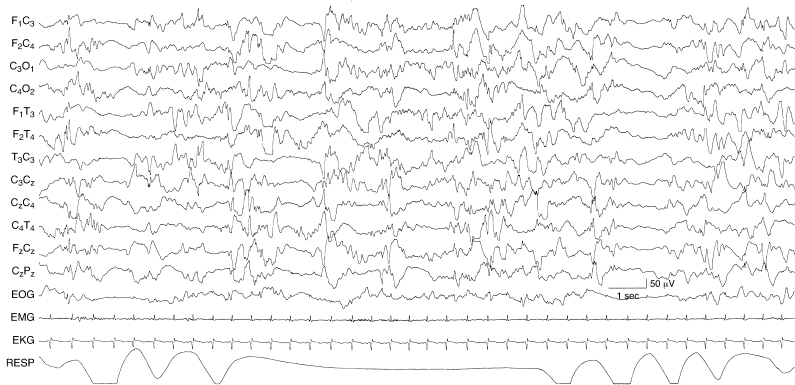
Figure 6.6 Generalized and regional episodes of voltage attenuation. There are brief episodes of generalized voltage attenuation lasting 1 to 2 sec and episodes of similar character and duration appearing independently in leads from the left and right hemispheres. The background activity is also abnormal with multifocal sharp waves. The EEG is from a 40-week CA infant who is lethargic and with CT neuroimaging findings of biparietal white matter lucencies. No specific etiology was identified.
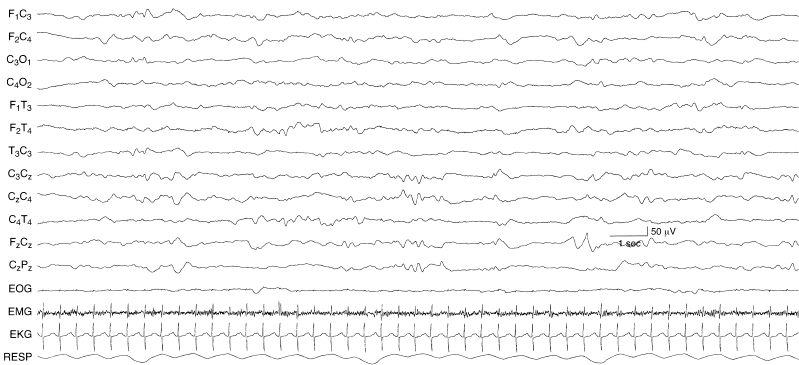
Figure 6.7 Undifferentiated background activity. The background EEG activity is undifferentiated. There is a lack of developmental milestones and a lack of activity of faster frequencies. The EEG is composed almost exclusively of moderate voltage slow activity. The infant is 43-week CA with the inborn error of metabolism, methylmalonic acidemia.

Figure 6.8 Undifferentiated background activity with periods of generalized voltage attenuation. The background activity is low in voltage and characterized by low- to moderate-voltage slow (theta and delta) activity with no alpha or beta activity. There are periods of generalized voltage attenuation early and late in the sample shown. The EEG is from a 41-week CA infant with renal failure and metabolic acidosis who was on renal dialysis at the time of recording.
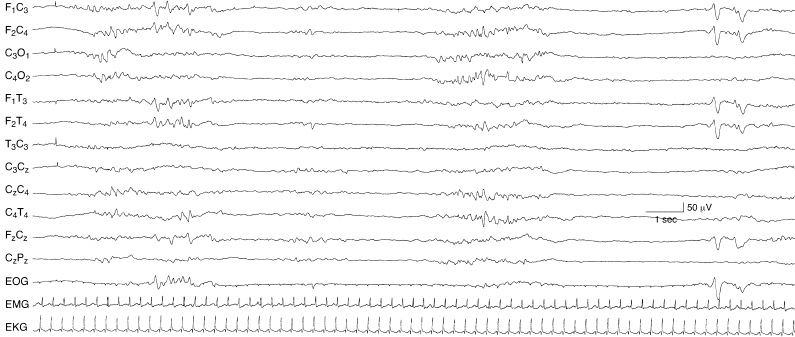
Figure 6.9 Undifferentiated background with episodes of generalized voltage attenuation, but with preservation of some developmental milestones. The background activity is undifferentiated. There is intermittent rhythmic theta activity that occurs between episodes of generalized voltage attenuation. Early in the sample, there are abnormal sharp waves in the frontal regions. However, later in the sample, normal frontal sharp transients are present. Such findings can be distinguished from a suppression-burst pattern when other portions of the EEG are continuous and by the presence of normal developmental milestones. The EEG is from a 39-week CA infant with congenital heart disease and chronic hypoxemia.
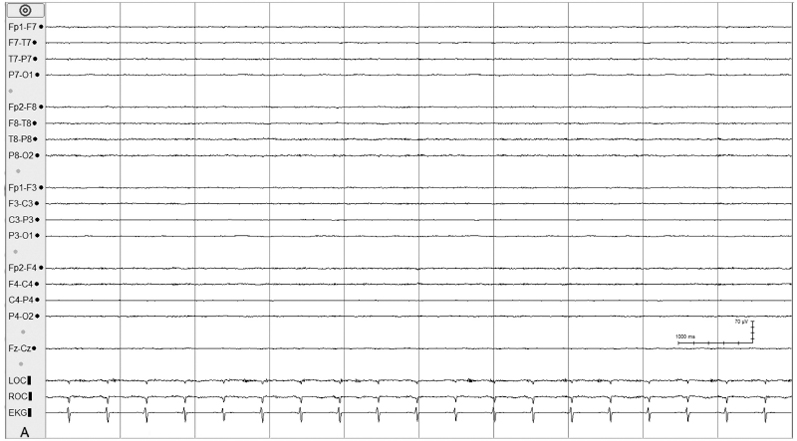
Figure 6.10 (A)–(C) Monitoring during hypothermia protocol. (A) Day 1 of hypothermia protocol (temperature 90.1°F, 32.3°C). The background activity is depressed and undifferentiated in the EEG of this 38-week CA infant with hypoxic ischemic encephalopathy.
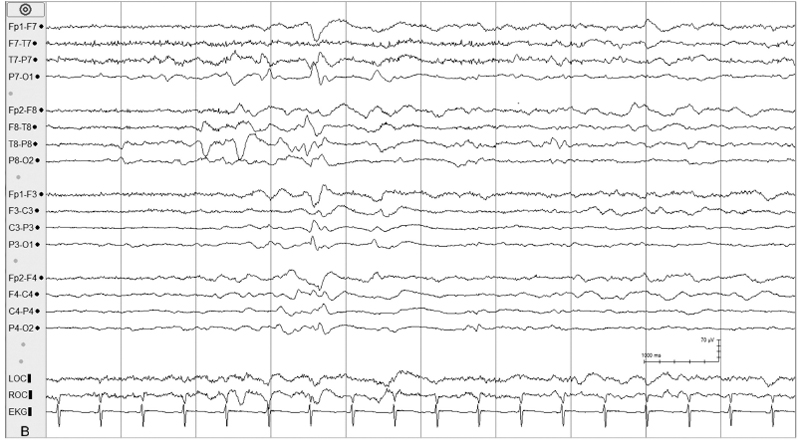
Figure 6.10 (B) Day 3 of hypothermia protocol; the background has evolved to relatively continuous activity with multifocal sharp waves.
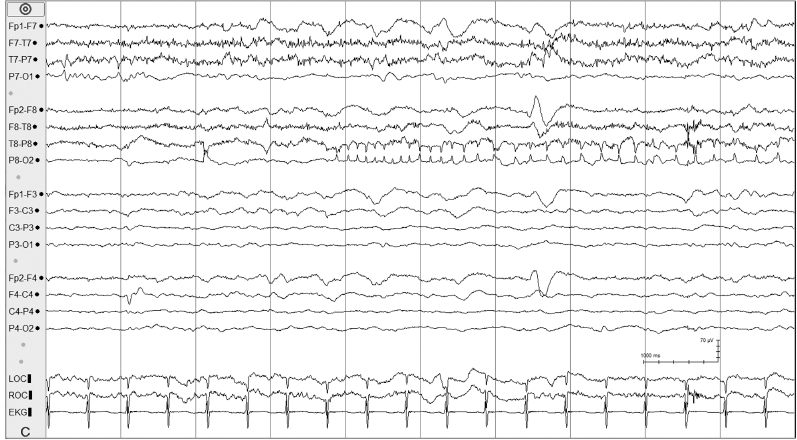
Figure 6.10 (C) Day 3 of hypothermia protocol; electrical seizure activity emerges in the right parietal region.
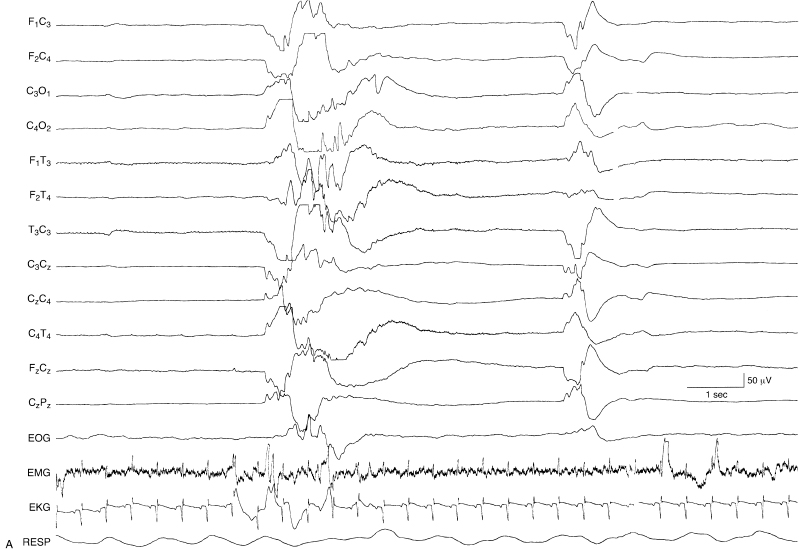
Figure 6.11 (A) and (B) Suppression-burst activity with sharp and slow waves within the bursts and variable durations between bursts. The brief bursts are characterized by high-voltage slow activity with superimposed theta and alpha activity. The bursts are followed by high-voltage very slow-wave transients. The periods of suppression are variable in these contiguous samples (A) and (B), lasting from 3 sec to over 10 sec. This EEG was recorded from a 35-week CA infant who was lethargic with hypoxic-ischemic encephalopathy, microcephaly, and the finding of periventricular leukomalacia on head CT.
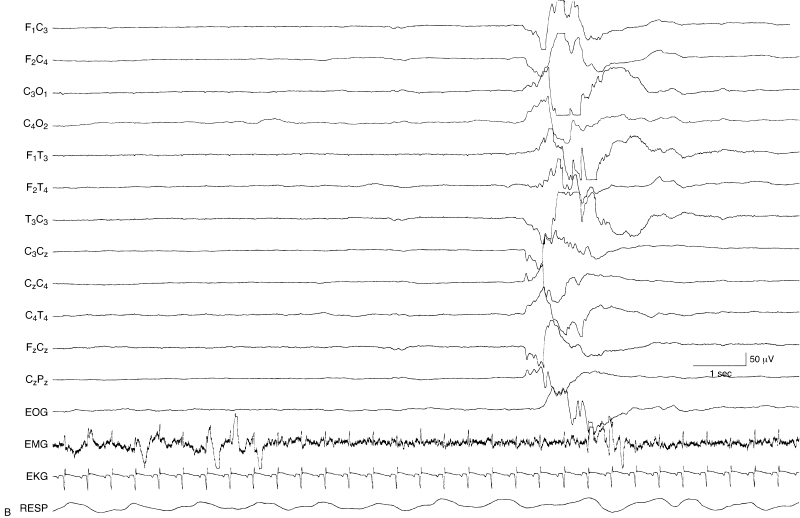
Figure 6.11 (continued)
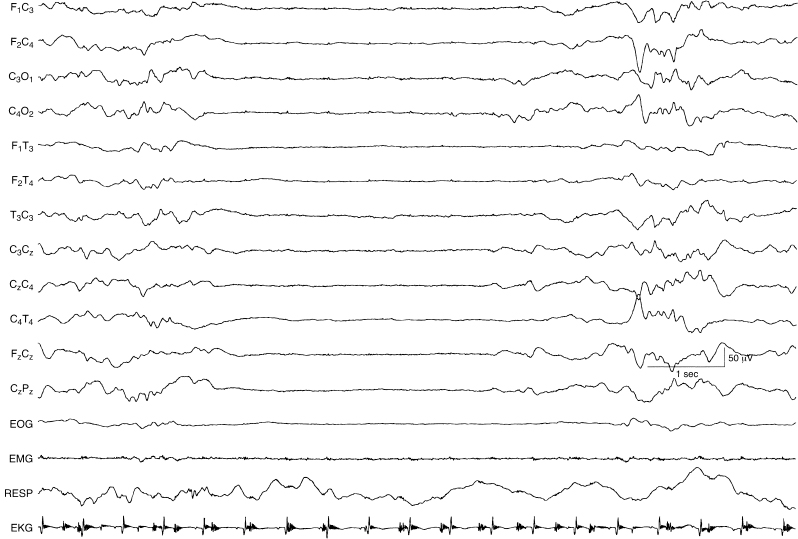
Figure 6.12 Suppression-burst activity with activity of normal character within the bursts. The bursts are characterized by moderate-voltage activity of mixed slow and faster frequencies, that if continuous, would be considered normal for this full-term infant. However, the background activity is suppression burst. This term infant suffered meconium aspiration, required ventilatory support, and, by the time of this recording, was maintained with ECMO.
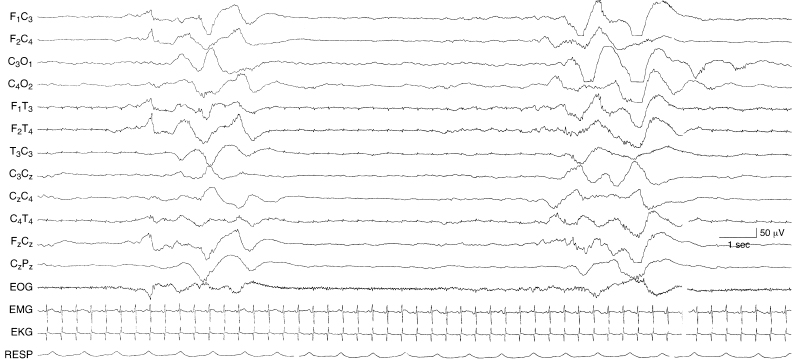
Figure 6.13 Suppression-burst activity with bursts of asynchronous, very slow, and superimposed fast activity. The bursts are characterized by high voltage, very slow activity with superimposed low voltage faster activity. This occurs asynchronously on the two sides. The infant is 37-weeks CA, with hypoxic-ischemic encephalopathy, multisystem organ failure, and intracerebral hemorrhage on the left—in this instance with no consistent lateralizing findings on EEG.
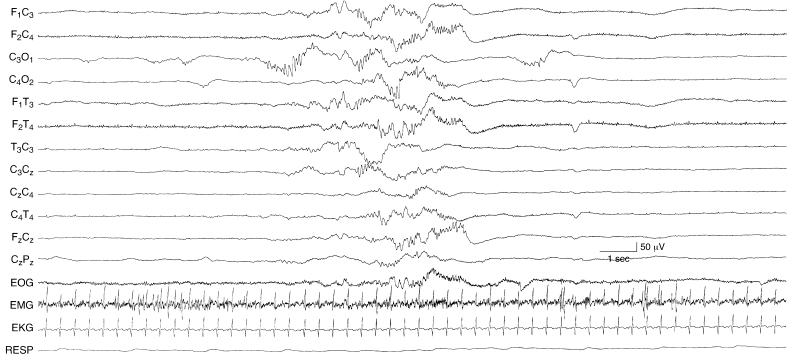
Figure 6.14 Suppression-burst activity with predominance of fast activity within the bursts. Runs of moderate-voltage fast activity are present asynchronously on the two sides during periods of bursting. The infant is 35-weeks CA with metabolic acidosis, cardiac failure, pulmonary edema, peritonitis, and microcephaly.
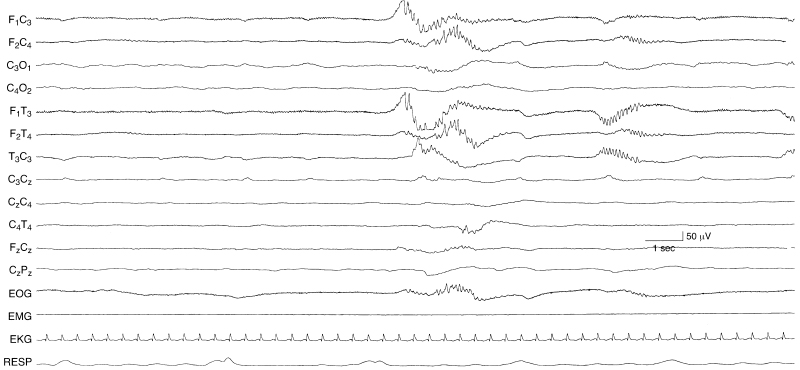
Figure 6.15 Suppression-burst activity with rhythmic alpha activity within the bursts. There are runs of moderate-voltage rhythmic alpha activity in the frontal temporal regions that appear asynchronously within the bursts of this suppression-burst recording. This EEG is from a 35-week CA infant with hypoxic-ischemic encephalopathy.
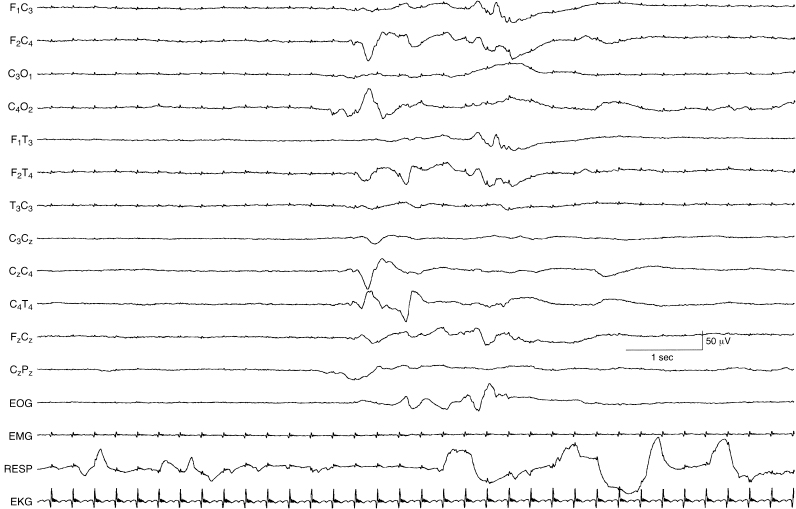
Figure 6.16 Suppression-burst activity with persistent asymmetry of activity within the bursts. The bursts are characterized by moderate-voltage theta and delta activity. There is a persistent voltage asymmetry of the bursts with the amplitudes of waves lower in leads from the left central-temporal region compared to homologous regions on the right. This term infant was born by emergency cesarean section and had persistent cyanosis requiring support by ECMO. The asymmetry on EEG is most likely due to dependent scalp edema on the left.
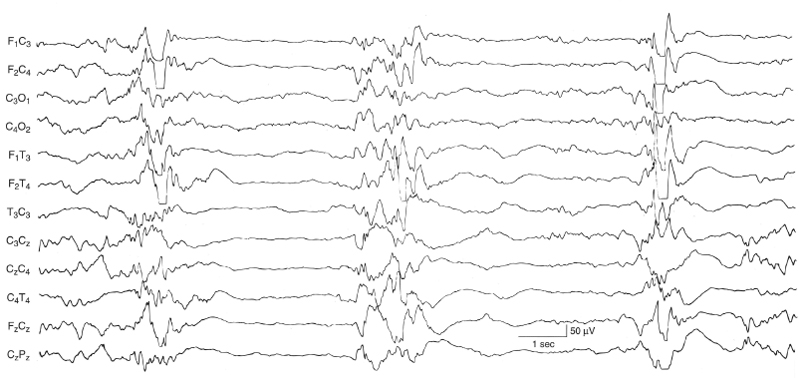
Figure 6.17 Suppression-burst activity with synchronous bursts associated with myoclonus. The bursts recur periodically every 3 to 5 sec, but are brief, lasting 1 to 2 sec with fairly synchronous activity on the two sides. This term infant experienced generalized myoclonic and focal clonic seizures with the eventual finding of the inborn error of metabolism, nonketotic hyperglycinemia. (Mizrahi and Kellaway, 1998, with permission.)
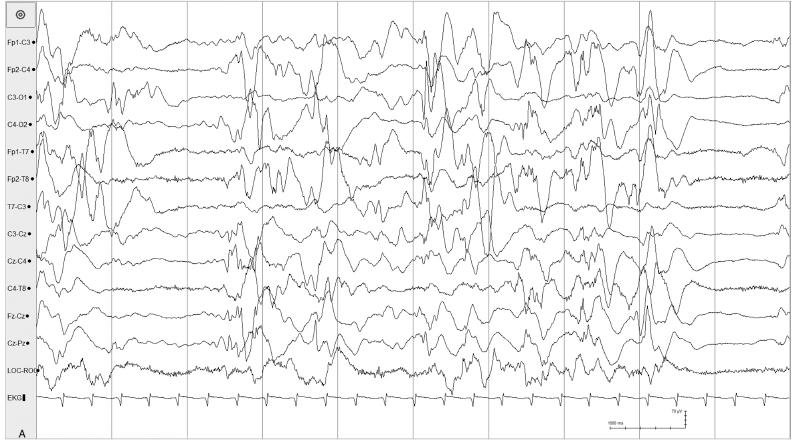
Figure 6.18 (A) and (B) Asynchronous suppression-burst pattern. (A) Suppression-burst pattern is present independently in the left and right hemispheres in this 40-week CA, 27-day infant with early infantile epileptic encephalopathy associated with an ARX mutation.
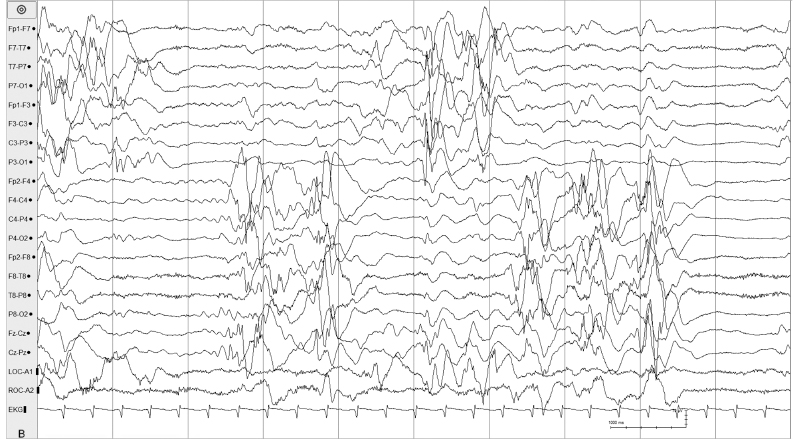
Figure 6.18 (B) The same sample shown in (A) is remontaged to more clearly demonstrate the asynchrony of the suppression-burst pattern.
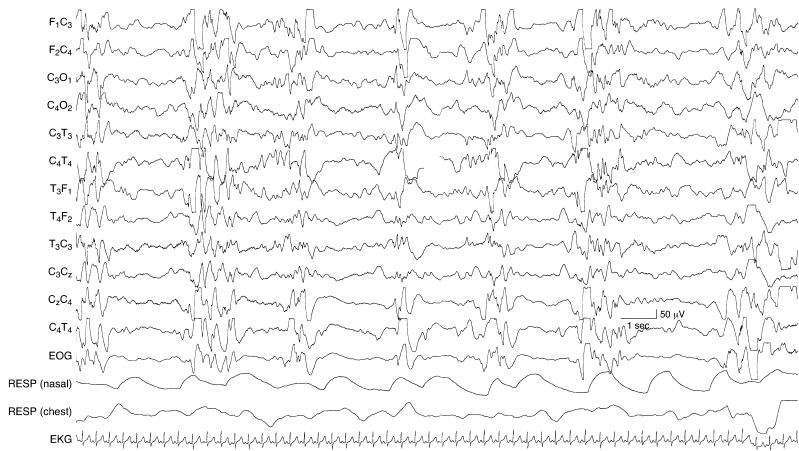
Figure 6.19 Suppression burst with multifocal, high-voltage spikes. This is a suppression-burst variant of hypsarrhythmia in a 43-week CA infant with an inborn error of metabolism and a clinical diagnosis of early myoclonic encephalopathy. The infant experienced infantile spasms that were accompanied by generalized voltage attenuations in the EEG (not shown).

Figure 6.20 Depressed and undifferentiated background activity. The background activity is severely depressed and undifferentiated in all regions with only ECG artifact and occasional very low voltage slow waves present. This EEG is from a 37-week CA infant with hypoxic-ischemic encephalopathy (APGAR scores 1 at 1 minute, 1 at 5 minute), multiorgan systems failure, and intracerebral hemorrhage.
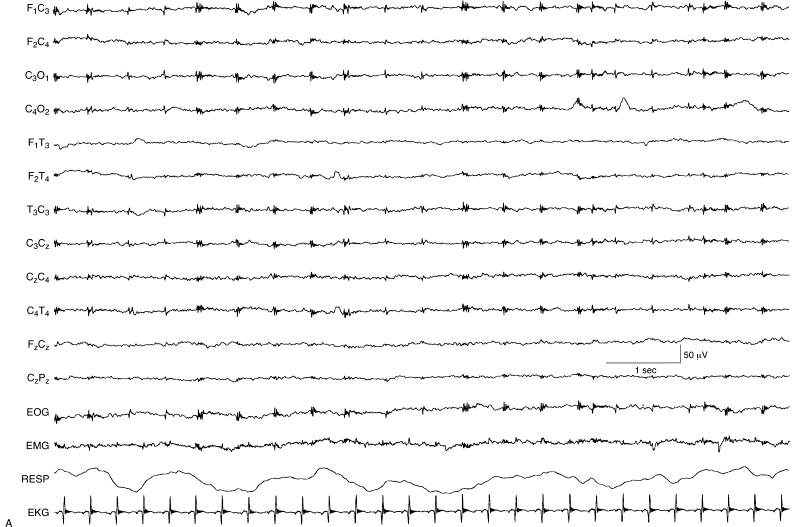
Figure 6.21 (A) and (B) Depressed and undifferentiated background activity (A) evolving to suppression-burst activity (B). (A) The EEG is depressed and undifferentiated with artifact from ECG and ECMO instrumentation. This EEG was recorded on Day 3 of life from this term infant with hypoxic-ischemic encephalopathy.
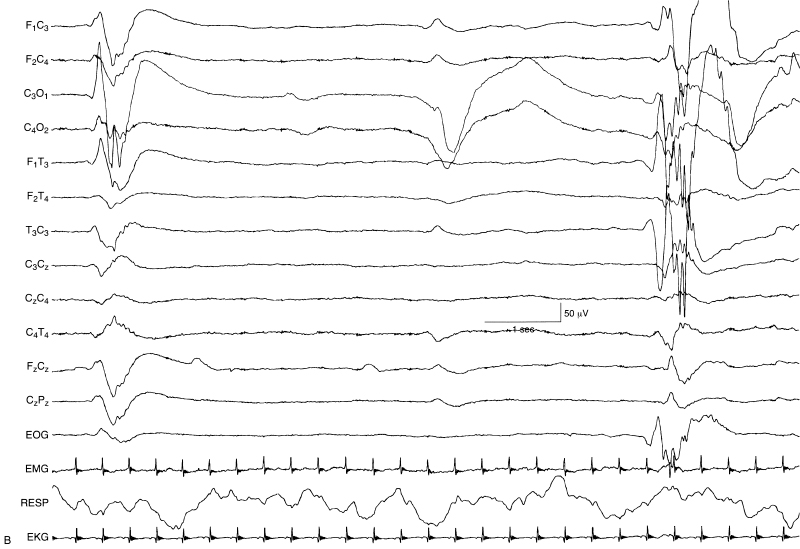
Figure 6.21 (B) On Day 10 of life, the EEG had evolved to a suppression-burst pattern. Although this represented a change in the EEG findings with some improvement, the rate of improvement and the change to only suppression burst suggest a poor prognosis in terms of neurological outcome.
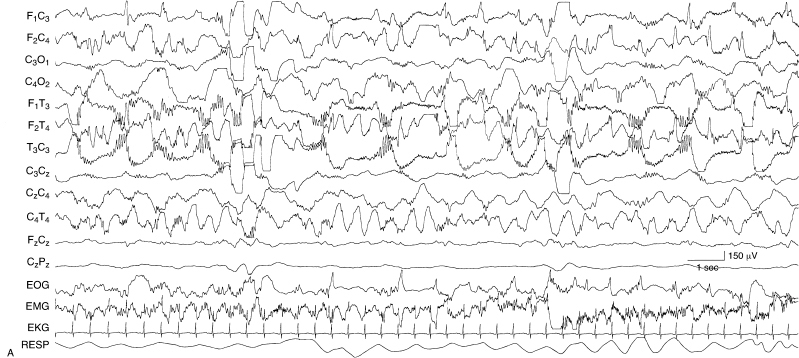
Figure 6.22 (A)–(C) Dynamic pattern of holoprosencephaly. These are samples from a single EEG recorded from a term infant with holoprosencephaly diagnosed by clinical and MRI findings. (A) There are multiple foci of spike and polyspike activity mixed with slow-wave activity. There is also independent delta activity with superimposed beta activity.
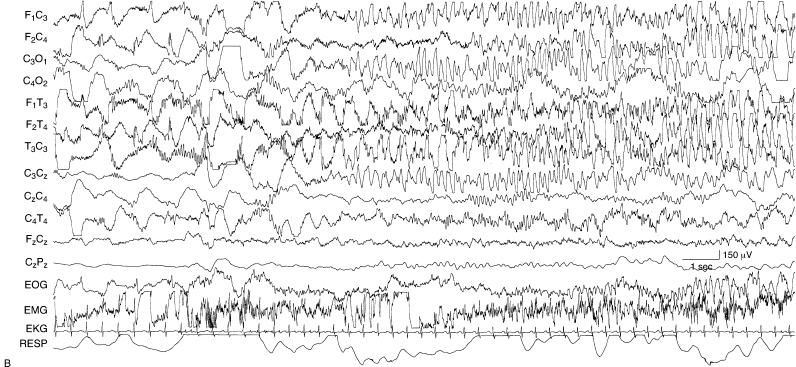
Figure 6.22 (B) There is a sudden transition to sustained rhythmic theta and alpha activity.

Figure 6.22 (C) There is a sudden transition to high-voltage rhythmic slow activity predominantly on the left. Note the voltage calibration that indicates the very high voltage of this activity.
Figure 6.23 (A)–(D) Dynamic pattern of holoprosencephaly. (A) High-voltage asynchronous rhythmic alpha activity is present in all regions in this 35-week CA age infant with alobar holoprosencephaly.
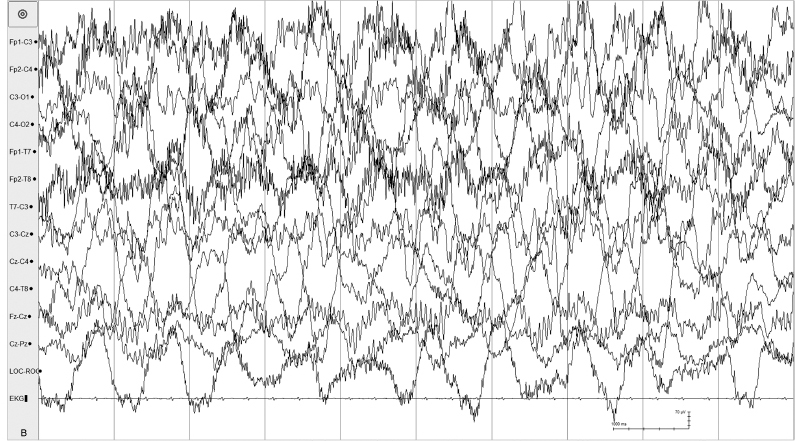
Figure 6.23 (B) High-voltage arrhythmic and asynchronous slow activity with superimposed fast activity is present in all regions in the same recording.
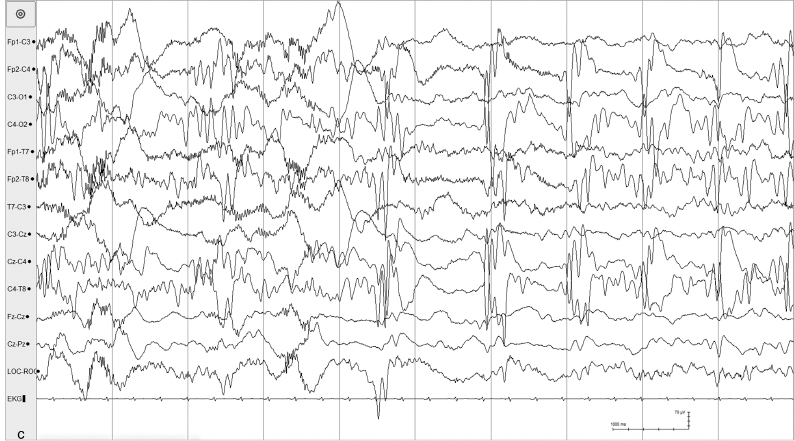
Figure 6.23 (C) Abrupt change in the character of the background from generalized asynchronous slow activity to high-voltage periodic sharp waves and rhythmic alpha activity also occurs in the same recording.
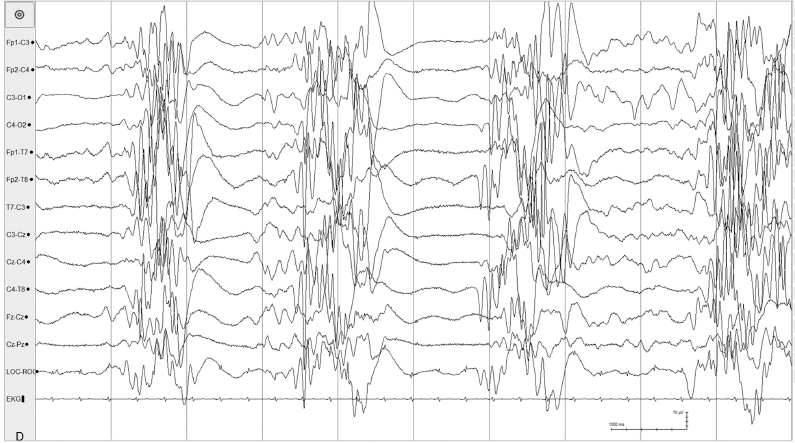
Figure 6.23 (D) Suppression-burst pattern with generalized high-voltage spike and sharp waves also occur in the same recording.
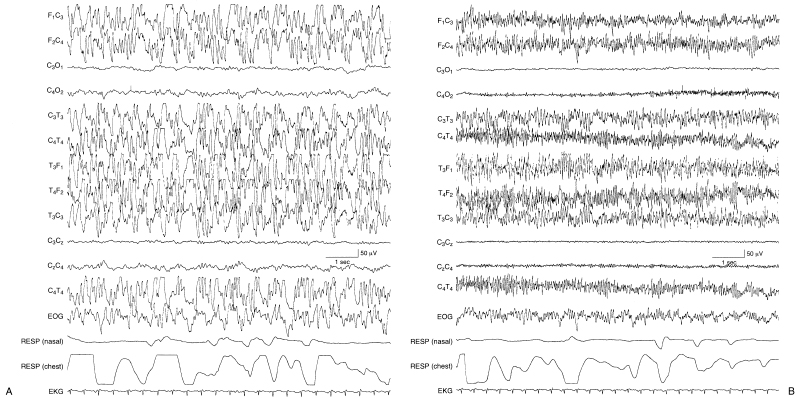
Figure 6.24 (A)–(D) Dynamic pattern of holoprosencephaly with persistent focal features. The EEG features that are typical in infants with holoprosencephaly are present in this term infant who, as part of the brain malformation, also has a dorsal cystic lesion in the occipital region that is characterized on EEG by marked depression of activity in that region. (A) High-voltage, rhythmic, alpha, and theta frequency activity is mixed with some slower waveforms. (B) High-voltage, rhythmic fast activity is present.
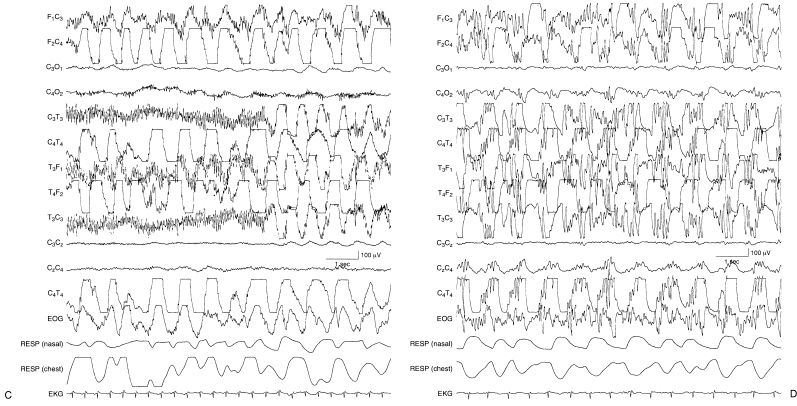
Figure 6.24 (C) High-voltage very slow activity is present on the right with the persistence of fast activity on the left until a sudden transition to slower frequencies on that side. (D) Asynchronous, high-voltage very slow activity with superimposed fast activity is present.

Figure 6.25 Rhythmic bifrontal theta activity. There is moderate-voltage rhythmic 5 to 6 Hz activity in the frontal regions bilaterally in this EEG that is otherwise normal in this term infant.
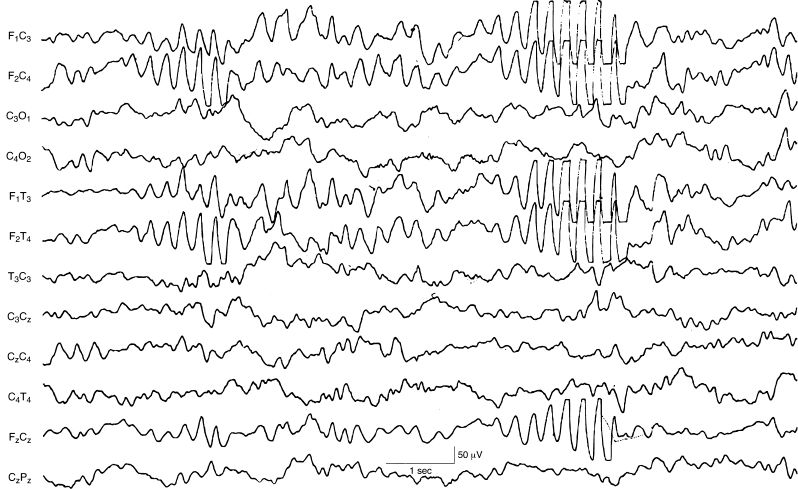
Figure 6.26 Paroxsymal bifrontal theta activity. There is paroxysmal moderately high-voltage 5 to 6 Hz activity in the frontal regions bilaterally. The EEG is otherwise normal in this term infant.
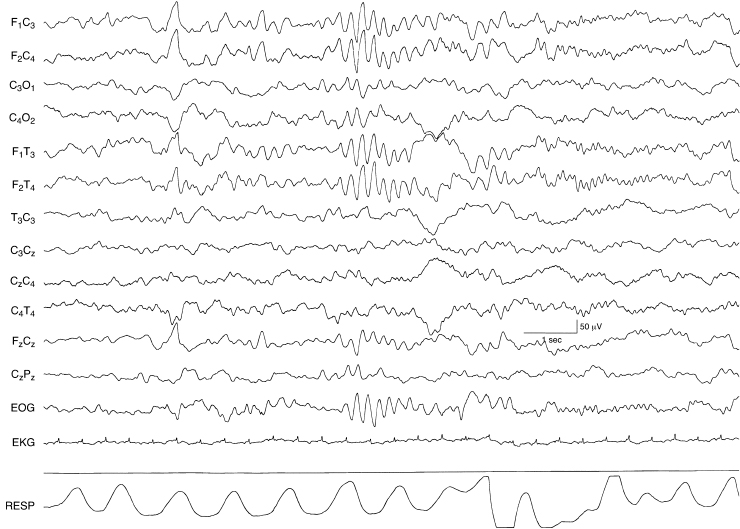
Figure 6.27 Rhythmic bifrontal theta activity followed by rhythmic bifrontal alpha activity. There is a burst of rhythmic high-voltage 5 to 6 Hz activity in the frontal regions bilaterally followed by a run of low-voltage rhythmic 8 to 9 Hz activity. The background EEG activity is otherwise normal in this term infant.
Figure 6.28 Generalized rhythmic alpha activity with variable interhemispheric asynchrony. There are runs of rhythmic 8 to 9 Hz activity occurring both synchronously and asynchronously in the left and right central regions in a term infant with a chromosomal abnormality and multiple congenital anomalies. (Hrachovy et al., 1990, with permission.)
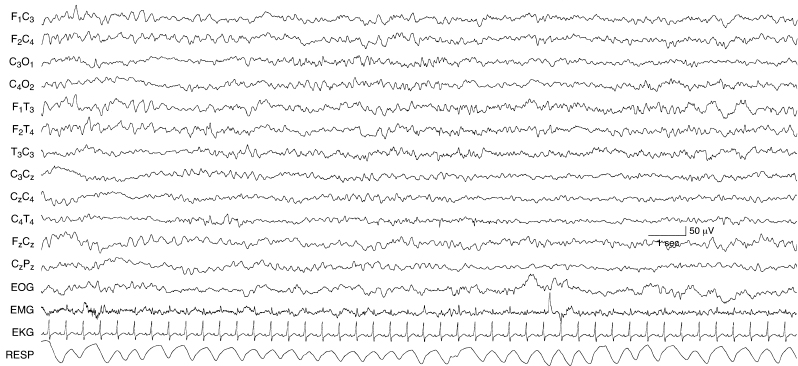
Figure 6.29 Generalized rhythmic alpha and theta activity. There are runs of 8 to 9 Hz activity mixed with 5 to 6 Hz activity in all regions in the EEG of this term infant with congenital heart disease.
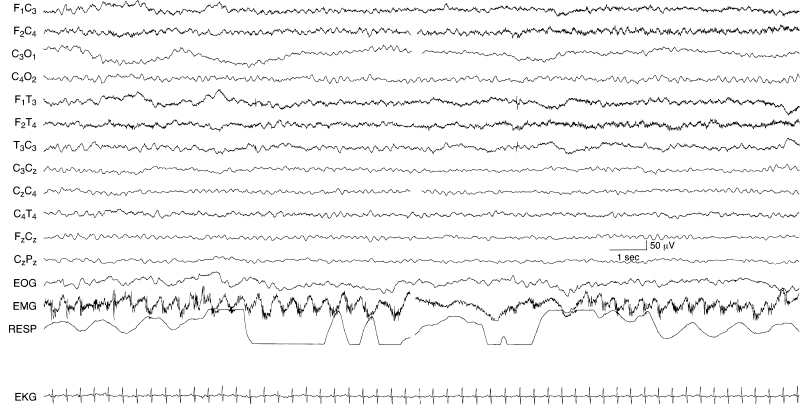
Figure 6.30 Generalized rhythmic theta activity. There is sustained, monomorphic, rhythmic 5 to 6 Hz activity chiefly in the anterior regions in this term infant with the inborn error of metabolism, citrullinemia.
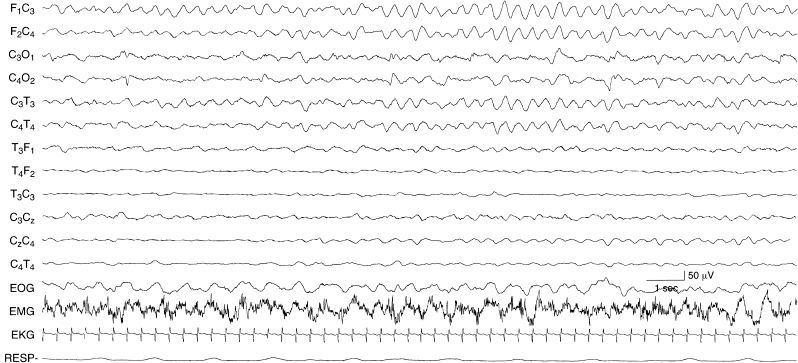
Figure 6.31 Rhythmic, monomorphic, bifrontal delta activity. There are monorhythmic, monomorphic, 2.5 to 3 Hz activity in the frontal regions bilaterally and the background activity is depressed in this term infant with nonaccidental head injury.
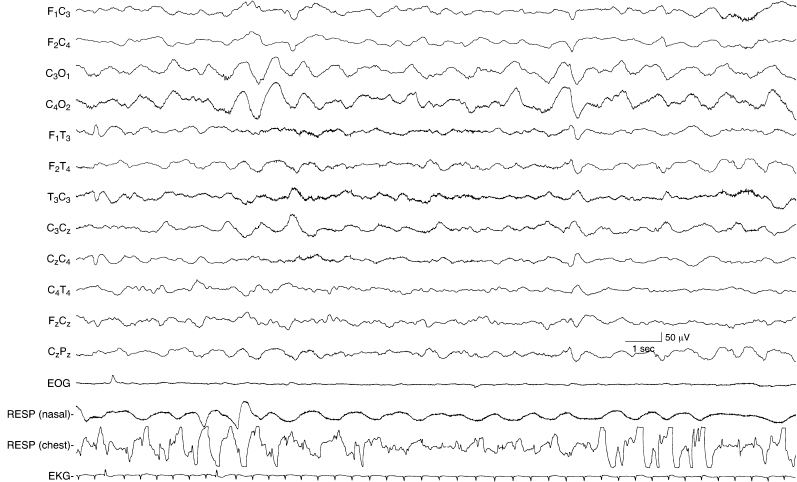
Figure 6.32 Rhythmic bioccipital slow activity. There is high-voltage, 1 to 1.5 Hz activity in the occipital regions of the EEG of this term infant. The background activity is undifferentiated.
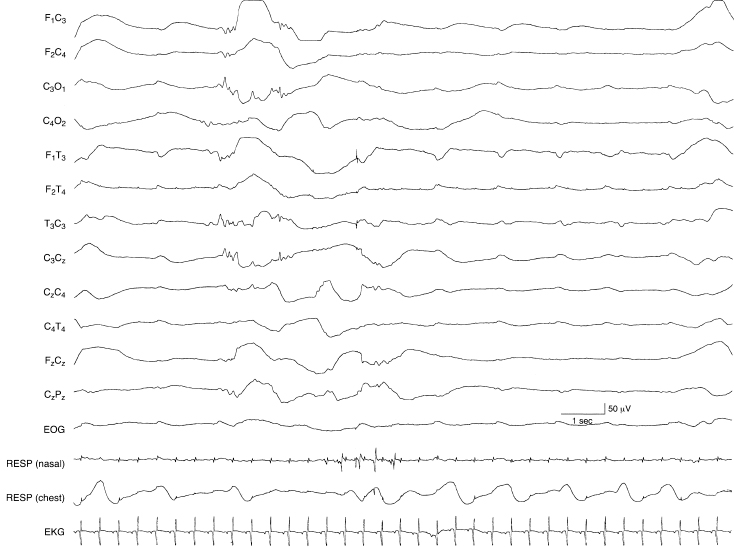
Figure 6.33 Periodic lateralized discharges associated with herpes simplex virus encephalitis (HSVE). Low voltage, slow transients recur periodically in the left temporal region in this term infant with HSVE. The background activity is depressed and undifferentiated and there are randomly occurring low voltage sharp waves in the left central region.

Figure 6.34 Voltage asymmetry. There is a voltage asymmetry with the amplitude of waves lower in the leads from the left hemisphere compared to the right. The background activity on the right shows beta–delta complexes. This 35 to 36 weeks CA infant had a left fronto-parietal intracerebral hemorrhage and an IVH with involvement of the germinal matrix on the left.

Figure 6.35 Voltage asymmetry with mildly abnormal background activity. There is a voltage asymmetry with the amplitude of waves lower on the left compared to homologous regions on the right. Although frontal sharp transients—normal developmental milestones—persist on the right, the background activity is abnormal with little activity of fast frequency and a greater than expected amount of slower waves. This term infant suffered a left frontoparietal intracerebral hemorrhage.
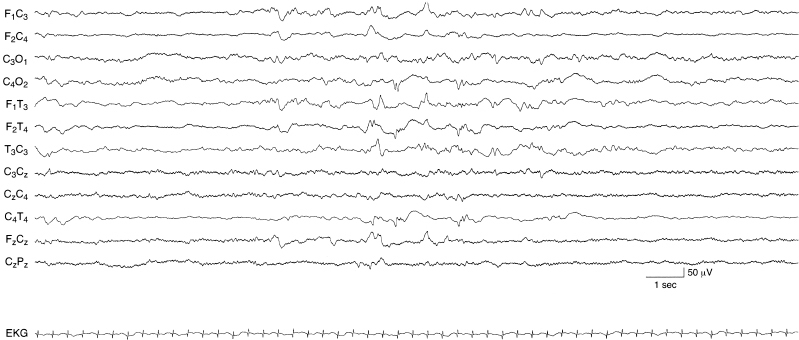
Figure 6.36 Voltage asymmetry associated with abnormal background activity. There is a voltage asymmetry with the amplitude of waves lower in leads from the right central-temporal hemisphere compared to homologous regions on the left. Random moderate-voltage sharp waves are present bilaterally. The background activity is low in voltage. The infant is term with a right parietal infarction and diagnosis of hypoxic-ischemic encephalopathy.
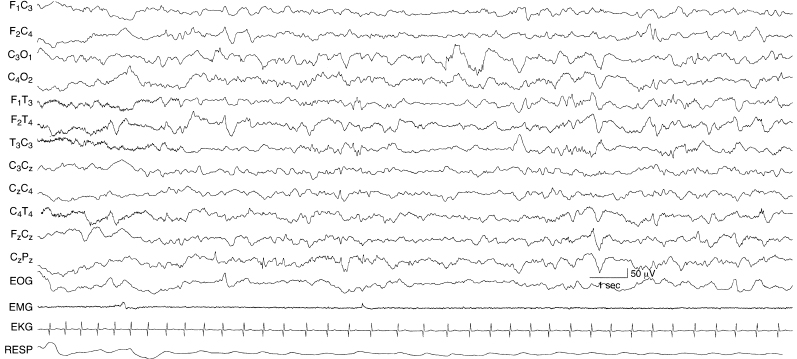
Figure 6.37 Focal slow activity in the left occipital region. There is moderate to moderately high-voltage 1 to 3 Hz activity in the left occipital region in this term infant with a congenital cystic lesion in that region.
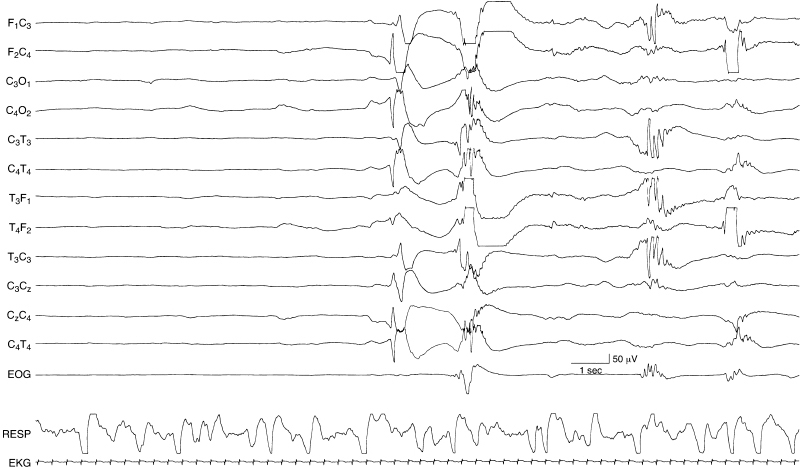
Figure 6.38 Surface positive sharp waves in the premature. After a period of quiescence a high-voltage surface positive sharp wave is present in the right central region. This is followed by abnormal spike and sharp wave activity a few seconds later. Eventually, a temporal theta burst—a normal feature—is present. This EEG is from a 29- to 30-week CA infant with an IVH.
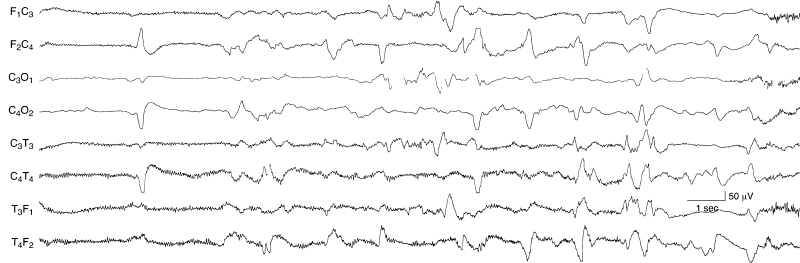
Figure 6.39 Occurrence and location of surface positive sharp waves. Surface positive sharp waves may appear as a unilateral, single transient wave as in the early portion of this sample. They may also recur at a relatively frequent rate and appear asynchronously on the two sides as in the later portion of this sample. This sample is taken from the EEG of a 36-week CA infant with IVH. The background activity is depressed and undifferentiated; there is filtered EMG artifact present in the frontal and temporal leads.
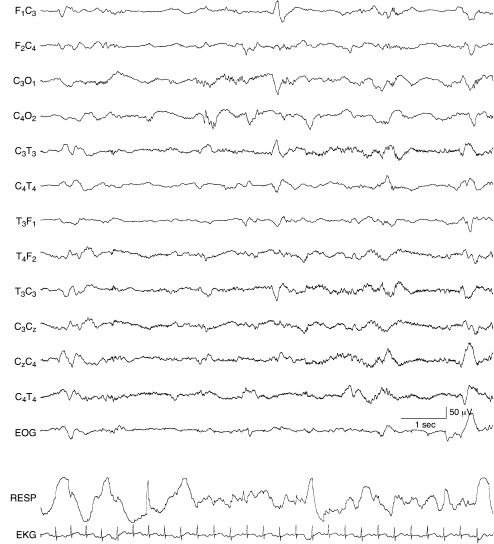
Figure 6.40 Surface positive sharp waves with moderate voltage. A surface positive sharp wave of moderate voltage is present in the left central region. The background EEG activity is within the range of normal variation and consistent with 34 to 35 weeks CA in this infant with periventricular leukomalacia.
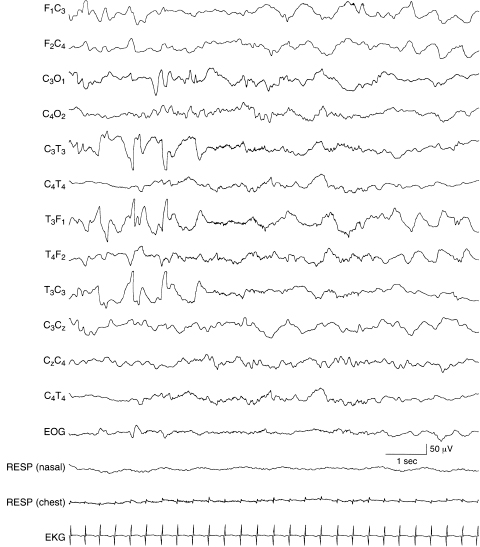
Figure 6.41 Temporal sharp waves with complex morphology. Abnormal temporal sharp waves with complex morphology are present in the left temporal region in the early portion of this sample of a term infant. The background EEG activity is normal and includes some intermittent, rhythmic delta activity in the frontal regions bilaterally. (See Chapter 5 for additional samples of abnormal temporal sharp waves.)

Figure 6.42 Surface positive temporal sharp waves. During the second half of this EEG sample, there is an abnormal surface positive high-voltage sharp wave in the right temporal region. Earlier, there are moderate-voltage temporal sharp waves that are repetitive with both surface positive and surface negative components. This sample is selected from a standard 12-channel EEG recording. (Hrachovy et al., 1990, with permission.)
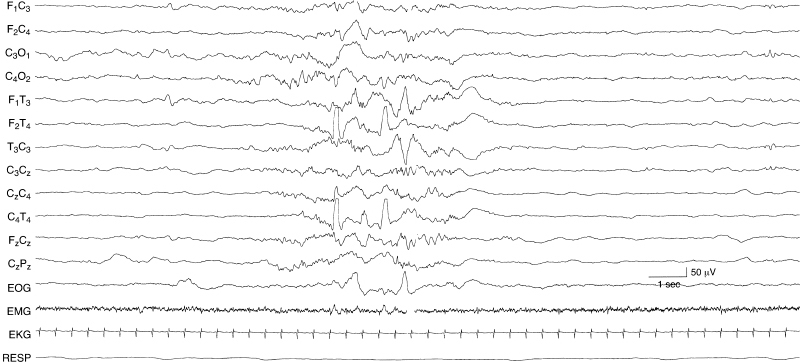
Figure 6.43 Asynchronous, independent surface positive temporal sharp waves. Surface positive sharp waves are present independently in the left and right temporal regions in this 35-week CA infant with a chromosomal abnormality, dysmorphic features, and germinal matrix hemorrhage.
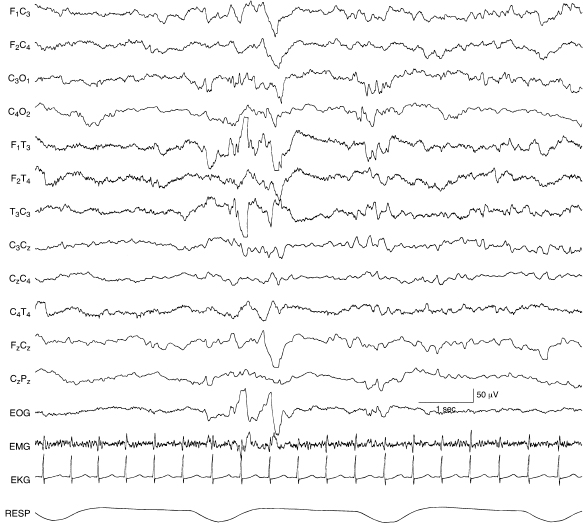
Figure 6.44 Surface positive sharp waves in the temporal region with complex morphology. A sharp wave with both surface positive and surface negative components is present in the left temporal region in this 40-week CA infant with an intracerebral hemorrhage in the left temporal lobe.
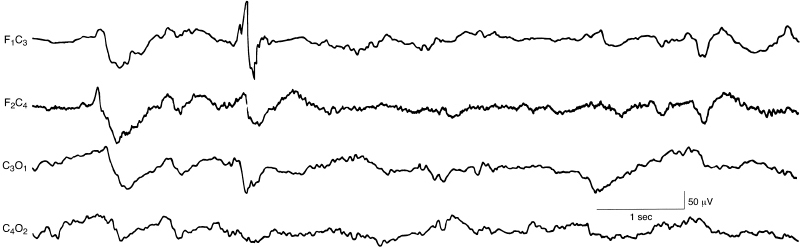
Figure 6.45 Abnormal frontal sharp waves. There is an abnormal sharp wave, with polyphasic morphology, in the left frontal region in this term infant. This is a selected sample from a 12-channel EEG. (Hrachovy et al., 1990, with permission.)
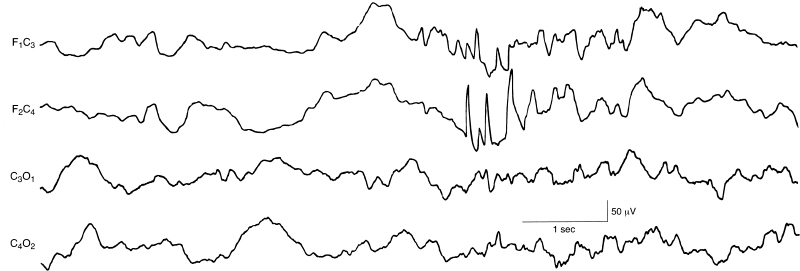
Figure 6.46 Burst of abnormal frontal sharp waves. There is a burst of abnormal sharp waves in the right frontal region in this term infant. This is a selected sample from a 12-channel EEG. (Hrachovy et al., 1990, with permission.)
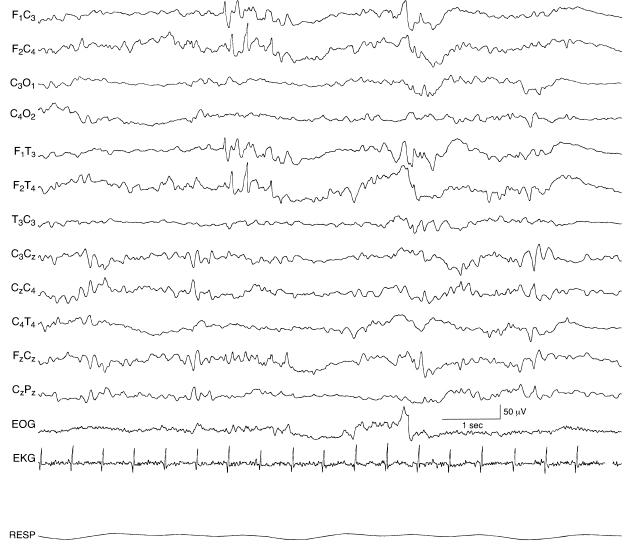
Figure 6.47 Independent bilateral abnormal frontal sharp waves. There are abnormal frontal sharp waves in the first half of this sample. Frontal sharp transients—an expected developmental milestone in this epoch—are present in the second half of the sample, although abnormal because of their asymmetry. In addition, the background EEG activity is undifferentiated in this 40-week CA infant with lactic acidosis and pulmonary insufficiency.
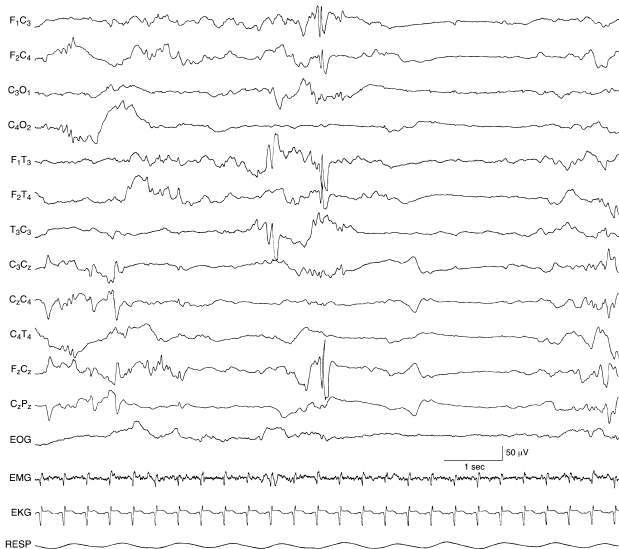
Figure 6.48 Bilateral frontal spikes. There are high-voltage spikes in the frontal regions bilaterally, higher in amplitude on the left, and well-expressed in the midline central region. There is also a temporal sharp wave on the left that occurs earlier. The background EEG activity is discontinuous in this 38-week CA infant with cerebral dysgenesis, congenital ventriculomegaly, and choroid plexus hemorrhage.
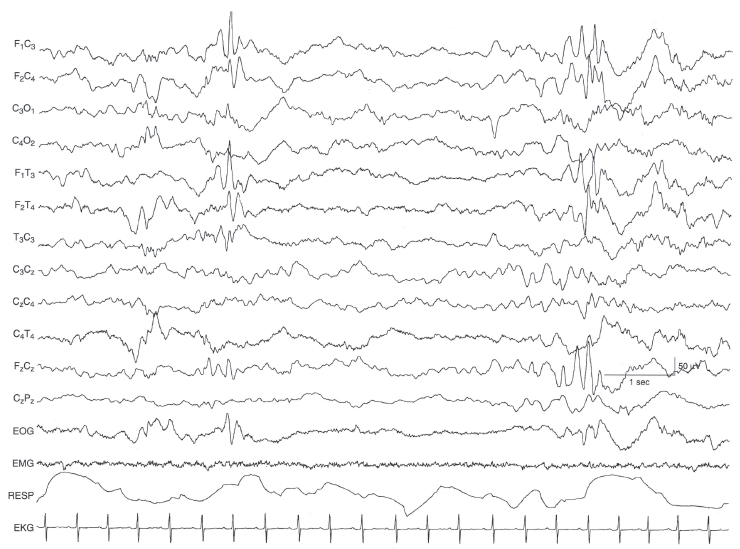
Figure 6.49 Bilateral frontal sharp waves. There are intermittently occurring high-voltage sharp waves in the frontal regions bilaterally. The background EEG activity is within the range of normal variation in this 42-week CA infant suspected of seizures, but without clinical or electrical seizures documented by prolonged EEG.

Figure 6.50 Frontal sharp waves and independent central spikes. There are high-voltage sharp waves in the right frontal region and there are runs of low-voltage spikes in the left central region in this 32-week CA age infant.
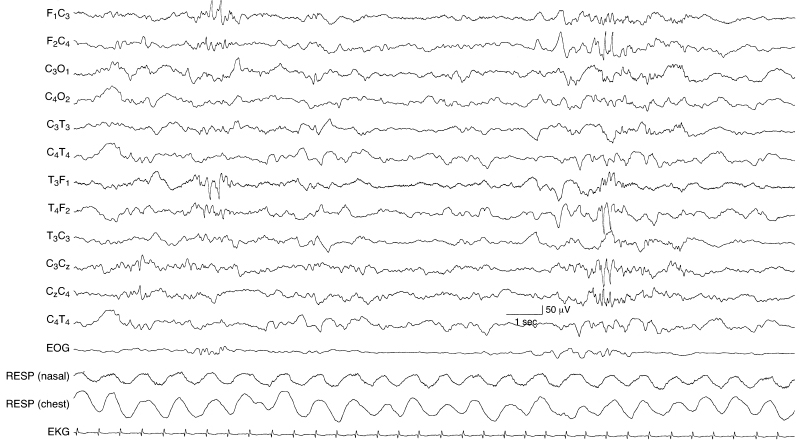
Figure 6.51 Midline and lateralized frontal spikes and sharp waves. There are abnormal sharp waves in the left frontal region and, later in the sample, there are spikes in the right frontal region with expression in the midline central region in this term infant.
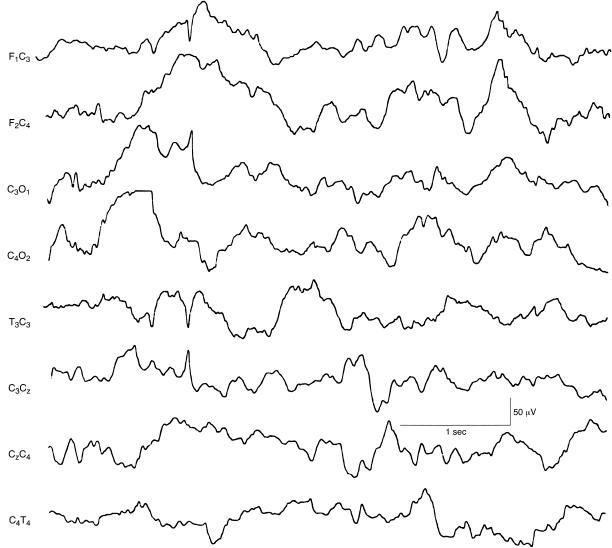
Figure 6.52 Central rapid spikes. There is a single spike discharge in the left central region and normal background EEG activity in this term infant. This sample is taken from a 12-channel EEG recording.
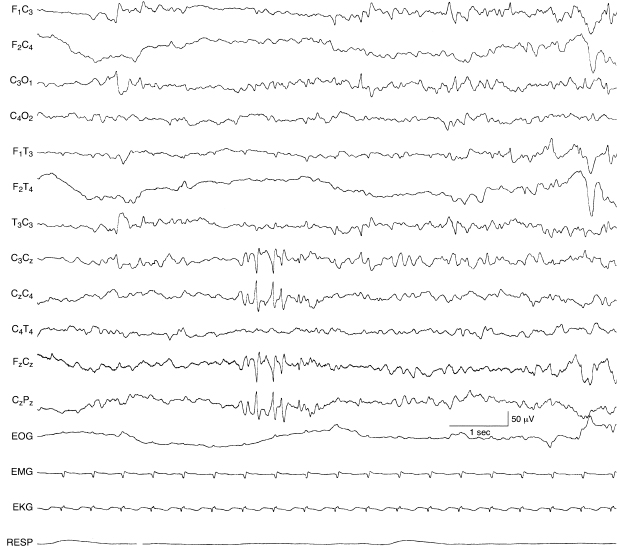
Figure 6.53 Repetitive midline central spikes. There is a run of spikes in the midline central region, expressed in the Cz electrode. The background EEG activity in this 38-week CA infant with cardiac failure and grade I IVH.
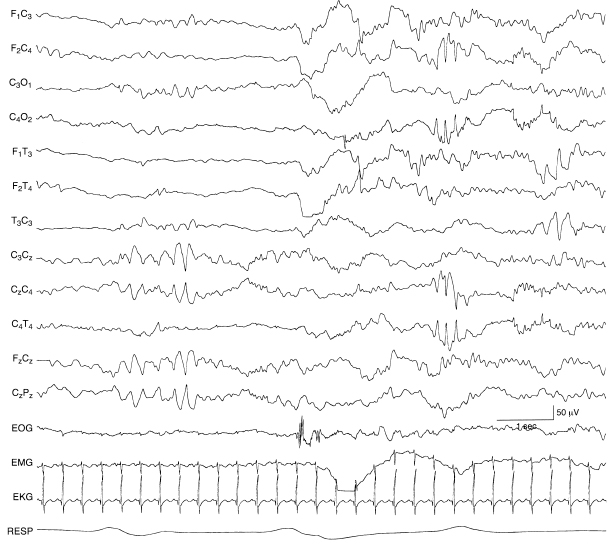
Figure 6.54 Central midline, rhythmic theta, and lateralized central spikes. In the early portion of the recording, there is rhythmic theta activity in the midline central region. Later, there is a run of rhythmic spikes in the right central region. The infant was born at 28-weeks gestational age and at the time of EEG recording was 35 weeks CA. An acute grade III IVH at the time of EEG recording was resolving, although posthemorrhagic hydrocephalus and a porencephalic cyst extended into the left frontal ventricular horn.
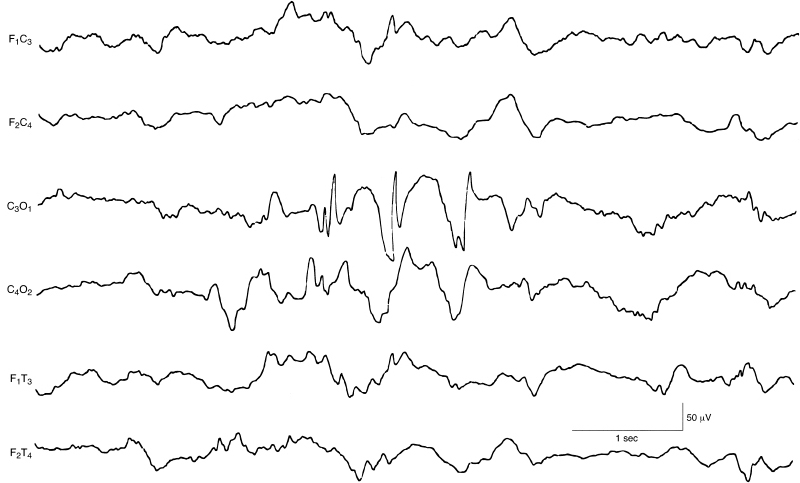
Figure 6.55 Occipital spike and slow waves. There are spike and slow waves in the left occipital region, with some reflection of the slow-wave component on the right. The background EEG activity is within the range of normal variation in this term infant. This sample is selected from a 12-channel EEG.
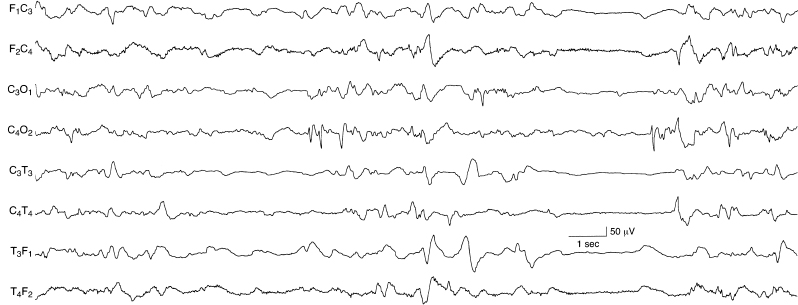
Figure 6.56 Occipital spikes and independent temporal and central sharp waves. There are recurrent spikes in the right occipital region in the mid-portion of this sample. Immediately following this burst, there are frontal sharp transients—normal phenomena. There are also slow temporal sharp waves on the left and independent sharp waves on the right.
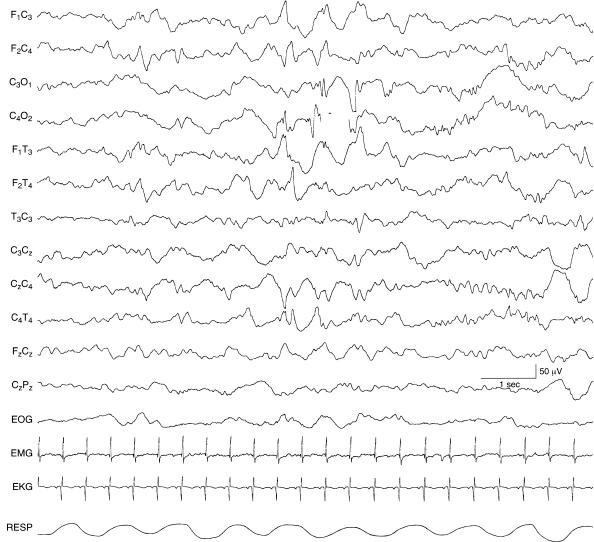
Figure 6.57 Bilateral, independent occipital spikes. There are spike and slow-wave complexes independently in the left and right occipital regions in this 40-week CA infant with Zellweger syndrome.
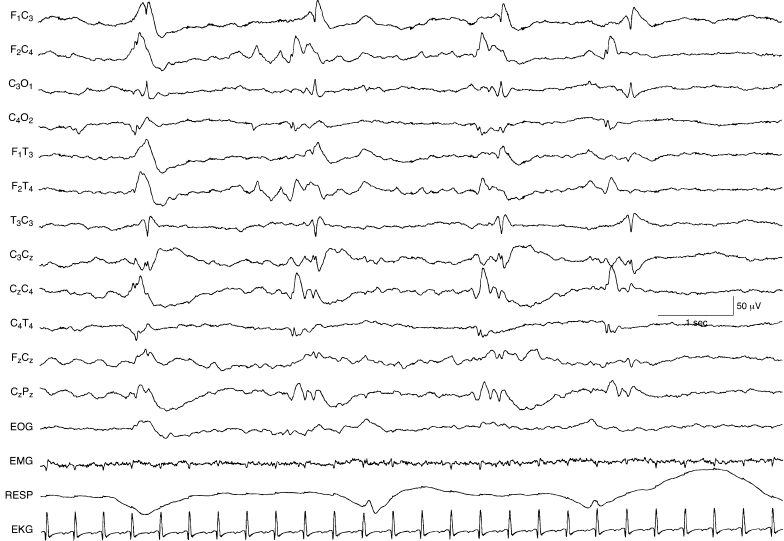
Figure 6.58 Multifocal sharp waves. There are sharp waves, with varying morphology, appearing independently in the left and right central regions in a semiperiodic manner. The background activity is depressed and undifferentiated in this 44-week CA infant with the inborn error of metabolism ornithine carbamylase transferase deficiency.
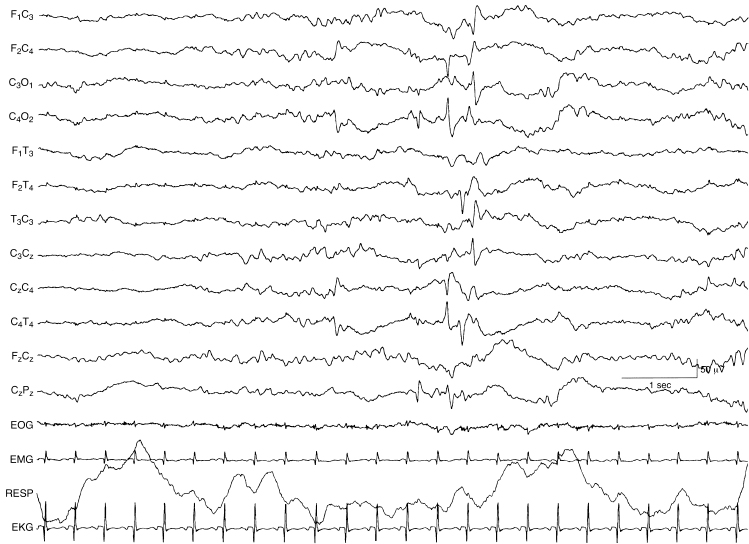
Figure 6.59 Multifocal spikes and sharp waves. There are spikes and sharp waves appearing independently in the left and right central and right temporal regions. The background EEG activity is undifferentiated in this 40-week CA infant with congenital heart disease.
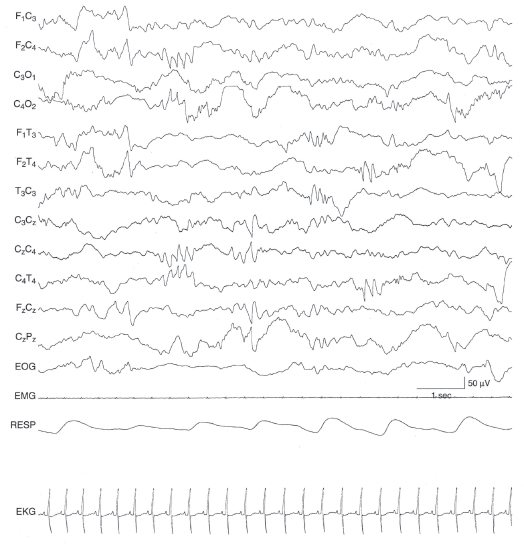
Figure 6.60 Multifocal sharp waves with rhythmic morphology. There are very brief bursts of rhythmic sharp theta activity appearing independently in the left central and left and right temporal regions. The background activity is undifferentiated in this infant with HSVE.
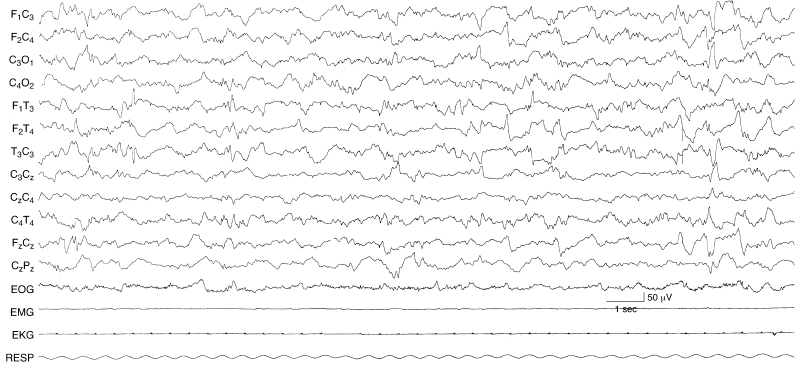
Figure 6.61 Surface positive and surface negative multifocal sharp waves. There are sharp waves present in the left and right central and left and right temporal regions. Some of the waveforms are surface positive (left temporal early in the sample) and others are surface negative in this term infant with renal failure.