Chapter 3
The risk analysis process: planning
In this chapter, we discuss the planning of a risk analysis including the risk evaluation, that is, the risk assessment. The activity can be divided into the following two sub-activities; refer Figure 1.2:
- Problem definition, information gathering and organisation of work (we refer to this as the problem definition activity)
- Selection of analysis method.
3.1 Problem definition
The first step of a risk analysis is to define the objectives of the analysis. Why should we perform the analysis? Often, the objectives are based on a problem definition, as shown by the following example.
Example
A manufacturing company conducts a series of tests everyday on its products and then stores the information in an Information and Communication Technology (ICT) system (called system  ) that automatically adjusts the production process at start-up the next day. If this information is erroneous, a large quantity of products may not meet the quality requirements and hence cannot be released into the market. This will result in significant economic losses. If system
  fails, production must be stopped, again causing economic losses. To improve the reliability of system
  , management has decided to conduct a risk analysis with the following objective:
- – Based on a risk analysis of system
 , addressing ‘failure of system
  ’ and ‘erroneous information’, propose and recommend suitable risk-reducing measures.
When formulating the objectives, any limitations to the scope of the analysis must be taken into consideration, such as lack of available resources, time limits and lack of data and information. This is necessary in order to balance the complexity and size of the problem on the one hand, with the scope, ambitions and accuracy of the analysis on the other.
Clear boundaries for the analysis must be made, so that there is no doubt about what the results apply to. The operating conditions that are to be included in the analysis must also be determined. Examples of different operating conditions are start-up, normal operation, testing, maintenance and emergency situations.
A working group must be established. This group must have knowledge about risk analysis and the system. Other types of specialised competence, for example, in mathematical statistics, will be required in some cases.
A plan for the risk analysis should be drawn up. The plan should cover activities, responsibilities, work progress, time limits and milestones, reports and budget.
The risk analysis may address different types of attributes, such as life, health, environment, economic quantities, information and services. If several attributes are to be analysed, it must be determined whether they are to be analysed separately or they are to be combined in some way.
Experience shows that focus is often placed on the risk analysis in itself, including analysis of data and risk calculations and less on the planning and the use of the analyses. A more balanced analysis process will be achieved if we distribute the resources more evenly. A rule of thumb is that we should use one-third of the resources for planning, one-third for the risk analysis and evaluation and one-third for the risk treatment.
It is essential that we make it clear how the analyses are to be used in the decision-making process. The use, to a large extent, determines the risk analysis approach and methods. The interested parties must also be identified, so that the analysis can be suited to these parties.
Here are some examples on how the analysis can be used in the decision-making process:
- Consider changes in the risk: An analysis of the risk-reducing effect of the different alternatives or measures. The risk analysis may show, for example,that a particular measure reduces the risk by 2%, while another reduces the risk by 10%. This can in itself produce clear recommendations on what is a sensible strategy going forward, if the costs for the measures are about the same.
- Cost-effectiveness: In the cost-effectiveness analysis, indices such as the expected cost per expected number of lives saved are calculated. If a measure costs 2 million euros and the risk analysis shows that the measure will bring about a reduction in the number of expected fatalities by 0.1, then this cost-effectiveness index would be equal to
 million euros. This quantity is often referred to as the implied value of a statistical life or the Implied Cost of Averting a Fatality (ICAF). By comparing this number with reference values, we can assess the effectiveness of the measure. This type of ratio (index) can also be calculated in relation to quantities other than life, for example, a ton of spilled oil. Empirical studies of implemented measures show large differences when it comes to the value of an implied statistical life.
 -
Cost-benefit analysis: Cost-benefit analysis is an approach to measure benefits and costs of a project. The common scale used to measure benefits and costs is currency of the country. After transforming all attributes to monetary values, the total performance is summarised by computing the expected net present value, the
 . The main principle in transformation of goods into monetary values is to find out the maximum amount society is willing to pay to obtain a specific benefit. Use of cost-benefit analysis is considered as a tool for obtaining efficient allocation of the resources, by identifying which potential actions are worth undertaking and in what way. According to this approach, a measure should be implemented if the expected net present value is positive, that is, if
  . Although cost-benefit analysis was originally developed for the evaluation of public policy issues, it is also used in other contexts, in particular, for evaluating projects in firms. The same methods can be applied by using values reflecting the decision-maker's benefits and costs and the decision-maker's willingness to pay. To measure the NPV of a project, the relevant project cash flows (the movement of money into and out of the business) are specified, and the time value of money is taken into account by discounting future cash flows by the appropriate rate of return. The formula used to calculate NPV is as follows:3.1
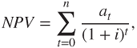
where
 represents the cash flow at time
  and
and  is the discount rate. The terms capital cost and alternative cost are also used for
  . As these terms express,
  represents the investor's cost related to not employing the capital in alternative investments. When considering projects where the cash flows are known in advance, the rate of return associated with other risk-free investments, such as bank deposits, makes the basis for the discount rate to be used in the NPV calculations. When the cash flows are uncertain, which is usually the case, they are normally represented by their expected values
  , and the rate of return is increased on the basis of the Capital Asset Pricing Model (CAPM) in order to outweigh the possibilities of unfavourable outcomes. Not all types of uncertainties are considered relevant when determining the magnitude of the risk-adjusted discount rate, as shown by the portfolio theory; see for example Levy and Sarnat (1990). This theory justifies the ignorance of unsystematic risk and states that the only relevant risk is the systematic risk associated with a project. The systematic risk relates to general market movements, for example, caused by political events, and the unsystematic risk relates to specific project uncertainties, for example, accident risks. The method implies transformation of goods into monetary values, for example using the value of a 'statistical life'. What is the maximum amount the society (or the decision-maker) is willing to pay to reduce the expected number of fatalities by 1? Typical numbers for the value of a statistical life used in cost-benefit analysis are 1–10 million euros. The Ministry of Finance in Norway has arrived at a value at approximately 3.5 million euros. For official cost-benefit analyses, the Ministry of Finance recommends the use of a value of this order of magnitude. An oil company uses the following guideline values for the cost to avert a statistical life (euros):
0 Highly effective, always implement 10,000 Effective, always implement 0.1 million Effective; implement unless individual risk is negligible 1 million Consider; effective if individual risk levels are high 10 million Consider at high individual risk levels or when there are other benefits 100 million Not socially effective—look at other options - Risk acceptance criteria (risk tolerability limits): If the calculated risk is lower than a pre-determined value, then the risk is acceptable (tolerable). Otherwise, the risk is unacceptable (intolerable), and risk-reducing measures are required. One example of such a criterion is the following: the frequency of events during 1 year that leads to impairment of a safety function must not exceed
 . If the risk analysis arrives at a calculated frequency higher than this limit, then the risk is unacceptable, and if the frequency is lower, then the risk is acceptable. We refer to Chapter 5.
 - ALARP process: The risk should be reduced to a level that is As Low As Reasonably Practicable (ALARP). This principle means that the benefits of a measure should be assessed in relation to the disadvantages or costs of the measure. The ALARP principle is based on ‘reversed burden of proof’, which means that an identified measure should be implemented unless it cannot be documented that there is an unreasonable disparity (‘gross disproportion’) between costs/disadvantages and benefits.
One way of assessing ‘gross disproportion’ is outlined in what follows (Aven and Vinnem 2005, 2007):
- 1. Perform a crude analysis of the benefits and burdens of the various alternatives, addressing attributes related to feasibility, conformance with good practice, economy, strategy considerations, risk, robustness/resilience, social responsibility and so on. The analysis would typically be qualitative and its conclusions summarised in a matrix with performance shown by a simple categorisation system such as very positive, positive, neutral, negative, very negative. From this crude analysis, a decision can be made to eliminate some alternatives and include new ones for further detailing and analysis. Frequently, such crude analyses give the necessary platform for choosing one appropriate alternative. When considering a set of possible risk-reducing measures, a qualitative analysis in many cases provides a sufficient basis for identifying which measures to implement, as these measures are in accordance with good engineering or good operational practice. Also many measures can be quickly eliminated as the qualitative analysis reveals that the burdens are much more dominant than the benefits. If the costs are small, the ALARP principle would imply that an identified measure improving the safety should be implemented.
- 2. From this crude analysis, the need for further analyses is determined, to give a better basis for concluding which alternative(s) to choose. This may include various types of risk analyses.
- 3. Other types of analyses may be conducted to assess, for example, costs and indices such as expected cost per expected number of saved lives could be computed to provide information about the effectiveness of a risk-reducing measure or compare various alternatives. The expected net present value may also be computed when found appropriate. Sensitivity analyses should be performed to see the effects of varying values of statistical lives and other key parameters. Often the conclusions are rather straightforward when calculating indices such as the expected cost per expected number of saved lives over the field life and the expected cost per expected averted ton of oil spill over the field life. If a conclusion about gross disproportion is not clear, then these measures and alternatives are clear candidates for implementation. Clearly, if a risk-reducing measure has a positive expected net present value (for suitable statistical life values), it should be implemented. Crude calculations of expected net present values, ignoring difficult judgements about valuation of possible loss of lives and damage to the environment, will often be sufficient to conclude whether this criterion could justify the implementation of a measure.
- 4. An analysis of uncertainties in the underlying phenomena and processes is carried out. The key issue is to assess the degree for which the predicted values in the analysis (e.g. the expected costs) will deviate from the actual values (e.g. the costs). The strength of knowledge assessment as outlined in Section 2.4 could provide useful inputs to this analysis. The alternatives are assessed with respect to their robustness/resilience, in particular, their ability to cope with surprising events occurring. See Section 5.1.1.
- 5. An analysis of manageability takes place. To what extent is it possible to control and reduce the uncertainties and thereby arrive at the desired outcome? Some risks are more manageable than others in the sense that there is a greater potential to reduce risk. An alternative can have a relatively high calculated risk under certain conditions, but the manageability could be good and could result in a far better outcome than expected.
- 6. An analysis of other factors, such as risk perception and reputation, should be carried out whenever relevant, although it may be difficult to describe how these factors would affect the standard indices used in economy and risk analysis to measure performance.
- 7. A total evaluation of the results of the analyses should be performed, to summarise the pros and cons of the various alternatives, where considerations of the constraints and limitations of the analyses are also taken into account. A risk-reducing measure may not be justified by reference to the cost-benefit type of analysis, but if it contributes strongly to increased robustness/resilience, it may still be recommended for implementation.
Note that such assessments are not necessarily limited to the ALARP processes. The above process can also be used in other contexts where decisions are to be made under uncertainty.
Different checklists can be established for the identification of such uncertainty factors (see Chapters 4 and 5).
3.2 Selection of analysis method
The selection of analysis method can be made based on the following considerations:
- To what extent do we want or need a simplified, standard or model-based method? See Table 1.1. This depends on the aim of the analysis.
- To what extent are branch-specific methods available?
- Which parts of the risk picture in Figure 1.1 are to be emphasised? Various methods have different focus.
An experienced risk analyst will often base the selection of method on previous analyses. He/she has extensive knowledge of the various risk analysis methods and knows how they should be used in practice. In many instances, however, it is not obvious which method should be used. New analysts arrive on the scene, and they need guidance regarding the method selection.
In the following sections, two example procedures are presented (checklist-based procedure and risk-based procedure) that may be used to select the type of risk analysis method: simplified, standard or model-based. When the type of risk analysis method has been selected, one can choose an appropriate method within this category. The choice depends on the phase, ease of access to information, the system's significance, the system's complexity and other factors.
Often, several risk analyses are implemented in sequence. For example, a simplified analysis is used to identify critical systems. After this, a standard or possibly a model-based analysis may be carried out to analyse these systems in more detail and to form a basis for recommending risk-reducing measures.
The selection of analysis method is also about choosing between a forward and a backward approach:
- Forward approach: The risk analysis begins with the identification of initiating events. Thereafter, the consequences of the various events are analysed. The aim of the analysis is to identify all relevant events and associated scenarios. For example, if we analyse a process module on an offshore installation or a land-based facility, the aim is to identify all gas leakages that can occur. After this, a consequence analysis is carried out for each initiating event, addressing possible explosion and fire scenarios leading to possible loss of safety functions and fatalities. The same will be done for all other types of events that are possible in this area, for example, dropped objects. The end product will be a risk analysis that describes both insignificant and severe events, with their associated potential consequences.
- Backward approach: In this case, the risk analysis begins with the identification of the resulting events or situations that are identified as important in the analysis, for example, the impairment of escape routes, personnel injuries or loss of lives. In the case of a process module, we will be concerned with the identification of potential fire situations that can block an escape route. What kind of a fire can result in impairment of the escape route? Where must it occur and how large must it be? What leakage sources can result in such a large fire? The end product will be a limited analysis that looks into some selected events capable of affecting the performance measures highlighted in the analysis.
Generally, one can say that the backward approach is less resource intensive in terms of time, but at the same time, it requires considerable experience and competence, in order for the analysis to provide a good basis for decision-making. There is a danger that one could make a wrong choice or overlook events that should have been included.
The forward approach implies more mechanised and time-consuming calculation processes. The risk description may in this case be more complete, but there is a danger that the risk analysis becomes so extensive and complicated that it is difficult to extract what information is important and what is less important. We may spend too much time on aspects that do not contribute to risk.
3.2.1 Checklist-based approach
In this section, we present a checklist-based approach for selecting a risk analysis method. A road tunnel example is used to illustrate the approach. The description is, to a large extent, based on the Norwegian Public Roads Administration (2007). See Table 3.1.
Table 3.1 Example of a checklist for selection of analysis method—road tunnels
| Tunnel type | Gradient | Length (km) | Simplified risk analysis | Standard risk analysis | Model-based risk analysis |
| 0.5–1.0 | x | ||||
| 0.5% | 1.0–5.0 | x | x | ||
| One or two-run tunnels |  5.0 5.0 |
x | x | ||
| 0.5–1.0 | x | x | |||
 5% 5% |
 1.0 1.0 |
x | x | ||
| Undersea | 0–10% | Regardless | x | x | |
| tunnels | of length | ||||
| On- and off- | Regardless | Regardless | x | x | |
| ramps in | of gradient | of length | |||
| tunnel |
We see from the table that there are three conditions that form the basis for the selection of method: tunnel type, gradient and length. Other conditions can also affect the selection of method, for example:
- traffic volume;
- the project phase (planning/design, under construction, existing tunnels);
- special constructions (intersection layouts, roundabouts, on- and off-ramps);
- danger of water ingress;
- special technical arrangements;
- local climatic conditions;
- high proportion of heavy motor vehicles;
- transportation of dangerous goods;
- high speed levels observed in relation to posted speed limits;
- special preparedness-related conditions (long response time, poor access to water);
- special conditions related to the traffic picture (e.g. high traffic periods of the week or day).
Depending on such conditions, the category method may be adjusted.
From the checklist in Table 3.1, we see that several categories of methods are applicable in certain situations. For example, both simplified and model-based risk analyses will be applicable for undersea tunnels. Initially, a simplified analysis can be undertaken to perform a crude risk analysis and to decide what the focus should be in a subsequent model-based risk analysis method.
3.2.2 Risk-based approach
This section gives a brief description of the principles of a risk-based approach for the selection of a risk analysis method. The approach is based on Wiencke et al. (2006). The method was initially developed for the ICT industry, but can also be applied to other analysis subjects.
This approach is based on an assessment of the following three aspects:
- 1. Expected consequences, computed by multiplying the probability that a specific initiating event occurs and the expected consequence if this event occurs. The consequences are often related to the degree of non-conformance with the objectives of the organisation.
- 2. Uncertainties related to factors that can create deviations/surprises relative to the expected values. Important factors that can lead to such deviations/surprises could be both variation and lack of knowledge, for example, due to the complexity of the technology or the organisation, availability of information, time frame for the analysis.
- 3. Frame conditions, that is, limitations with respect to budget, time period and access to information.
This approach builds, in principle, on an overall risk assessment in that items 1 and 2 express risk. The assessment is crude, as the point here is not to conduct a risk assessment, but to provide a basis for selecting an adequate risk analysis method. The assessment is expected to take a few hours. It can be carried out by the system owner (e.g. the project leader), with support from risk analysts and persons with comprehensive knowledge of the system or activity being analysed.
Assessing each of these three main points is based on simple questionnaires. See Appendix C for further details.
Reflection
Is it a reasonable demand that the choice of analysis method be justified?
Yes, in that the choice of analysis method can influence the form and content of the risk picture that is to be presented. On the other hand, the resource consumption linked to selection and documentation must not be too high. The aim of the approach in Appendix C is to balance these concerns.
Reflection
Many risk analyses use statistics as a starting point for the analysis. Which analysis type does such an analysis fall under: simplified, standard or model-based risk analysis?
All three categories can be relevant. The method depends on how the statistics are applied. Let us look at the yearly number of road traffic fatalities in a specific country.
This is a description of what has happened, so the numbers are not expressing risk as such (refer ‘Reflection’ in Chapter 1). However, when we address the future, for example, by looking at the number of fatalities next year, the risk concept is introduced—unknown events and consequences, and associated uncertainties.
A simplified risk analysis can conclude that one expects a reduction in fatalities in the coming years. This conclusion can be based on a discussion within the analysis working group, where the statistics are an important part of the background knowledge.
A standard risk analysis can, for example, express a 90% prediction interval [ ] for the number of fatalities
  next year, which means that
  . An expectation of the number of fatalities for the next year can be based on the previous year's statistics.
A model-based risk analysis can express the same form of results as a standard risk analysis, but makes use of more detailed models and methods. For example, the number of accidents can be described using a Poisson distribution (refer Appendix A.1). This allows the analysts to systematically study how a risk is influenced by various factors. A qualitative judgement of the strength of knowledge supporting the quantification should always be given.