At international conferences academics from different countries can be heard asking one important question: ‘How big is your beta?’ The measure economists use to gauge the mobility of different nations is called the intergenerational elasticity (or IGE). In many studies it is given the symbol beta, β. The number reveals how sticky different nations are: how likely children are as adults to be in the same earnings or income bracket as their parents.1
For those unacquainted with the technical details of betas or IGEs, the question is put more simply: how low is social mobility in a country such as Britain? It is usually accompanied by a much harder question: how much more mobile could the country be? It is why a twenty-page report by London School of Economics researchers published in 2005 by the Sutton Trust made such an impact. It found that Britain (along with the United States), came bottom of the international league table of income mobility.2 Who you were born to mattered more in Britain (and the US) in predicting what you were likely to earn as an adult than in Canada, Germany, Sweden, Norway, Denmark and Finland.
Britons and Americans from poorer families found it harder than those in other nations to climb the income ladder and earn more money than their parents. ‘America and Britain have the highest intergenerational persistence,’ concluded the paper. Compared to most countries, the British beta was big.
The LSE economists concluded not only that income mobility was low in Britain by international standards, but that it had declined across recent generations. Income mobility was lower for the British generation born in 1970 compared with that born in 1958. Children who grew up in poorer homes in the 1970s were more likely than the previous generation to end up relatively poor as adults. For all the talk of breaking down ingrained social-class barriers, Britain, at least according to the barometer of earnings, had become less mobile for people entering the labour market in the 1990s compared with those getting jobs in the 1980s.
The downward trend is shown by comparing the long-range mobility measure for children growing up in respective generations born in 1958 and 1970. Few people would be expected to make a dramatic transition during their lifetime. Yet 17 per cent of those born in 1958 in the bottom quarter of family incomes did so, ending up among the top quarter of earners by their late thirties. These odds, of living the equivalent of the American dream, had measurably declined for those born just twelve years later in 1970. Only 11 per cent born in the poorest households then had moved up into the highest earners as adults by their late thirties (by which time most people had reached their maximum earnings).
Prime ministers come and go, but all seem to return to the damning LSE findings as they outline their hopes for a more mobile society. ‘This slender analysis has, arguably, had more influence on public debate than any academic paper of the past twenty years,’ the journalist David Goodhart has claimed.3 Government reviews have been announced, papers published, commissions created.4 Improving social mobility became the principal goal of the Government’s social policy.5 Yet we appear to be no closer to unlocking Britain’s rigid society.6
International Comparisons
Many subsequent studies have confirmed Britain’s low intergenerational mobility.7 An international review by the OECD concluded that Britain was at the bottom of the income mobility league table, ‘with around 50 per cent of a person’s income explained by his or her parents’ income’. In Denmark, Norway, Finland and Canada, parental income explained less than 20 per cent of a child’s eventual earnings.8 On this measure, British people experienced only half the mobility enjoyed by their Scandinavian or Canadian counterparts.
An intergenerational income elasticity of 1 would mean there was no mobility at all: all poor children would become poor adults and all rich children would become rich adults. Everyone would stay in the same position in the nation’s income distribution as their parents. An elasticity of zero would mean complete mobility with no relationship between family background and the adult outcomes of children. A child born into poverty would have exactly the same chance of becoming rich in later life as a child born to rich parents.
Britain, according to the latest estimates shown in Figure 1.1, has by international standards a high intergenerational elasticity of 0.35.10 By contrast, the earnings elasticity in Denmark is 0.14 – around a third of that in Britain.
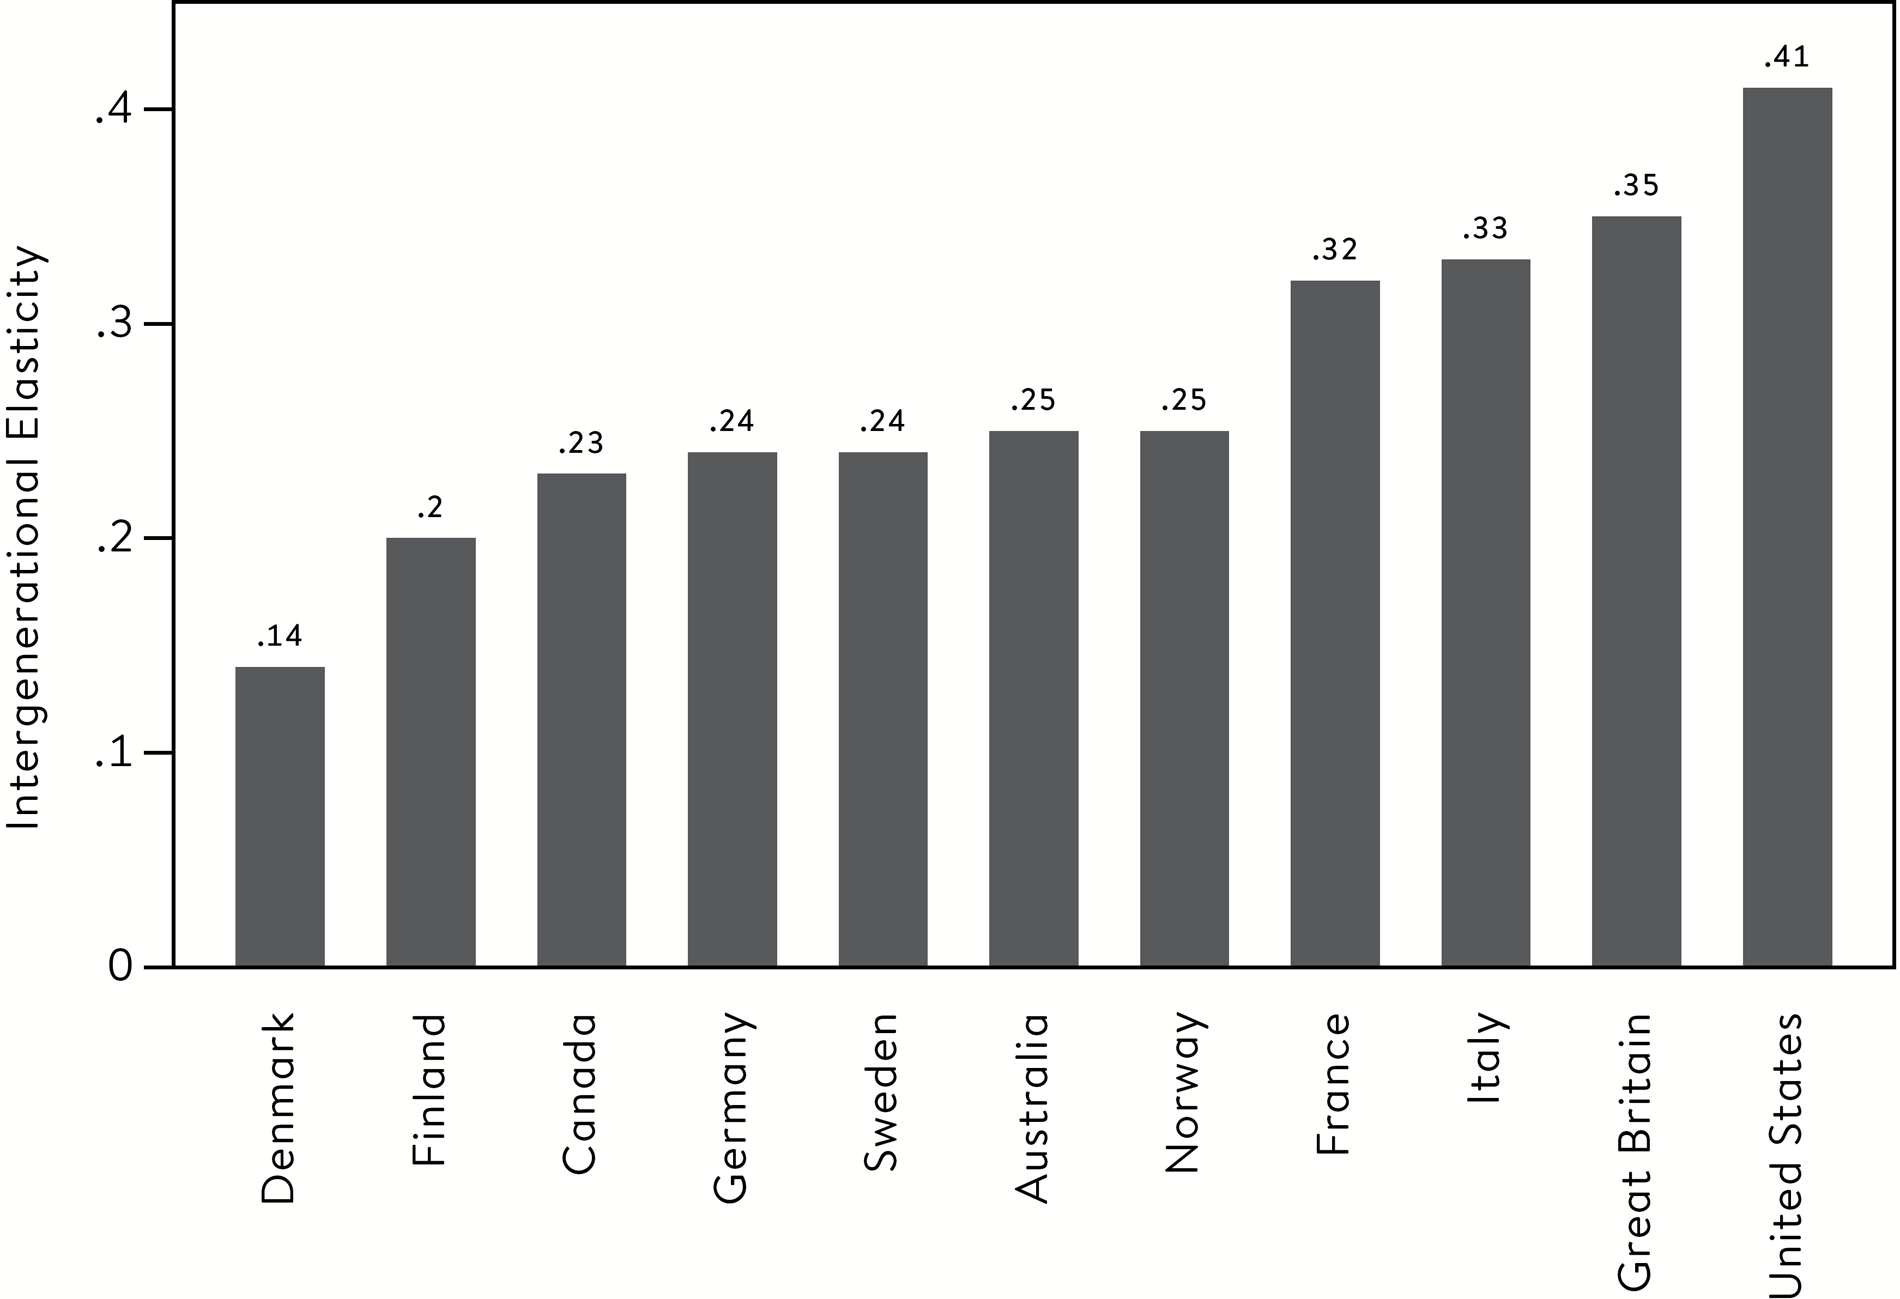
Intergenerational differences in intergenerational elasticity.9
Researchers have also been able to consider intergenerational correlations in terms of ranks.11 By ordering parents’ and children’s income levels from the lowest to the highest, it is possible to obtain rank measures for both generations, and researchers have argued that rank–rank correlations offer robust measures of the extent of intergenerational mobility. The correlations corroborate the elasticity patterns. Britain remains low in the advanced economies’ league table of social mobility.
Anglophone Comparisons
Educationalists have to tread carefully when interpreting international comparisons. Countless excursions have been organized to stand-out education performers such as Finland or Singapore, only to discover that the societies are different in many dimensions to Britain; it is hard to find any meaningful lessons that apply back home. Context matters.
But what is striking about the international comparisons of income mobility is that similar countries have different betas: Australia and Canada have lower betas and more income mobility than Britain and the United States. This is despite a shared history, common language and cultures. The differences suggest Britain is less mobile than it could be. For policy makers they prompt tantalizing questions: could Britain learn any lessons from Canada or Australia, and improve its mobility levels?
One suggestion is that smaller gaps in educational achievement between the rich and poor in Australia and Canada lies behind their higher mobility levels.12 Children from poorer families in Australia and Canada have a greater chance of doing well at school, getting into university and earning more in later in life than children in Britain and the US. And this is the case even though Britain and the US spend a greater proportion of their GDP on schooling.
For the most part, Australians and Canadians do not suffer the same education extremes observed in Britain. Fewer young people are missing out on the most basic skills needed to get on in life; and at the top of the social-class pyramid there is nothing remotely resembling Britain’s powerful private-school elite.
The environments in which children grow up are also different. Canada and Australia have smaller gaps between the rich and poor than those in Britain and the US. Australian and Canadian graduates do not command the comparatively high salaries enjoyed by their British or American counterparts.
Children in Britain and the US meanwhile are at least twice as likely to be born to teenage mothers as children in Australia and Canada.13 Being born to a single teenage mother is one of the strongest predictors of performing poorly in school in any country – and of earning less in the labour market as an adult. Canada and Australia are far less densely populated than Britain and are not dominated by one major international metropolis (London). Some believe it is more simple: Canadians and Australians do not suffer the same class and cultural divide that has forever obsessed and defined Brits.
How Much Higher (or Lower)?
What higher levels of social or income mobility could Britain realistically aim towards? There is no straightforward answer to this question: no one knows what the optimal level for any country is, and from the current state of research we do not have a good economic means of thinking about what that optimal level might be. But we do know otherwise similar countries such as Australia and Canada have significantly higher mobility.
Few people would advocate a world of total social mobility where a person’s chances of success in later life were uncorrelated with the parental home they grew up in. And extremely unpalatable policies would be required to create such a society: separating children from their parents at birth and randomly allocating work opportunities, for example. But the international comparisons of income mobility indicate what improvement might just be possible in Britain. On the flipside they show just how much worse it could get.
Stanford University economist Raj Chetty and his fellow US researchers used the long-range or ‘rags to riches’ measure of income mobility to ask how realistic the American dream is for a number of different countries. They calculated the proportion of children born to parents in the bottom poorest fifth of households who leap into the top richest fifth of homes as adults. The results are presented in Figure 1.2.14
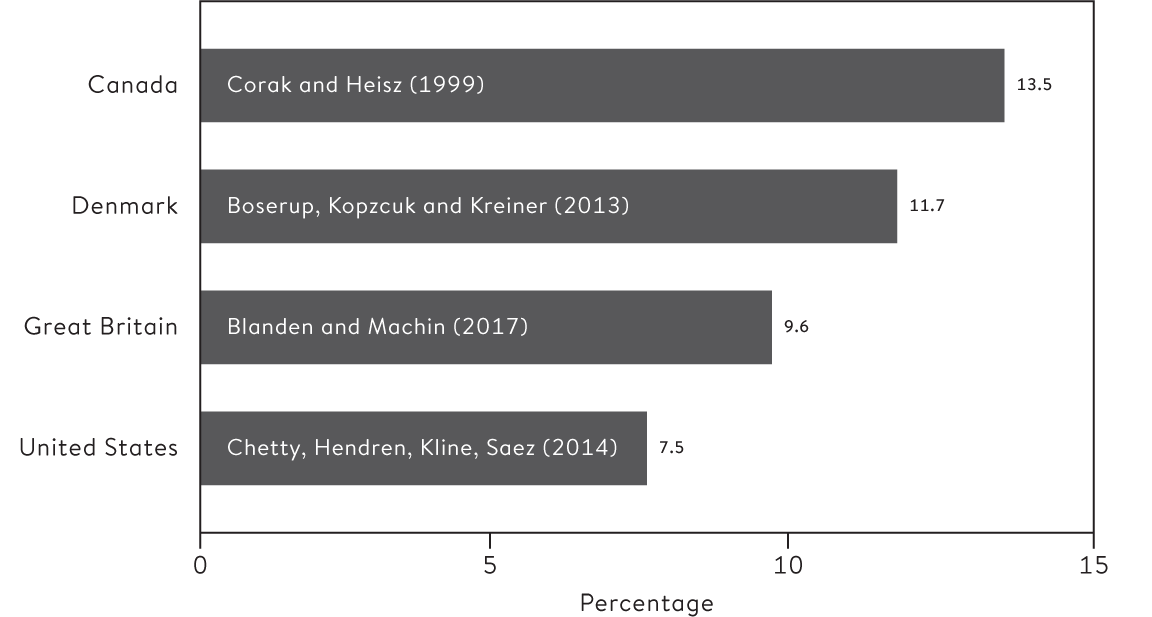
Probability of moving from bottom to top quintile.15
A society of complete mobility, in which background and outcomes were unrelated, would see 20 per cent of the population making this bottom to top journey. A world of absolute rigidity would be signalled by a rags-to-riches metric of zero, where none of those from the poorest backgrounds made it into the richest homes in adult life.
In Britain 9.6 per cent of people who began life in the bottom fifth of the income distribution made it into the top fifth of incomes by their late 30s. In Canada, a higher percentage – 13.5 per cent – achieve the American dream. Given the cultural, historical and economic similarities of the two countries this higher level of upward mobility would seem to be a realistic, if ambitious, aim for Britain. It would require, at least according to this measure, a significant improvement – around 40 per cent up – on current mobility levels in our country.
The Canadian figure is similar to the highest levels of long-range income mobility observed for ‘high opportunity’ cities in the United States, including San Francisco for example at 12.2 per cent.16 We will return to these local variations in income mobility in Chapter 3 as they offer further clues to what drivers may lead to more healthy levels of social mobility.
On the other hand in the United States overall (where the American dream was born of course), only 7.5 per cent of people make it from the bottom to the top of society. Given the common characteristics of the US and Britain, the danger for Britain is it slips down further to this lower level of income mobility – equivalent to a 20 per cent drop on current levels.
America’s ‘low opportunity’ areas have long-range mobility as low as 5.5 per cent. That is equivalent to a 40 per cent drop on current levels in Britain. Unless we change matters, the fear is Britain could drop down to these levels of rigidity and stay rooted to the bottom of the international league table. Even more British lives would be wasted – our economy would weaken and society would become more divided. Success in life would be determined even more by who you are born to, rather than individual talent or hard work.
The Great Gatsby Curve
The Great Gatsby by F. Scott Fitzgerald is one of the great works of American literature, capturing a lost age of excess during the United States of the 1920s, prior to the Wall Street crash. In modern-day America the magnitude of the income gaps between rich and poor has returned to the levels experienced nearly a century ago. For the Roaring Twenties read the great divides of the early twenty-first century.
These parallels were thrust into the social mobility debate when Alan Krueger, a Princeton academic serving as President Barack Obama’s chief economic adviser, unveiled the ‘the Great Gatsby Curve’. It was unusual for a White House official to give a speech ahead of the President’s State of the Union Address. What Krueger had to say was controversial. Here was a senior US Government adviser conceding publicly the American dream is little more than a myth for many citizens.17 The implication of the Great Gatsby Curve is that today’s stark inequality harms future social mobility.
Krueger’s graph (redrawn in Figure 1.3 with more recent data) was based on data originally gathered by the Canadian economist Miles Corak, comparing income inequality and income mobility levels for a number of rich countries. On the horizontal axis is the official Gini coefficient, which measures the level of income inequality: the higher the coefficient, the bigger the income gap between the richest and poorest in society. Krueger used inequality measures registered when children were growing up in order to capture their impact on their lives. On the vertical axis is the ‘intergenerational earnings elasticity’ – the IGE or beta for each country. As we have seen, this measure signals how sticky or immobile a society is, comparing one generation with the previous one. The higher this number, the lower the earnings mobility across generations.
As you can see, the Curve (actually a straight line) shows more unequal societies are less mobile. Put simply, when the rungs of the income ladder are wide, the chances of climbing the ladder are lower. Ominously, the Curve suggests less mobility for future generations in Britain and the United States, nations that are particularly unequal and immobile by international standards.
The Curve demonstrates just how powerful a memorable title can be. F. Scott Fitzgerald’s working title was ‘Among the Ash Heaps and Millionaires’. Krueger says, ‘I venture the hypothesis that had he stuck with that title no one would recall Jay Gatsby today, and the Great Gatsby curve would have been christened with a different name.’18 Krueger’s research assistants came up with the name after being offered a bottle of New Jersey wine to find a catchy title. Another link was the fact that F. Scott Fitzgerald had studied at Princeton.
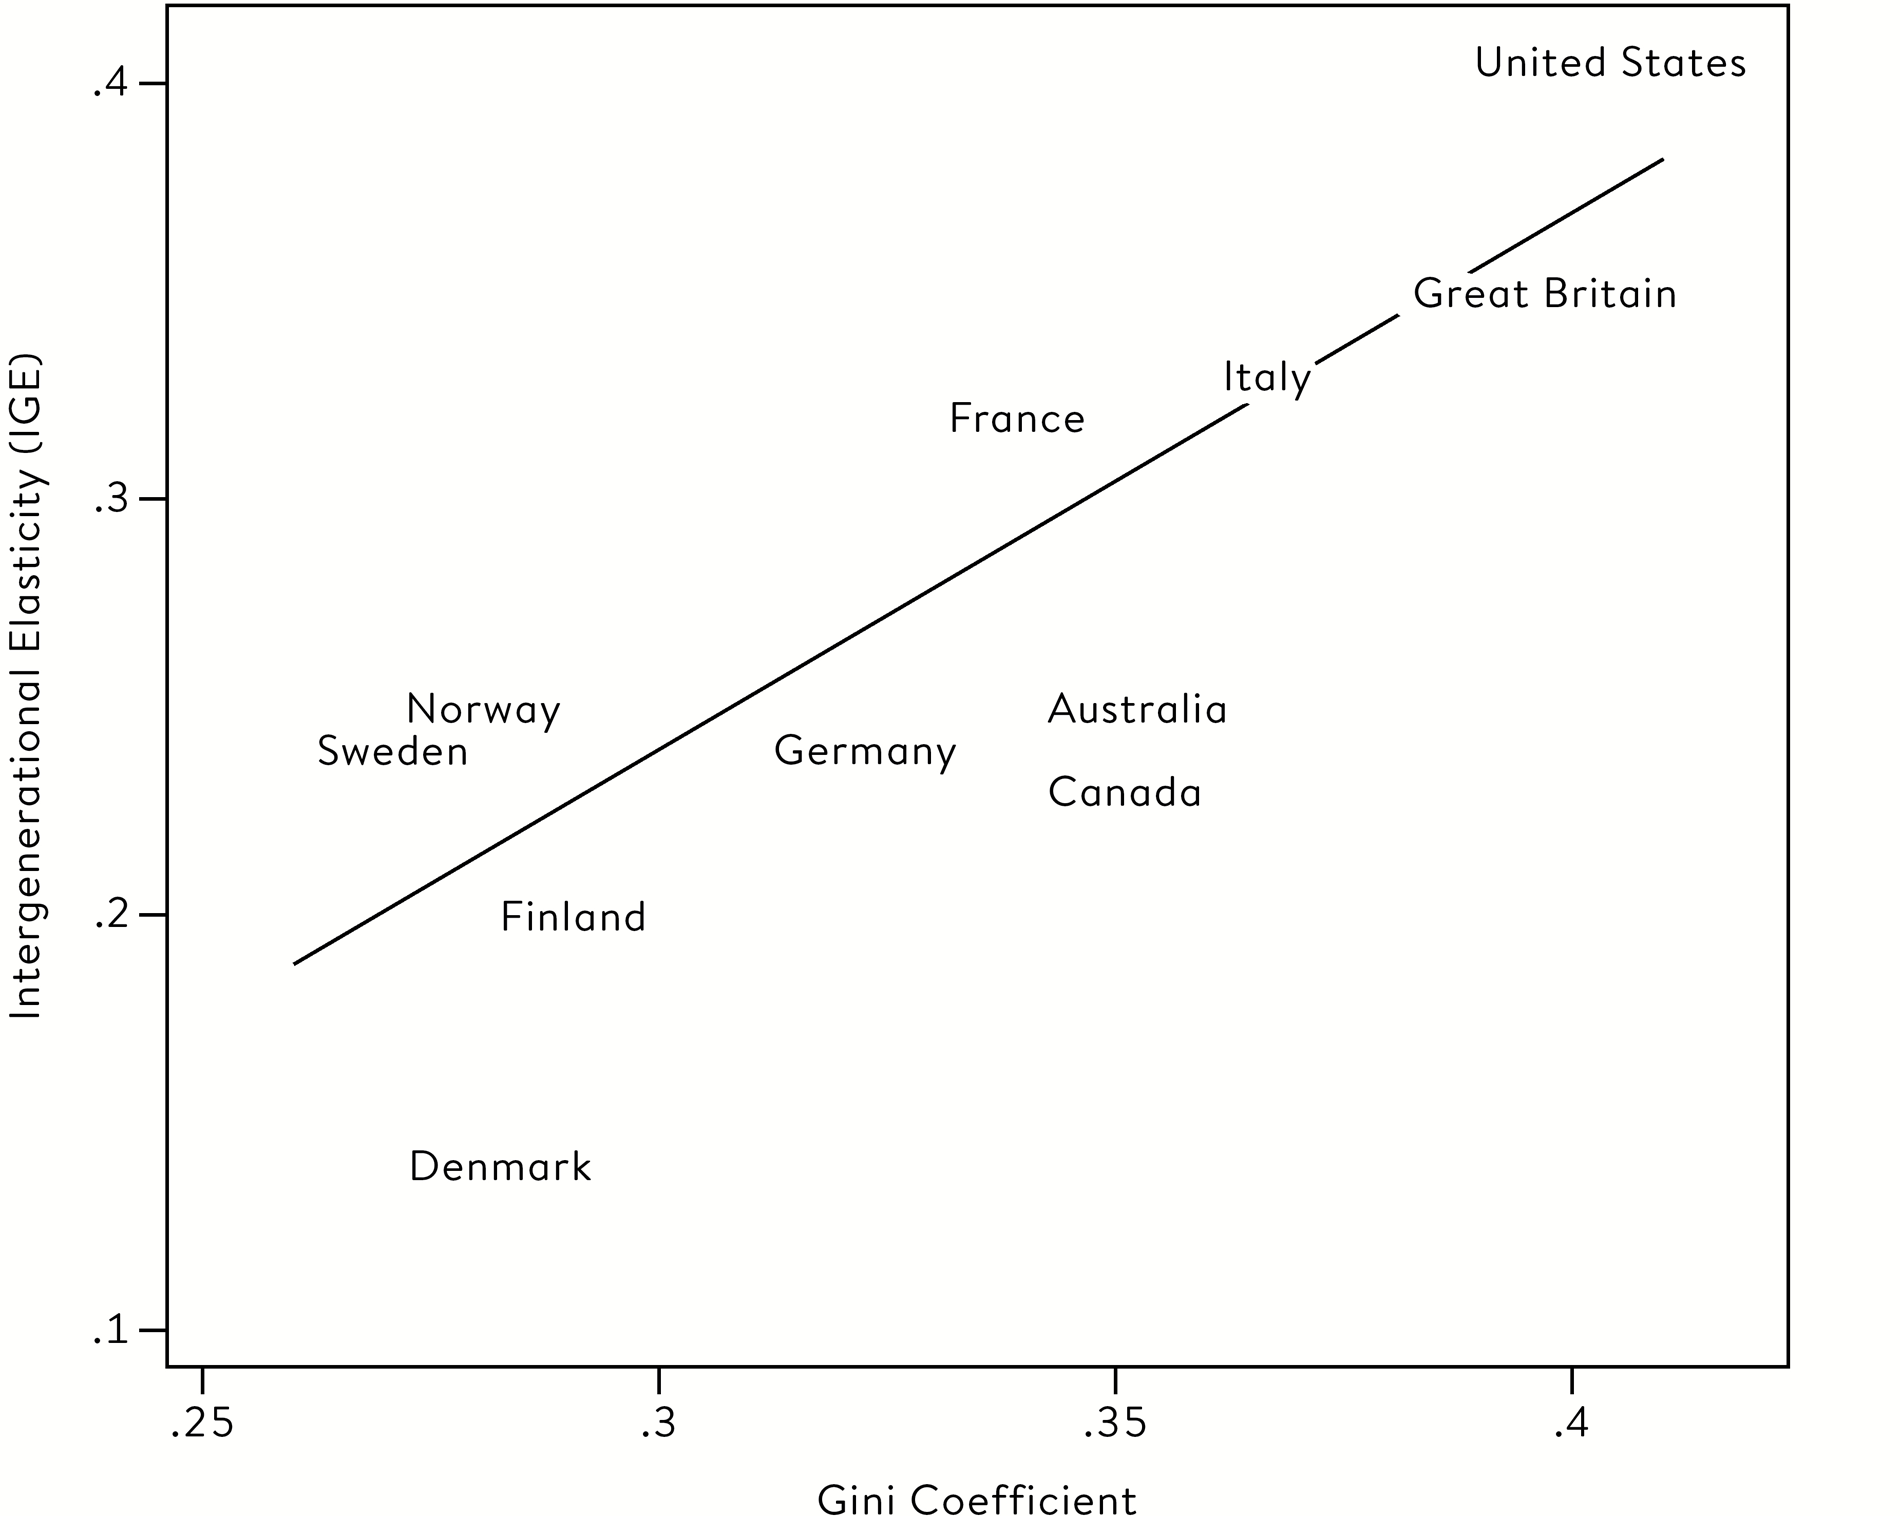
The Great Gatsby curve.19
Corak’s statistics, carefully estimated over many years, chimed with other studies. In 2009 Australian academics produced a graph entitled ‘more inequality, less social mobility’.20 A similar graph is presented in the book The Spirit Level.21 The LSE report on Britain’s low social mobility meanwhile cited two main drivers – widening income and education inequalities.
But the Curve charts a correlation between two statistics, not a causal relationship. This is an important point. If it was that simple, improving mobility would be a straightforward task of raising taxes to redistribute money. Income gaps would be reduced and life prospects instantly boosted for people from all backgrounds. But this would ignore a critical point: it is how money is spent that decides who progresses up, or slides down, the income ladder. Richer families deploy their resources – most noticeably on the education of their offspring – in ways that lead to enhanced life prospects compared with families from poorer backgrounds.
But Krueger is convinced inequality does lead to lower mobility: ‘I do think it is a causal relationship. I think the research points fairly strongly at that. Another way of thinking about this is that if it is a causal relationship then this relationship is exactly what one would expect.’22 The Great Gatsby Curve suggests the political debates over whether to aim for equality of outcome or equality of opportunity are a false dichotomy. The two principles are inextricably related: extreme inequality of incomes at one point in time leads to greater inequality of opportunity over time which in turn leads to widening gaps between the rich and poor. This seems plausible, given that privileged elites over successive generations may be less inclined to support the redistributive policies that would give those lower down society’s ranks a greater chance of displacing them at the top.
Moving Up (or Down) the Great Gatsby Curve
The Great Gatsby Curve suggests that wide gaps between the rich and poor, if left unchecked, lead to more rigid societies. And the problem for Britain is we sit (alongside the US) in the worst place: the upper right-hand quadrant of the Great Gatsby graph of high inequality and low mobility. If the relationship continues to hold true for current generations of children and young people then it does not bode well for future prospects for social mobility. As we have seen, there could be as much as a 40 per cent drop on current mobility levels, given the data from other countries.
How is it that wide gaps between the rich and poor lead to lower social mobility levels? Partly this is because in Britain it is simply harder to climb the income ladder than say in Canada or Denmark, as growing income inequality has made the steps much wider. But it’s also likely to be due to the unequal forces that shape the lives of children from different backgrounds.
Richer children are more likely to benefit from a stable, supportive and less stressful family environment during their early years. As they grow their parents are adept at deploying considerable time and resources to enable their children to access the best schools, private tutors and universities in Britain. The education system has become the vehicle through which inequality of incomes drives inequality of opportunities. And this appears to be a particularly British phenomenon: larger gaps in educational achievement are observed between poorer pupils and their more privileged peers in this country compared with those in Australia and Canada.23
Widening Wealth Gaps
Inequality is multi-dimensional. It’s not just about the pay we receive but the assets we own – cultural, social and financial. Growing inequality of wealth has consolidated the position of the elites. Not only do they benefit from the high returns from their financial investments, but the expensive homes they own enable their sons and daughters to access the country’s best jobs in the heart of London. Bricks and mortar have created new obstacles to social mobility.
Another signal of Britain’s increasing rigidity is that the likelihood of getting on the housing ladder for the first time has decreased for recent generations. There has been a drop in ‘home ownership’ mobility – mirroring the decline in income mobility.24 For many people in developed economies, housing wealth is the largest component of their overall wealth. Changes in the extent of home ownership mobility also reflect changes in wealth mobility.
We chart this generational shift in Figure 1.4, comparing the two generations, those born in 1958 and in 1970, at age 42. It traces people in both generations according to one single factor: ‘owner occupancy’ – whether they or their parents owned their own home.
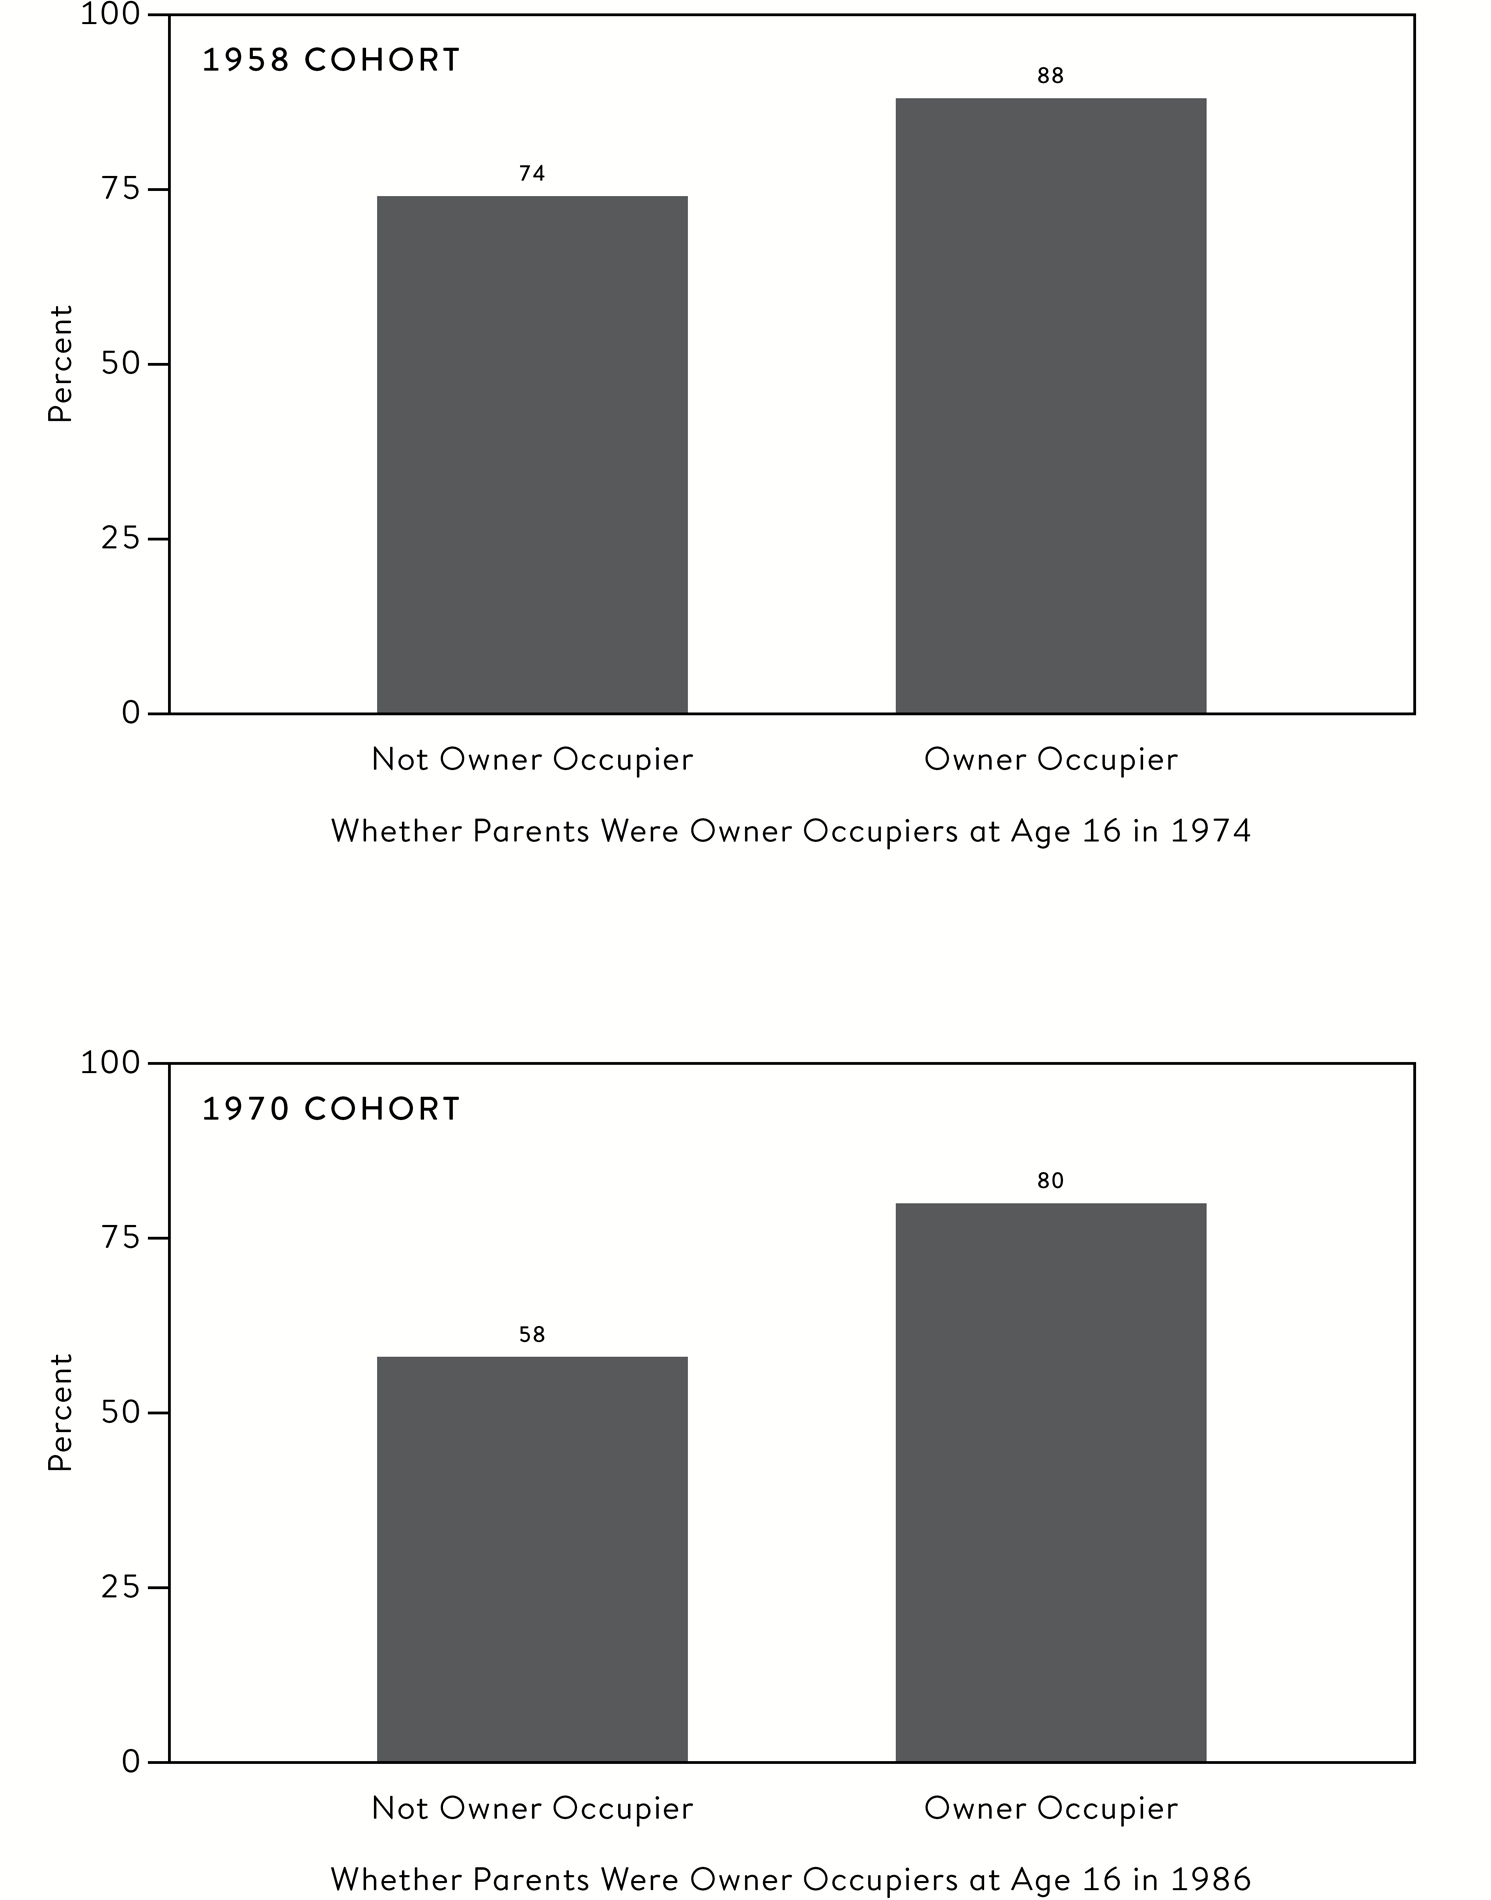
Percentage of owner-occupiers at age 42 in two generations.25
A bigger divide has emerged in the chances of becoming a home owner for the more recent generation. For those born in 1958, there was a gap of 14 percentage points in the likelihood of becoming an owner-occupier between those brought up in rented accommodation and those from home-owning families. But for those born in 1970 the gap had stretched to 22 percentage points. ‘Generation rent’ is just another manifestation of low social mobility in Britain.
Krueger uses The Great Gatsby to draw parallels on rising income inequality in modern society with the great divides from a century before; Thomas Piketty instead shows how the accumulation of wealth is once again limiting intergenerational mobility in the twenty-first century, as it did in the early nineteenth century. In his book Capital in the Twenty-First Century, the French economist references the novels of Jane Austen and Honoré de Balzac.26 Austen’s novels reveal the rigid class structure of English society, dominated by powerful dynasties owning vast assets. In Balzac’s 1835 novel Le Père Goriot, a young law student, Rastignac, faces a dilemma: either he marries a rich heiress to gain wealth, or pursues a much harder life on his own to realize his dream of becoming a professional lawyer. Early twenty-first-century Britain is beginning to resemble nineteenth-century France, with inherited wealth making up an increasing share of national income. C’est la vie.
Finally, increasing gaps between the rich and poor appear to depress not only relative income mobility but absolute mobility levels as well. Once again the warning signs come from the other side of the Atlantic. Half of Americans are now worse off than their parents.27 The American dream of just doing better, let alone climbing the social ladder, is dying.
Three-quarters of this decline is down to widening gaps in income inequality; a quarter is down to lower economic growth.28 The implications for government policy are profound. Simply boosting the national economy, even if it could be achieved, would have little impact on absolute social mobility levels; it has to be inclusive growth, involving and benefitting all. In the next chapter we will show how younger Britons are also facing the prospect of earning less than their parents. This in turn means fewer are likely to climb an already steep income ladder. For the ill-fated generations of the future it will be an era of shrinking opportunity.