
Big Data Hunter
The world’s leading researchers are constantly on the lookout for new data. The better and more extensive the statistics, the more accurate and powerful their academic work will be. This is true in many academic fields, but particularly so in the study of social mobility, where researchers have to rely on national data sets spanning entire populations.
This is why the achievements of Raj Chetty are so impressive. Chetty, who was born in New Delhi and moved to the US when he was nine, became one of the youngest ever professors at Harvard. Now at Stanford, he has demonstrated great skill in hunting down and interrogating ‘big data’ – huge datasets containing millions of statistics.1 And that statistical power enabled Chetty and his fellow researchers to produce a landmark study that catapulted social mobility research into a new dimension.
Other researchers are still scratching their heads trying to fathom how Chetty and his fellow economist Emmanuel Saez persuaded the US Treasury Department’s Office of Tax Policy to hand over the tax records of 40 million Americans.2 Government tax data is notoriously hard to access. And these records were gold dust as they linked adults’ tax returns with their social security numbers – revealing information about their circumstances as children.
Chetty’s treasure chest of data revealed for the first time a detailed map of upward mobility levels for different cities, counties and states across America (defined by 741 different ‘commuting zones’).3 Using the records of the incomes of 40 million children growing up in the 1980s and their parents they produced a modern day Domesday Book documenting the best and worst places for social mobility in the US. The findings enable us to get closer to finding out what we might do to improve social mobility.
‘It’s encouraging as it suggests that the problem is tractable and we can do something in local communities to have a meaningful impact on opportunity,’ says Chetty. ‘What we see in the data is that it is much more of a local problem: the San Francisco dream versus the Atlanta dream; the situation is different across small places.’4
The economists looked in particular at the chances of children experiencing the so-called ‘long range’ mobility we considered in Chapter 1 – moving up from the lowest income bracket in childhood to the highest income bracket in adulthood.5 This is moving from the sticky bottom end of society to the sticky top.
They found poor children who grow up in certain American cities and states have much better odds of escaping poverty than similar poor children elsewhere. In the highest-mobility areas of the United States, more than one in ten children with parents in the bottom quintile of the income distribution reached the top quintile by adulthood. In the lowest-mobility areas, less than one in twenty poor children reached the top quintile.
As Figure 3.1 shows, in cities such as San Jose (where children have a 12.9 per cent chance of becoming a high earner as an adult), San Francisco (a 12.2 per cent chance), Seattle (a 10.9 per cent chance), and parts of New York (a 10.5 per cent chance), the likelihood of climbing the income ladder are on a par with socially mobile countries such as Denmark or Canada.
But for others such as Atlanta (where children have a 4.5 per cent chance of becoming a high earner as an adult), Cleveland (a 5.1 per cent chance) and Chicago (a 6.5 per cent chance), levels of mobility are depressingly low. Poor children living in areas in the west and north-east of the country were found to have the best chances of making it to the top; those in the south-east of the country and the ‘Rust Belt’ had the worst chances.
Baltimore, Maryland is a place of scant opportunity – in real life as well as fiction. The American HBO television drama The Wire depicted Baltimore’s brutal gangland battles, shining a light on how people are affected by the places they grow up in – and the inadequacy of the public policies they experience.6 For British audiences it was a delicious irony that one of the main characters, Jimmy McNulty, a detective in the Baltimore Police Department, is played by an Old Etonian English actor, Dominic West. But that is another story we shall return to.
According to the American political scientist Francis Fukuyama, the show was a powerful indictment of failed social policies – on education, housing, employment and crime prevention: ‘The drug trade, single-parent families, unsafe neighbourhoods and poor, under-resourced schools are the results less of poor individual choices than of dysfunctional institutions. If we are going to change any of the outcomes on the ground, we cannot rely simply on self-help.’8

The geography of upward mobility in America.7
Moving to Opportunity
The ultimate dream for researchers is to find the real reasons behind social trends – discounting all other possible explanations. The question for the Chetty team was whether the place you grow up in has a genuine causal impact on your life chances. They were able to provide an answer by analysing data from the Moving to Opportunity (MTO) experiment in the US in the 1990s.
The initial results of the MTO research were disappointing. Families in high-poverty housing projects were offered housing vouchers to move to lower-poverty neighbourhoods. In New York, for example, many MTO participants moved from Martin Luther King Towers, a housing development in Harlem, ten miles north to Wakefield in the North Bronx. Ten miles can make a big difference in New York. Yet when the researchers compared what happened to families who moved with those who stayed they found little difference: the reading and maths scores of children and the future earnings of adults were the same.9
But when Chetty looked into what happened to children who moved when they were under the age of thirteen, a different picture emerged.10 Younger children who moved to better-off neighbourhoods were more likely to go to college; they were also more likely to earn more in their twenties compared with children left behind.
Not only this, the uplift in fortunes was felt for future generations – what Chetty calls ‘downstream impacts on family structure’. Girls who moved into better neighbourhoods were more likely to stay in the same relationship as adults when they had children: the grandchildren of movers in the experiment were more likely to be raised by two parents.
‘It really seems like childhood environment is what is driving these differences across areas, moving to a better area as an adult doesn’t seem to do a lot for you in terms of economic outcome,’ says Chetty. ‘The data shows we can do something about upward mobility. Every extra year of childhood spent in a better neighbourhood seems to matter.’11
The middle-class communities in lower poverty areas did not suffer as a result of their new neighbours. ‘There is no smoking gun evidence in the data that the rich tend to do worse in more integrated cities,’ says Chetty. Place matters: where you are born as well as who you are born to has a profound impact on your life prospects.
England’s Mobility Map
England’s education equivalent of the Chetty chart is a map published by the Sutton Trust education foundation revealing the places with the biggest academic divides.12 The Social Mobility Index ranked parliamentary constituencies according to how well disadvantaged children performed at different stages of their education, from early-years tests and school exams to entry into university and professional life.13
In England, as in America, where you live has a profound impact on your educational prospects. And the poorest districts are not necessarily the poorest performers. Two-thirds of teenagers in Bethnal Green and Bow in London are from low-income households. Yet they were almost four times as likely to get the national benchmark of five or more A*–C grades at GCSE as their peers living in Barnsley Central in South Yorkshire.14
Poorer pupils across the Midlands and North of England – in Derbyshire, Yorkshire and Nottinghamshire – were the least likely to do well. Education black spots included coastal towns, former industrial centres and many rural constituencies. On the other hand, London boasted thirty of the fifty best-performing areas, despite having high proportions of poor children.
Many of the constituencies represented by prominent political leaders performed poorly according to the Mobility Index. David Cameron’s Witney constituency was ranked 475th out of 533, only slightly ahead of Labour leader Ed Miliband’s Doncaster North, ranked 528th. The country’s leaders seemed powerless to improve the prospects of the children they represented as Members of Parliament.
Some of least mobile districts in Britain achieved national notoriety. Knowsley in the north-west of England was found to have no A-level courses on offer for its teenagers.15 Journalists revealed a community brutalized by ineffective education, deprivation and unemployment over successive generations. Children were growing up in families of ‘trans-generational’ unemployment where parents, grandparents and even great-grandparents had never worked. Official census data revealed Knowsley’s population to be 97 per cent white.
Cross Atlantic Parallels
The message from the first spatial study on income mobility across the United States resonates with the evidence on education and social mobility for Britain and elsewhere around the world.
The lowest opportunity districts in the United States are not necessarily the poorest areas of the country, but those with the biggest income gaps between rich and poor. Areas with larger Gini coefficients had smaller betas (less upward mobility). Chetty notes the link is ‘consistent with the Great Gatsby curve documented across countries’. This does not prove that income gaps cause immobility, but just as Alan Krueger argued for country comparisons, the local patterns are exactly what you would expect if the relationship was causal.
High-opportunity areas were linked with higher test scores at local schools and lower drop-out rates for students. The research meanwhile confirms that family matters. One of the strongest factors linked with places of high opportunity in the US is a higher proportion of two-parent families. This again chimes with the international evidence. Children in Britain are at least twice as likely to have been born to teenage mothers as children in Australia and Canada.16 And all this makes sense given the evidence in the early years suggesting stability aids the healthy development of young children. Yet little evidence exists of effective programmes or policies that could encourage such family stability. America’s map of mobility appears to confirm that inequality, in all its economic and social dimensions, is linked with income mobility.
‘Social capital indices’, indicated by the strength of social networks and community involvement, were also significant. High upward mobility zones were populated with people more likely to participate in local civic organizations. These findings chime with those on America’s ‘social capital’ divide presented by Robert Putnam.17
The Harvard academic has documented how the American professional classes are investing more in family life, community networks and civic activities. In contrast, supportive family life is fracturing among poorer and less educated families. Society’s divide is not just economic but social, and this will likely limit future social mobility.18
The top echelons of society are pulling away from the bottom in myriad ways whether measured by school sport participation, obesity, maternal employment, single parenthood, financial stress or friendship networks. This gap amounts, Putnam fears, to a ‘crisis’ for the American dream. Taking the time to sit down with the family for dinner for Putnam is an ‘indicator of the subtle but powerful investments that parents make in their kids (or fail to make)’.
In high-opportunity districts black and white and richer and poorer families were more likely to live side by side. One plausible theory for the higher levels of income mobility in Australia and Canada compared with Britain and the United States is that, historically at least, they have experienced lower levels of social segregation in local communities.
Urban sprawl, as measured by commute times to work, on the other hand was bad for mobility: poor transport links limit access to job opportunities. The geographical isolation and poor transport links limiting the American dream in US cities has distinct echoes in the coastal communities left behind and stranded at the edges of England. Once prosperous seaside towns such as Blackpool, Lowestoft, Scarborough, Great Yarmouth, Hunstanton in Norfolk and Minehead in West Somerset have been identified as social mobility ‘coldspots’. The demise of the tourist trade has been accentuated by poor transport links to England’s main urban centres.19
These sad seaside towns are a reminder of the difficult question left unanswered by the Chetty work: it is all well and good to show people’s lives are transformed by moving away from low-opportunity areas, but what about the communities left behind? While there is much merit in enabling talented young people from less privileged backgrounds to move out and move up the social ladder, this will have little impact on Britain’s enduring stickiness at the bottom of society’s ranks.
We must tread cautiously in drawing conclusions from America’s Mobility Map, impressive as it is: these are features associated with high-opportunity areas, and not necessarily the causes of lower mobility. But for Chetty there is a positive message from the data: local policies can improve social mobility.
Political Divisions
The vote to leave the European Union in June 2016 prompted much reflection on the divisions it exposed across Britain. Growing regional education inequalities had contributed to the Brexit vote, claimed the Government’s Chief Inspector of schools, Michael Wilshaw. Regions were in danger of adding a learning deficit to their economic one. ‘If they sense that their children and young people are being denied the opportunities that exist elsewhere that will feed into the general sense that they are being neglected,’ he argued. ‘It wasn’t just about leaving the European Union and immigration, it was the sense of disconnection with Westminster.’20
The vote was for some a ‘two fingers’ to the nation’s political elites delivered by the socially immobile.21 Younger voters who wanted to remain in the EU complained bitterly that the older generation, themselves the beneficiaries of the post-war boom in social mobility, had voted overwhelmingly for Brexit.
A survey carried out before the referendum had confirmed people’s widespread pessimism about their prospects of climbing the social ladder.22 Nearly 75 per cent believed it was difficult to move between classes, a rise from 65 per cent a decade previously. More than three out of four people thought the class divide was very or fairly wide. People believed British society is divided between a large disadvantaged group and a small privileged elite.
When Donald Trump was elected President of the United States in late 2016, Britain’s social mobility tzar claimed there was an ‘us and them’ society on both sides of the Atlantic. Alan Milburn said there was a growing sense that ‘a few unfairly hoard power and wealth’, a situation that was ‘deeply corrosive of our cohesion as a nation’. A survey found less than a third (29 per cent) of British people believed everyone in Britain has a fair chance to go as far as their talent and hard work will take them.23
For the US economist Lawrence Katz, one reason for the political unrest is that many people perceive that they no longer have a shot at a good local job in the way their parents did. There used to be a sense that you could get a job with a good employer in your town, even if you were not a college graduate, and it would lead to a long-term (and often unionized) job with reasonable benefits. ‘It’s the sense that there used to be a pathway, that if you worked hard you could get a good job and share in prosperity – if General Motors did well, you would do well. The sense that that pathway is gone has had a large political effect.’24
The backgrounds of those voting against the educated elites of Westminster and Washington were different in many ways, reflecting the countries’ distinctive populations. But one common demographic group stood out: the white working class. Over two-thirds of white people without a college degree voted for Trump.25 He was also backed by just under two-thirds of Americans who believed life would get worse for future generations. The least socially mobile areas of Britain meanwhile, many inhabited by white working-class communities, were those areas most likely to vote for Brexit. Trump said his rise to power was ‘Brexit plus’.26
Our own analysis of the data confirms the link between social mobility and voting patterns across the country at local authority level.27 Brits with little chance of moving up tended to vote out. In South Derbyshire, six in ten people did so; in Barnsley, Normanton and Ashfield it was nearer seven in ten.28 The people of Knowsley also voted to leave.
The first map in Figure 3.2 shows how the mobility prospects of those from disadvantaged backgrounds varies across local authorities in England; a darker shading reflects places with better mobility prospects and a ‘colder’ shade those with worse prospects. The second map shows the percentage of people voting to leave the European Union, with darker shades denoting a higher Leave vote and the lighter shades a higher remain vote. The two are close to being mirror images of each other. Where the first map shows more darkness, the second map shows less, and vice versa.
Social Mobility and Voting in the EU Referendum
The relationship between the Leave vote and the Social Mobility Commission’s social mobility index for local authorities is shown in Figure 3.4. There is a strong link between areas of low mobility and areas that voted to leave the European Union. Each dot represents an area in England. Those on the left-hand side have the lowest mobility as measured by the index; those higher up on the graph had the largest majorities voting for Brexit. The straight ‘best fit’ line, calculated using all the data points, reveals the strong average association between the likelihood of voting for Brexit and levels of social mobility.
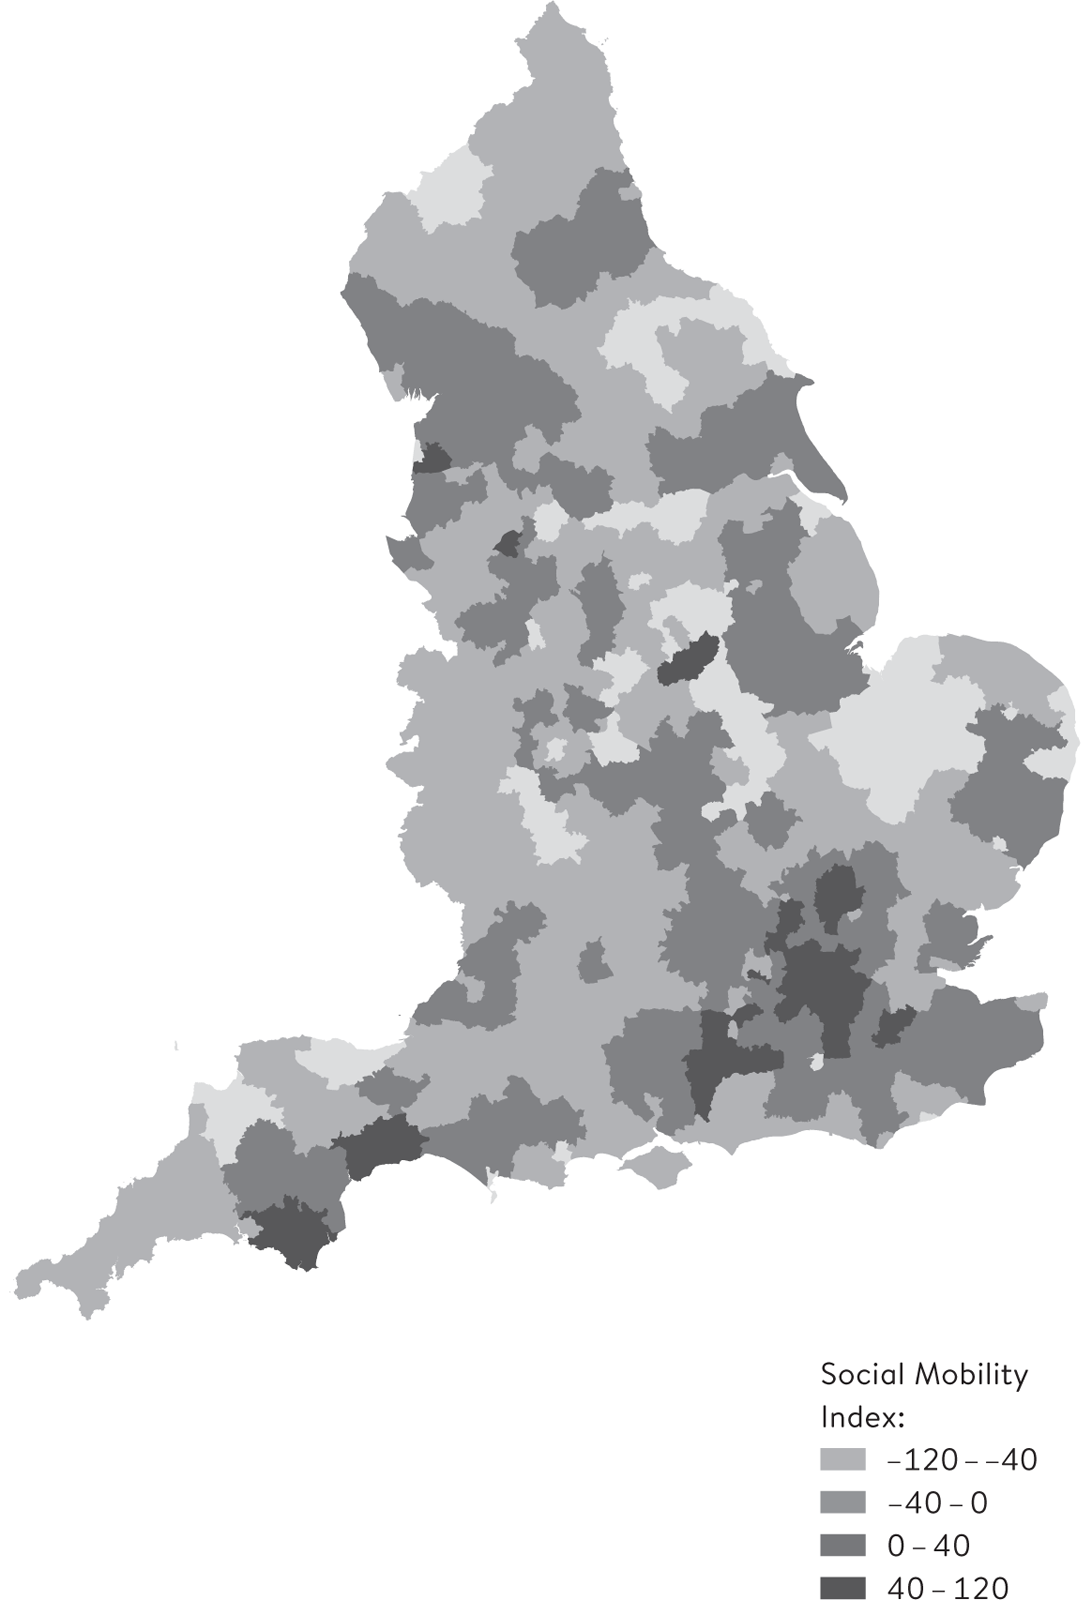
Social mobility in england by local authority.29

Leave voters in the EU referendum in England.
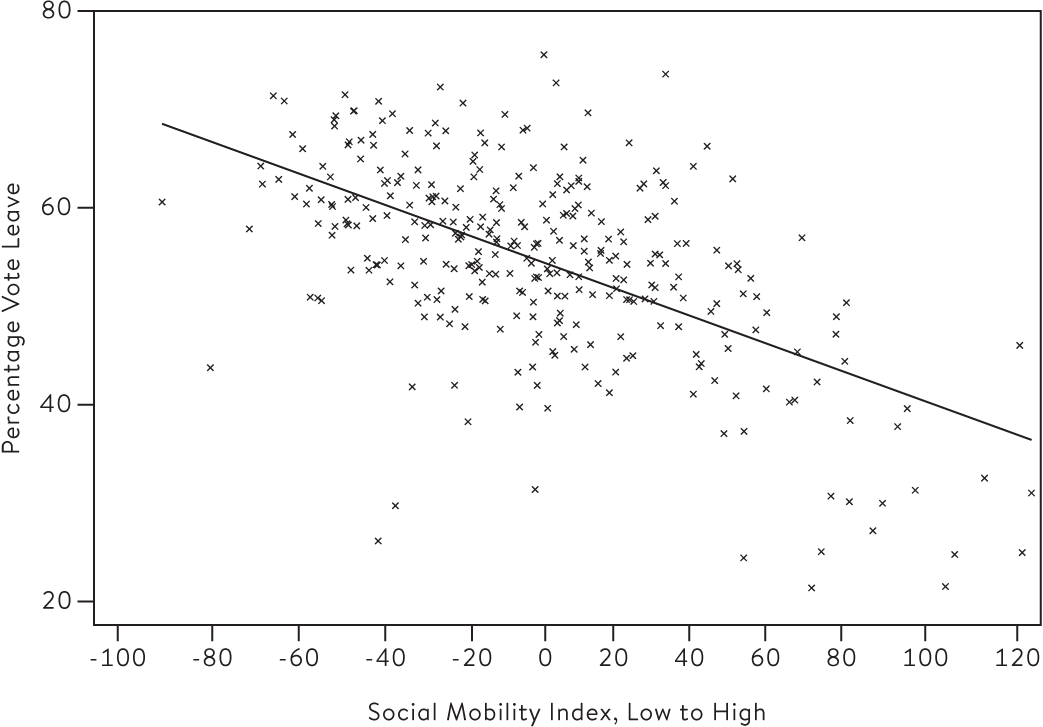
Brexit and social mobility in England’s 320 local authorities.30
Our analysis of the voting data suggests the Leave campaign won the referendum partly because it persuaded the country’s socially immobile that an independent Britain would hold better prospects for them – whether this was true or not. The Leave vote was strongest in areas of the country where people felt stuck in their lives and had lost confidence in the Government to change anything for the better.
The rhetoric from the elected leaders in both Britain and United States in 2016 played to the disaffected – promising to improve the lives of those failed by previous administrations. Prime Minister Theresa May vowed not to be driven by the interests of the privileged few, but by ‘those of ordinary, working-class people’.31 Trump meanwhile declared on the eve of his stunning electoral win that it would be a day that ‘the American working class is going to strike back, finally’.32
Paradox of the American Dream
These high hopes will need to translate into policies that stand the test of time. Chetty’s findings point to a paradox of the American Dream: the best places for upward mobility for the generation born in the 1980s were overwhelmingly the most expensive places to live for the millennial generation growing up in the early twenty-first century.33 For young families seeking a better life for their children there is a limited window of opportunity. Timing as well as place matters.
San Jose in the 1980s had the perfect mix of factors that propelled many of its poorest residents into the upper echelons of America’s earners: cheap housing, proximity to a burgeoning industry, and an integrated community including tightly knit immigrant communities. There are many theories as to why San Jose was such a hotbed of mobility: the city benefitted from the influx of highly aspirational Asian families as well as progressive local chief executives committed to pay workers in low-end jobs decent wages so they could live and function properly.
But by the early twenty-first century San Jose, in mobility terms at least, had become a victim of its own success. House prices skyrocketed to match the demand from highly paid employees in the booming businesses in Silicon Valley. The region’s rich and poor increasingly lived in separate districts. Middle-earning jobs all but disappeared. Rents in San Jose grew by 42.6 per cent between 2006 and 2014.34
The same ominous pattern can be observed in London. The mix of aspirational communities, good schools and dynamic industries made the international metropolis a hotbed of social mobility. But escalating rents, exclusive school catchment areas and elite internships threaten to turn it into a coldspot of low opportunity.
In the intergenerational opportunity game, yesterday’s high-mobility areas can be today’s exclusive but stagnant communities. Schools become middle-class enclaves. Inequality in earnings balloons. Far from acting as the great social leveller, the education system is manipulated and taken over by elites and vested interests to ensure their offspring, irrespective of talent, do not slip down the social ladder.