8The Financial Keys of XaaS
8
There is no doubt that XaaS offers can generate substantial revenue. After all, it was a proven business model long before the cloud came along. Just look at ADP, D& B, or your cellular service provider—companies that have offered technology as a service for decades. Today’s hot cloud companies are also racking up impressive revenue stats. Unlike the dot-com companies of the late 1990s that were virtually all FVAs, the revenues at companies like Salesforce and AWS are big and getting bigger. Figure 8.1. documents the incredible growth in combined top-line revenues for the 14 XaaS companies that have remained in our Cloud 20 index for more than 12 consecutive quarters with a CAGR of 26.6%.
These 14 companies have collectively doubled their revenues in just 3 years, but top-line growth is only one sign of financial success. Bottom-line profitability is the other. This is where XaaS providers have clearly struggled. In the Q4 2015 snapshot, publicly traded XaaS companies tracked in the Cloud 20 were generating an average operating income of –0.8%. Of the 20, 8 reported a loss. 1 In the same snapshot, Salesforce, which has now grown to more than $1.7 billion in quarterly revenues, barely cracked into profitability with a reported GAAP operating income of 2.5%. 2 In the following quarter, announced February 2016, management was predicting its first full-year GAAP break-even. CFO Mark Hawkins commented, “We are certainly excited about continuing on the path of raising profitability. And the top-line [revenue] is happening, too.”

FIGURE 8.1 Growth of XaaS Companies
It is interesting to contrast Salesforce’s financial trajectory with Oracle’s historical performance. In 1986, Oracle went public with $55 million in revenue. They were profitable that year. They grew revenues to more than $500 million in 4 years. They were profitable every quarter along the way. In the third quarter of 1990, they reported their first and only loss, and then quickly corrected and continued the trajectory of increased profitability over 2 decades. Today, they are generating an operating profit north of 35%. No enterprise application SaaS company can make a similar claim. Clearly, there is something different in the financial model.
Figure 8.2 compares the operating expenses of present-day SaaS companies in the TSIA Cloud 20 that have revenues over $500 million to the current cost structures and profit performance of the license software companies in the Technology & Services 50 (T& S 50).As can be seen, these larger SaaS companies are still not profitable on a GAAP basis, and the traditional license companies are exhibiting superior financial performance on all five key indicators. This could lead you to question the logic that SaaS grows into a profitable business model over time. What they do really well is grow revenues. What they do not do so well (so far) is throw off GAAP profits. That is the reality of the XaaS 1.0 financial model.

FIGURE 8.2 SaaS versus Software Business Models
As we have repeatedly pointed out, SaaS companies in the Cloud 20 are currently spending an astronomical average of 39% of revenues on sales and marketing. In fact, companies like Log-MeIn, Salesforce, and Vocus are all spending more than 50%.This percentage is much higher than the 28% of revenue being spent by license-based software companies on sales and marketing. It is perhaps the largest single cause of low GAAP profits for many SaaS companies.
So, why would any company want to pursue a financial model that can be so prone to losses? Let’s explore the pros and cons of XaaS economics.
On the upside, there are lots of things to love. Four reasons in particular jump to the top of the list:
• Customers like the consumption model.
• Investors are keen to reward the revenue growth potential.
• Recurring revenue is a beautiful thing.
• Free cash-flow generation can be very strong.
Let’s explore these four benefits of the XaaS economic model in a bit more detail.
From a customer perspective, there is no debate as to whether XaaS concepts like subscription/pay-for-use pricing and simpleto- consume technology have become permanent fixtures on the tech landscape. Both consumers and enterprise tech buyers— particularly buyers and users on the business side of enterprises (as opposed to the IT side)—LOVE these models. XaaS reduces their risks and speeds their results. They can start with small pilots and short-term commitments (monthly, annual, even NO commitment) and grow if and when they succeed. XaaS also allows them to side-step many of the perceived delays and hassles that are associated with large IT-driven projects. They can just sign up and start consuming. And, most importantly, there are some pretty cool XaaS technologies out there . . . some with features and benefits that can only be achieved in the cloud. So let’s not spend any time defending XaaS as a permanent alternative to buying technology assets. It is here to stay, and suppliers should learn to love it or risk losing customers.
The second reason that XaaS is a great place for providers to be right now has to do with the incredible valuations currently being bestowed on pure-play XaaS companies by the financial markets.
This part of the story can be frustrating if you are a traditional, asset-based company. That is because tech-stock valuations as of early 2016 are a tale of two formulas. Traditional tech-company stocks are still valued the old-fashioned way, as a multiple of GAAP earnings. But pure-play XaaS company stocks are being priced based on a multiple of revenues driven by the revenue growth rate.
It would have been hard to imagine just a decade ago, but many traditional tech stocks are anchored almost entirely by their profits, not their growth. This is especially true of consistently profitable, divided-yielding tech stocks like Microsoft, CA, Symantec, and Cisco. If these kinds of companies went through an extended period of deteriorating profit, their stock prices would be imperiled. It follows that the management of these businesses must focus each and every quarter on sustaining and growing profits. That’s the fish model problem we covered in Chapter 5 . Clearly, revenue growth remains very valuable to these companies but NOT at the expense of profits. They often know some growth levers they would like to pull—i. e., significant investments that could lead to more growth but result in lower profits during the investment period—but that trade-off is not one that many of their shareholders are willing to tolerate.
At least until recently, the executives who lead pure-play XaaS companies have found themselves in exactly the opposite situation. It seemed perfectly acceptable to the investors in these companies to not have any GAAP profits as long as they have a great revenue growth rate. For some companies, the measure of growth may not even be of actual revenue. As we have already covered in this book, some FVAs are free to discuss growth rates in terms that may have little or no current economic value, like users, downloads, or page views. Investors are betting that, at some point, those assets will be translated into economic value, but for right now, it is a game of capture, not monetize. This has been particularly true for consumer applications like Pandora or Twitter. But the phenomenon is not exclusive to them. Many B2B XaaS companies today will often lead their financial reviews with user growth statistics. For these companies, management decisions are often made with a different mind-set: Will this investment help our growth rates continue or accelerate? In early 2016, some financial analysts have criticized a few XaaS companies who keep extending their profit horizon or are reporting sales slowdowns. If this noise in the system increases, it will put more pressure on XaaS executives to prove their financial model sooner rather than later. But for now most are still free to pursue growth investments as long as the cash lasts.
Another case for higher sales and marketing spending by SaaS companies in particular can be made by arguing that these companies may have a larger total addressable market (TAM) than traditional companies. That’s because cloud-based solutions reduce the number of investments a corporate customer has to make (they don’t have to buy more hardware, they pay less for implementation services, and so forth—often things that they purchased from other vendors).That means budget dollars can be aggregated and focused on buying more of the XaaS provider’s offer. Also the XaaS company can tap into both IT and departmental budgets. It can derive revenue not only by charging for basic access to the offer but also for actual use. The more the customer uses, the more they pay. That is not the case with most traditional software products. Finally, depending on what the SaaS offer is, the provider may actually be able to expand their TAM by opening up entirely new cloud marketplaces that make users out of people or companies that never would have been able to access a traditional, on-premise software product. Just think about how Apple and Salesforce make money off their market platforms. Arguing that the XaaS TAM is larger helps support the notion that spending more to develop and access it makes sense. The logic is that the XaaS company can ultimately be larger than a traditional competitive counterpart.
So there are two different stock price formulas: one based on profit growth, and one based on revenue growth. The impact of this difference on the ways that these businesses are managed is huge. Traditional tech companies face the daunting challenge of swallowing the fish. What’s frustrating for many of them is that they actually have sizable XaaS businesses growing within their four walls, but they simply can’t get the markets to value them in the same way that they value the pure-play cloud stocks. That logic would give the management of these businesses a clear path forward. They could grow their SaaS businesses by reinvesting some of the profits from their traditional businesses. They could report them separately. The higher valuation of the SaaS revenues would more than offset the reduction in valuation due to lower profitability. The stock price would remain the same or higher during the transition. Both management and investors would have a straightforward and transparent way to transform the financial model for the XaaS epoch. This is part of the path we recommended in Chapter 5 , but we see very few companies doing it effectively.
It is safe to say that running a pure-play XaaS company today is a simpler task than transforming a traditional systems or software company. Investors support and reward their simple message: growth.
The third leg of the XaaS stool that everyone loves is its recurring revenue nature. XaaS is, after all, technology as a service , and services are typically purchased as subscriptions the same way cable TV or cellular service is. If you look at the financials of most enterprise XaaS companies, you see two wonderful things: one item on the balance sheet and another item off of it.
Though often priced “by the month,” most enterprise XaaS companies have adopted the practice of getting customers onto annual contracts that are billed and paid at the beginning of the contract period. The company then has a liability of actually delivering the service over the life of the contract. In accounting terms, this is known as deferred revenue —revenue that has been contracted for, billed, and even paid—but not yet delivered. This figure is recorded as a current liability on a XaaS balance sheet. This liability is balanced by the assets of accounts receivable or cash for these “pre-billed” services. The beauty of deferred revenue is that it is already committed and paid up front. The XaaS company doesn’t have to worry about building revenue from zero each month. It has revenue that is already committed, billed, and prepaid. All they have to do is deliver it. That’s great.
A second item that is frequently reported by XaaS companies but not carried on the balance sheet is something called “unbilled deferred revenue.” Unbilled deferred revenue represents business that is contracted but unbilled and off the balance sheet, meaning that customers are contractually committed to subscribe to the services for future periods. This is true for enterprise XaaS companies like Salesforce and wireless carriers like AT& T. Enterprise XaaS companies will often grant price incentives for their customers to sign multiyear contracts. That means a customer will commit to use the service at a particular minimum volume level for 2- or 3-year periods. In return for that commitment, they will pay a price that is more favorable than similar customers who only sign monthly or annual agreements. In this case, the XaaS company bills in advance for each year of the contract period on the anniversary date of the contract. The first year’s revenue is treated as deferred revenue and placed on the balance sheet as described earlier. The future years are tracked as unbilled, deferred revenue but not placed on the balance sheet until they are actually billed.
Why is all of this so important? First of all, deferred and unbilled deferred revenues give visibility and confidence to a company’s future financial performance. When Salesforce finished its 2015 fiscal year, it reported $5.4 billion in revenue. It also reported deferred revenue of $3.2 billion and unbilled deferred revenue of $5.7 billion. That means as the company entered its fiscal year 2016 period, it had guaranteed revenue of more than 60% of its previous year. To grow, it just needs to add another 40% from new bookings and non-committed renewals. Anything over that number will represent true incremental growth. So, management and analysts gain confidence that Salesforce will grow strong again, not only this year, where there is a committed revenue baseline of $3.2 billion, but also for the next couple of years, where there are committed customer revenues of another $5.7 billion for the company to draw from. This is supplemented in the XaaS model by highly likely renewals. Even when there are no committed future bookings, high renewal rates assure investors that future revenue growth is extremely likely. Combining committed and uncommitted renewals, companies like Salesforce and Netflix can head into a future year with the confidence that they just need to build on the 85% to 90% of recurring revenue from last year to achieve real growth. It’s a heck of a lot easier than starting over from scratch every year! Very powerful!
Recurring revenues offer an enticing allure of high profits. The magic occurs when a company’s recurring revenue base grows at a faster rate than its recurring expense base. It’s the wedge model we described in Chapter 2 . Hit that inflection point, and XaaS businesses should turn into money-making machines, because the incremental unit economics are very favorable. If XaaS management can achieve this state, then they can deliver both high-confidence revenue and high-confidence profits. Everyone is on the lookout for that point—both investors and management.
The other beauty of recurring revenue is its predictability. Wall Street loves predictability. It allows management to set fixed cost and profit targets with confidence. It reduces the risk of wide swings that spook investors. If you took two companies with similar growth and profit rates, one with high predictability and the other with low predictability, the former would receive a higher valuation. Maybe a MUCH higher valuation.
As we previously mentioned, we know this can work in enterprise tech because we not only have famous historical examples like ADP, but we also have a great living example of the power of the recurring revenue business model in the form of customer service/support and maintenance agreements. For decades enterprise tech companies maintained a pile of annual customer-service contracts. They have added service agreement after service agreement after service agreement—tens of thousands or hundreds of thousands for many companies. These are renewable annual subscription contracts, just like XaaS agreements. Once the company has enough service-agreement revenue to cover their foundational service delivery and software maintenance costs, the good times begin. Because the incremental unit cost to serve one more contract customer is low, the margins are huge. Get enough of those agreements on your contract pile, and you have a brilliantly performing P& L. Software companies like Oracle report maintenance and support margins of over 80%.
We have also seen it start to happen among XaaS companies. We mentioned that Rackspace was achieving very solid profits— for a time. More rcare currently free to pursue the theoryeently they have been under pressure from the killer Cs, but Amazon’s AWS is now unveiling surprisingly impressive growth and profit numbers.
So we know the subscription financial model can work. It can be big, profitable. and growing. It has worked in other industries and it has worked in tech.
The last (and certainly not least) thing we love about XaaS financial models is their ability to generate free cash flow. What often gets lost in most people’s criticism of XaaS economics is that free cash flow often occurs before and at a higher rate than GAAP profits! That’s because the revenue recognition rules force the company to defer the revenue ratably over the entire year, but the cash often comes in up front. After a SaaS company has enough cash coming in from its current customers to pay its expenses and pay off the costs of acquiring new customers, the cash should start to flow. Many larger XaaS companies report free cash flow gains that are much stronger than their GAAP profits.
These four defenses of the XaaS business model are legitimate, and they are frequently cited by top executives of leading SaaS and managed services companies. Many even articulate a fifth defense based on redefining the market’s view of“true profits.” This argument, also known as “non-GAAP profits,” maintains that certain expenses like stock option costs and acquisition goodwill should not be imputed into a company’s operating expenses. This can make XaaS profit numbers skyrocket. As we mentioned, we are not focusing on that debate. We are focused on GAAP profits because it’s the current financial standard. Achieve GAAP profits and your non-GAAP profits will be breathtaking.
Although the model can indeed work, the reality is that many XaaS companies today are not being pressured to prove it. They are currently free to pursue the theory that market share and topline revenue growth are the only two success metrics that matter. Thus, they are heavily investing in sales and marketing to grab customers. The logic is that the platform with the most customers will ultimately be the winner, the wedge inflection point will be reached, and—with market dominance and a large base of customers—profitability will come.
But XaaS has its critics, too! There are plenty of skeptical tech executives, accountants, and analysts who rally around the lack of GAAP profits. They wonder what will happen to the FVAs and MTWs who are short of the profit inflection point when Wall Street enthusiasm wanes and investors begin demanding profitability.
This leads us to perhaps the most controversial financial aspect of the subscription business model. Let’s call the problem the “current cost of acquiring future revenues.” In the world of subscriptions, revenue comes in over time but sales costs are incurred up front. According to GAAP, you have to recognize that expense when it occurs, not match it over time to the recognition of revenue. So that means you are paying in this fiscal period for the revenue growth you are going to have in future periods. If you cut back too far to ensure current period profits, you can risk future period revenue growth. So many XaaS companies argue that spending 1 to 3 times current bookings on sales and marketing expenses makes sense because they are “buying scale.” The logic makes total sense, but GAAP accounting doesn’t make it look pretty. The argument that there will need to be some adjustment in sales cost accounting rules, along with setting aside stock option and goodwill expenses, continues to rage on. The reality is that both sides are right. Service-based businesses have been dealing with the current cost of acquiring future revenue problems for decades. Somehow they have survived and made GAAP profits along the way. But they have not been hyper-growth XaaS companies. Their up-front sales costs could be absorbed, and they could still turn a GAAP profit. But today’s “unicorn” XaaS companies simply can’t absorb that much sales expense. They will continue to argue it’s the best use of capital—better than paying out profits. If they are able to build large revenue streams where sales costs can ultimately be dialed down as a percentage and profits extracted, they could be right. But that has not yet happened, as we have previously pointed out.
No matter which side of the fence you are on and regardless of the profit horizon you have in mind, a successful XaaS provider must have a clear understanding of how real profitability will be achieved and in what time frame. That understanding begins with an inventory of the various ways XaaS providers can make money.
Gears of the XaaS Economic Engine
Although the concept of technology as a service seems to introduce an overwhelming number of creative ways to monetize with customers, the economic engine of a XaaS company is typically composed of up to five potential revenue streams:
• Asset Revenue. This is when the customer pays for the right to own and use a copy of the software or hardware product. Some XaaS providers may sell some of their technology up front as an asset as part of a large deal. Many traditional companies offer hybrid solutions comprised of a mix of on-premise assets and cloud services. And, we are all familiar with paying for a smartphone up front and then agreeing to a 3-year cellular service contract.
• Technology Subscription Revenue. This is when the customer pays for access to technology as a service. That is the XaaS offer. Companies may have one core offer or a broad portfolio of them.
• Annuity Services Revenue. This is when the customer pays for ongoing premium services wrapped around the technology subscription, usually in an annual or multiyear contract. Premium support or success services, information services, and managed services fall into this revenue category.
• Project Services Revenue. This is when the customer pays the XaaS provider for specific deliverables such as implemen- tation or user training. These services may be a fixed fee or charged on a time-and-materials basis.
• Transaction Revenues. These are revenues that occur per customer transaction. For example, every time a customer clicks a certain feature, they are charged a small fee. Hopefully, these services collect small fees at large volumes.
Each of these revenue streams has a unique financial profile in terms of margin and profitability. We can review these revenue streams using the four traditional components of any business model:
• Cost of Goods Sold (COGS) and Gross Margin (revenue minus COGS). These are the costs associated with making, installing, and warranting the specific offer that is driving the revenue stream.
• Sales and Marketing (S& M). These are the costs to acquire and retain customers for this offer.
• Research and Development (R& D). These are the costs of developing the capabilities the customer is purchasing as part of this offer.
• General and Administrative (G& A). These are the operating and overhead costs allocated to the offer by the company that underlies it.
We track publicly reported data related to these revenue streams. For example, traditional technology companies reported the gross margin associated with selling hardware and software assets in Q4 2015.This is shown in Figure 8.3.
The average gross margin for these technology-as-an-asset companies is as follows:
• Software company average gross margin is 87% and the median is 89%.
• Hardware/systems company average gross margin is 50% and the median is 58%.

FIGURE 8.3 Technology Product Margins
We aren’t going to focus very much on traditional product margins, but we put it here for reference because employees from many hybrid companies will be reading this book. They will be using asset margins to blend into their overall financial model.
As for publicly traded XaaS companies, the Cloud 20 snapshot reveals a wide range of gross margin associated with technology subscription revenues. As shown in Figure 8.4 , these margins ranged from 56% to more than 87% in Q4 2015. Part of the margin variation is driven by each company’s decision on where certain specific costs should be accounted for. We know that there are lots of apples and oranges in comparing these numbers, but at least it offers us some visibility into actual performance. For XaaS companies, hosting costs are typically the major component of COGS, followed by basic customer support costs. We will kick out the outliers for our work ahead.
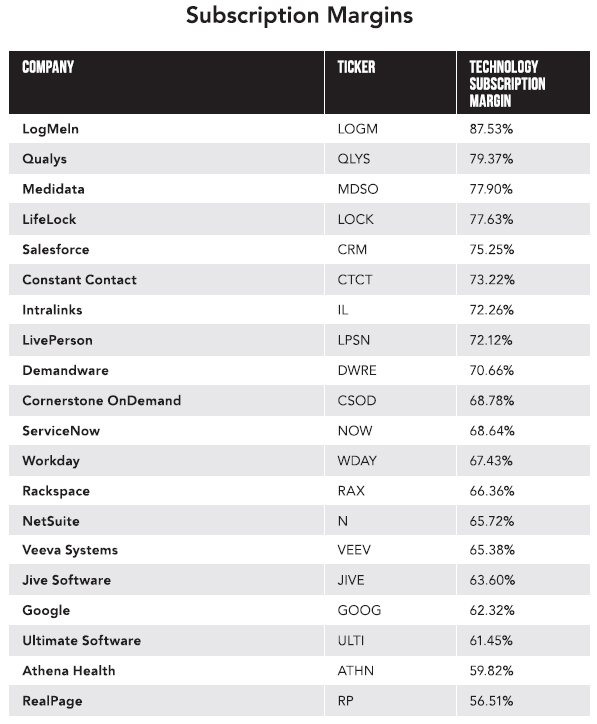
FIGURE 8.4 Subscription Margins
The average subscription margin for these XaaS companies is 69.60%, and the median is 68.71%. We will come back to these numbers soon.
As we move past basic subscription gross margins, we run into a limitation with the public data. We need to analyze all the revenue streams for the play we want you to run. However, not all the benchmark numbers we need for our financial model are widely available. The margin profile of things like project or annuity service revenue streams are often hidden from the public data. Therefore, we will supplement our data set with some TSIA industry benchmark data. As an example, Figure 8.5. provides an example of the financial data TSIA tracks related to project-based services. It shows the industry average and itemizes some of the peer groups we maintain related to project revenue performance. (Yes, we are teasing you with the average data, but not the peergroup breakouts.)

FIGURE 8.5 Business Model of Project Revenues
We will use these averages in the exercise soon to come. If you are a TSIA member company, we will be happy to provide you with your peer-group averages. We can also explain how we calculate each line.
So, pulling together the public and proprietary data streams, we can create tables that provide a trimmed-range snapshot of the financial performance that is currently reasonable to expect for each revenue stream. In a trimmed range, we drop the bottom 25% and top 25% of data points. We look at companies performing within the 25% to 75% range of expected performance. This approach eliminates outlier performers on the high and low ends. Of course, these financial results are moving targets and shift over time. You could argue with this data source or that one. That is why we continuously benchmark the performance of these revenue streams so the database gets bigger and the trends get more apparent. However, what is important is the model. Figure 8.6. provides a sample readout we provide to TSIA members when they are working with us to model target economic engines.
As we have said repeatedly, in establishing a very clear path to XaaS profitability, we think the question of setting the target revenue mix is a central topic. Diversifying into a profitable project services business is just one example. The answer to what the optimal mix is varies greatly based on the profit horizon being applied to the XaaS business. But, in general, we see portfolio mix as a critical tool that management has on its journey to profitable XaaS.
This brings us to the important part of this chapter. We have been studying both the public data and our TSIA research data. We think we are starting to see some patterns in revenue mix, margins, and profitability. Admittedly, it is still pretty foggy out there, but things are finally beginning to take shape. The key is to marry some of the data about what is currently occurring in the pure-play XaaS world with other things that have been proven possible in the traditional tech world. The major breakthrough and the exercise we encourage each company to do is to financially model your XaaS going forward, armed with four weapons from this book:
• A knowledge of what state your XaaS business is in today and what other states remain for you to go through before you become a full-fledged current profit maximizer (CPM).
• A target financial model for each state that is rooted in some reality. The reality will be boxed in by a range of actual industry performance data from one of the sources we mentioned earlier.
• A target financial model exercise that forces you to think through the evolution of your offer portfolio and its accompanying revenue streams as you move from state to state.
• A timeline to journey from your current state to the CPM state that is also based in some reality.

FIGURE 8.6 Gross Margin Trimmed Ranges
The bottom line is that we think XaaS can be a 20% EBITDA (GAAP) business or better. Here is where we begin to model the financial and portfolio journey to get there.
Financial Keys for the Future Value Aggregator
Future value aggregators are focused on demonstrating that they can capture the high volumes of units that will lead to future success. The unit of future value (UFV) can be almost anything:
• Number of visitors
• Number of page views
• Number of subscribers
• Number of logins
• Number of customer logos
• Number of project plans under management
This means the first metric of financial success for FVAs is the raw number of UFVs being acquired and retained over time. They will track how many units they have captured and make those gains the lead in their financial reporting story.
The second slate of financial metrics—and often the more challenging achievement for FVAs—reflects their ability to actually convert the UFVs into paying customers. Are customers willing to pay for the core offer or its premium version? The relevant metric here is monthly recurring revenue (MRR) or annual recurring revenue (ARR). Investors will want to know how much customers are willing to pay for this offer and the dollar amount that grows over time. XaaS companies will also report:
• Number of paying customers
• Average subscription price or average revenue per user (ARPU)
• Monthly recurring revenue/annual recurring revenue
• Churn rate
To optimize the acquisition of these UFVs, the FVA will seek to minimize any friction linked to attracting and retaining them. FVAs will eventually need to prove a business model that acquires new customers in a way that does not break the bank. Customer acquisition costs (CAC) should become a relevant metric early on for most XaaS providers. The financial model of an FVA can collapse under the weight of unwieldy CAC. As we pointed out, there are public XaaS companies running with sales and marketing expenses over 50% of revenue. Some companies have been over 100% at points in their development. Of course, this is not likely to be sustainable in the long term, but the bar for FVA spending is pretty high and forgiving at the present moment.
In summary, here are six metrics that are typically highly correlated to the success story of future value aggregators:
• Growth in units of future value
• Growth in number of paying customers
• Average revenue per user
• Monthly recurring revenue (total recurring revenue from all paying customers)
• Customer acquisition costs (the amount of money spent, on average, to acquire a new customer)
• Churn rate (percentage of paying and non-paying customers who stop subscribing or using the core offer each month)
FVAs will be heavily weighted toward subscription or transaction revenue streams. They will focus very little on monetizing project or annuity services. These revenue streams are more complex to sell and simply slow down the momentum of acquiring units of future value. In this profile, where the focus is on growth, the only revenue stream that is likely to be profitable is the premium annuity subscriptions. Any professional services required to get the customer up and running are likely to be bundled or absorbed into the cost of the subscription. Figure 8.7. models the revenue streams for a XaaS provider in the FVA profile.
This sample model shows a negative operating profit. Many FVAs will run negative operating profits as they invest heavily in sales and marketing, experience lower gross margin on the core subscription offering, and throw services or basic access in for free to secure new customers.
Scanning the industry, we can easily find real-world examples of companies successfully executing the FVA financial profile. To define successful FVAs, we would look for companies that have the following attributes:
• Double- or triple-digit top-line growth in UFVs
• Double- or triple-digit revenue growth (albeit sometimes from a small number)
• High percentage of revenue spent on sales and marketing
• Majority of revenue coming from the core offer
• Quarterly losses
• Company valuations that are typically 10 times (or higher)their annual company revenues

FIGURE 8.7 FVA Revenue Streams (Note: All costs are expressed as a percentage of revenue for that specific line of business/revenue.)
DocuSign is a perfect example of a company that successfully ran the FVA profile claiming over 50 million users and is now pivoting toward the mid-term wedge. They are moving from the value of electronic signatures offered in various fee and free combinations to offering digital transaction management for enterprises. As they make the pivot, they are beginning to offer professional services as well. Founded in 2003 and beginning sales in 2005, 3 DocuSign has spent the better part of a decade in FVA mode. They have raised more than $400 million 4 to help subsidize the operations in those years and lay the foundation for a profitable wedge model.
LinkedIn is another interesting example of an FVA that is moving toward an MTW player. The company exhibits all of the classic attributes. They grew members from 20 million in 2006 to 400 million by 2015. 5 The company has been growing revenues at a double-digit pace and has exceeded $2 billion. However, most of that revenue is not coming from the 400 million people they aggregated, most of whom take advantage of free membership. The company has learned to monetize its units of value (members) by offering talent solutions to corporate HR departments and advertising solutions to marketers. This is in addition to its premium subscription offers to members. The company has been profitable on a GAAP basis, but only marginally (it publishes a non-GAAP EBITDA calculation that reflects much more favorable profits). Even after 10 years in the market, the company is still spending almost 37% of revenue on sales and marketing. We would expect it to begin to show the GAAP profit power of its model soon, but it may come at the same time as revenue growth slows. We got a taste of the market’s reaction to that in early 2016, when LinkedIn’s stock dropped 40% in value because the company revised growth guidance down to “only” 20% to 30%.The company’s market capitalization dropped from $25 billion to $13 billion, from a 10-times multiple of revenue to a 4.5-times multiple. This is a classic case of the challenge that FVAs face as revenues slow, and they must begin to transition their stock valuations from high growth to solid growth plus profits.
Financial Keys for the Mid-Term Wedge
XaaS providers that have been aggregating paying customers and believe they can now turn the business model toward profitability have a longer set of financial metrics to manage. In the midterm wedge profile (MTW), subscription growth and MRR are still critical metrics. However, companies in the MTW profile must now also focus on costs. Are the costs to acquire new customers (CAC) and to serve existing customers (COGs) coming under control? Is the company expanding and renewing customers (CEC, CRC) in the most cost-effective way possible? Simple churn rate metrics get replaced by more sophisticated measures. In addition, the MTW must pay close attention to commoditization and discounting. Some of the basic numbers reported by FVAs may actually drop below the radar as the company becomes larger and these more sophisticated metrics take precedence. Pulling these thoughts together, there are nine financial metrics the MTW should watch and improve:
• Monthly Recurring Revenue (MRR). Average amount of money a customer is spending with the company.
• Customer Acquisition Costs (CAC). The amount of money spent, on average, to acquire a new customer.
• Unit Renewal Rate (URR). The percentage of customers that are renewing their subscriptions.
• Contract Value Renewal Rate (CVRR). When renewal contracts come up each month, does that pool of customers spend more or less money with the company? Ideally, CVRR is over 100%.When CVRR is below 100%, customers may be churning or customers may be securing discounts during renewal.
• Discount Rate on New and Renewal Deals. If discount rates are high, it is a sure sign the offer is commoditizing.
• Technology Subscription COGs. The percentage of subscription revenues spent on the technology and support related to delivering the offer.
• Annuity and Project Revenue COGs. The percentage of annuity and project revenues that are spent to deliver those services. In the FVA profile, these services may have been free or break-even. Now, these revenue streams should be achieving at least industry average gross margins.
• Cost to Renew Customers (CRC). What percentage of sales and marketing dollars is spent on the process of renewing customers? If this percentage is high, it will be difficult to tamp down overall S&M spending.
• Cost to Expand Customers (CEC). What percentage of sales and marketing dollars is spent on securing incremental revenue from existing customers? The cost to secure expansion revenues should be much lower than the cost to secure revenue from a new customer. If this is not true, it will again be difficult to tamp down overall sales and marketing expenditures.
MTWs are still heavily weighted toward technology subscription revenues. Yet, they should now be diversifying. That could come in the form of multiple core offers, but they may also begin offering project and annuity services that create the following financial benefits:
• Bring incremental revenue and higher-margin dollars into the financial model
• Help reduce the cost of renewing customers (CRC) by delivering fee-based services that drive adoption and stickiness
• Become a cost-effective channel for identifying expand selling opportunities (reduce CEC costs)
There are likely to be three revenue streams in play for the MTW, at least in enterprise markets: the technology subscription, premium annuity services, and fee-based, project-based professional services. In this profile, where the focus is turning toward profitability, all three revenue streams should be profitable or close to reaching profitability. Also, a slightly greater percentage of revenue will be coming from the annuity and project services. Figure 8.8. models these three revenue streams for a XaaS provider that has crossed the line into profitability.

FIGURE 8.8 MTW Revenue Streams (Note: All costs are expressed as a percentage of revenue for that specific line of business/revenue.)
This sample model shows a positive operating profit of 2.5%. We would expect MTWs to be running quarterly operating profits anywhere from negative 10% to positive 10% as they approach and pass the profit horizon. We would also expect a year or two where the MTWs have operating profits that bounce from positive to negative, quarter to quarter, as they dial-in the operating model.
To identify real-world mid-term wedge examples, we would look for companies that have the following attributes:
• Healthy top-line revenue growth, but it may be slowing
• Slowly trending toward spending less money on sales and marketing as a percentage of total revenue
• Slow but steady improvement in gross margins as scale is reached
• Positive and stabilizing trend in operating income (whether or not it is currently profitable)
• Majority of revenue still coming from a core offer (subscriptions or transactions) but growing a diversified portfolio
• Company valuations are typically 5 to 10 times (or higher) annual company revenues
Workday is a MTW SaaS company that is beginning to exhibit these trends. Figure 8.9. documents the incredible revenue growth rate of Workday, which has been hovering between the 60% to 75% range. It also documents the high spend on sales and marketing, which is fortunately stabilizing, and the double-digit negative (but improving) operating income quarter after quarter. In early 2016, Workday was sporting a market capitalization that was 11 times annual revenues! Impressive. But, alas, the journey from FVA to MTW has also impacted Workday and its stock price. As the company begins to signal a slower growth outlook and GAAP losses alternate between improvement and decline, the market is reacting by shaving its valuation premium.
No conversation about the MTW is complete without a discussion of Salesforce. Everyone in the industry seems to be waiting for them to hit the profit inflection point. Would it be at revenues of $500 million? $1 billion? $5 billion? Will it be at $10 billion?

FIGURE 8.9 Workday Financial Performance
There is no doubt that Salesforce could be very profitable on a GAAP basis when and if they need to. They just have to turn the sales and marketing dial a bit to the left. But their stock is doing just fine, so the pressure to demonstrate profits is tolerable. They will orient toward growth and market share through high sales costs for as long as they can. But they are clearly messaging that they are making preparations to demonstrate strong profitability. The recent analyst briefings have them on record as saying they are going to take a more balanced approach to financial management. They are the epitome of an MTW sitting on the edge of the profit inflection point, waiting to be pushed into green territory. In early 2016, they had a market cap of around 9 times annual revenue.
Financial Keys for the Current Profit Maximizer
As we mentioned, most large enterprise tech companies that have established a history of producing rich margins are finding it hard to convince profit- and dividend-oriented investors that unprofitable XaaS offerings, even if they are growing rapidly, are a good thing for business. Take this quote from a Forbes article titled “Why the 10% Drop in Software Sales Is the Most Important Number in IBM’s Q2 Earnings Report” 6 as an example of market reaction to the fish model:
“We are concerned that IBM’s software business may see increasing pressure from the transition to a SaaS business model,” wrote Jefferies equity analyst James Kisner. “Recall, Oracle ORCL +0.00% reported very light license revenues driven largely by an accelerating transition to cloud (SaaS).”
Meanwhile, Credit Suisse’s Kulbinder Garcha last week reiterated an underperform rating in part because software revenue would need to come in above trend to boost earnings above consensus, something he sees as highly unlikely. He added, “Following a thorough analysis of their cloud, we believe it may ultimately be margin dilutive for IBM, even if the company drives revenue.”
Established technology providers are being forced to optimize XaaS business models as rapidly as possible. When pursuing this current profit maximizer (CPM) profile, management teams must immediately focus on the financial metrics that predicate a profitable XaaS business model. Many of these are the same exact metrics that are critical in the MTW profile:
• Average monthly recurring revenue (AMRR)
• Customer acquisition costs (CAC)
• Unit renewal rate (URR)
• Contract value renewal rate (CVRR)
• Discount rate
• Technology subscription COGs
• Annuity and project revenue COGs
• Cost to renew customers (CRC)
• Cost to expand customers (CEC)
However, the CPM have additional financial focal points:
• Revenue mix
• Revenue line profitability
• Upsell rates and COS
• Cross-sell rates and COS
• Focused R&D and G&A expense targets
• Platform investments eating away at sales, service, and G&A labor costs
Out of the gate, most CPMs should be adept at monetizing additional revenue streams beyond the core technology subscription offers. This includes all the new types of value-added services we identified in Chapter 6 . Ideally, they would have healthy revenue in most if not all of the revenue streams we identified at the beginning of this chapter:
1. Annuity Revenues. The customer pays for the service in an annual or multiyear service contract.
2. Project Revenues. The customer pays for the service on a project-by-project basis.
3. Transaction Revenues. The customer pays every time they execute a specific activity, such as processing a report or submitting an inventory.
In addition, these companies should have become very proficient at getting sales costs under control. As we have often pointed out, one key to doing that is having a healthy balance of growth coming from adding new customers at a high CAC while strongly expanding existing customers at a much smaller sales cost (CEC). Combined with a high renewal-rate revenue stream at a low sales cost (CRC), the company’s overall COS drops to a manageable 20% to 30%. We are not saying that all XaaS companies at this level will have COS of 30% or less. Some companies may choose to continue to spend lavishly on CAC to perpetuate their land grab, thus driving overall COS up. What we are saying is that it is POSSIBLE for a XaaS company at this level to balance very respectable growth rates with very manageable overall sales costs.
Figure 8.10 models the optimized economic engine of a profitable CPM that has established multiple revenue streams.
As shown in this figure, even though the core technology subscription is only generating an OI of 9.8%, the overall economic engine is generating an excellent operating profit of 20.2%.
There are examples of companies that are leveraging multiple revenue streams to maximize the profitability of their XaaS offer or to manage their swallowing of the fish. These companies are working hard to remain profitable through this significant industry transition. The telling attributes of the CPM profile would include:
• Still solid but not spectacular growth in revenues.
• Profitable growth in fee-based annuity and project revenue streams.
• Operating incomes that remain positive quarter to quarter.
• Company valuations that are typically a multiple of 3 to 10 times (or higher) annual company revenues.

FIGURE 8.10 CPM Revenue Streams (Note: All costs are expressed as a percentage of revenue for that specific line of business/revenue.)
The first example of a CPM is Veeva Systems, a company specializing in SaaS applications for the global life sciences industry. There are plenty of SaaS companies with annual revenues north of $500 million but still with negative operating incomes. Veeva is bucking that trend. With annual revenues half that amount, the company is solidly profitable. In the second quarter of 2015, the company generated an operating income of 23%. More importantly, the company is generating over 20% of revenues from value-added services at a margin of 24%. Service offerings listed on the Veeva website include: 7
• Transformation Consulting
• Professional Services
• Managed Services
• Environment Management as a Service
• Veeva Code-Based Custom Development
• Administrator Training
In early 2016 Veeva had a market cap of around 8 times annual revenue.
The company went public in 2011 with 33% of revenues coming from fee-based services as a critical source of revenue and some margin. By 2015, services was generating almost $20 million a year in margin. Figure 8.11. documents the financial performance forVeeva from 2013 through 2015.As can be seen, unlike many SaaS companies, Veeva has doubled operating income dollars while growing revenues from $129 million to more than $300 million.
Perhaps one of the more instructive examples of companies pivoting from selling technology as an asset to selling technology as a service is the Canada-based software company OpenText. A public company since 1996 and with revenues now over $1 billion, this company is an established software provider. OpenText has embraced a philosophy of allowing customers to consume technology the way they want to consume technology. If OpenText customers want to continue to purchase software licenses, they can. If customers want to migrate to subscription pricing, they can. If customers want OpenText to provide their software as a managed service where OpenText manages the software on the customer’s site, that is an option as well. This philosophy has led to a diversified economic engine. Here are notes from the company’s 2015 annual report:
During fiscal 2015 we saw the following activity:
• Total revenue was $1,851.9 million, up 14.0% over the prior fiscal year.
• Total recurring revenue was $1,557.7 million, up 18.1% over the prior fiscal year.
• Cloud services and subscription revenue was $605.3 million, up 62.1% over the prior fiscal year.
• License revenue was $294.3 million, down 3.8% over the prior fiscal year.
• GAAP-based gross margin was 67.5% compared to 68.5% in the prior fiscal year.
• GAAP-based operating margin was 18.8% compared to 18.5% in the prior fiscal year.
• Non-GAAP-based operating margin was 30.9%, stable year over year.
• Operating cash flow was $523.0 million, up 25.4% from the prior fiscal year.
• Cash and cash equivalents was $700.0 million as of June 30, 2015, compared to $427.9 million as of June 30, 2014.

FIGURE 8.11 Veeva Financial Performance
License revenue is shrinking and represents less than 16% of total company revenues. Technology subscription revenues are growing rapidly and now represent 33% of total company revenue. Total recurring revenues, which include multiyear managed services and support services contracts, now represent 84% of company revenue. Most importantly, the company has remained profitable throughout this transition in revenue mix.
In early 2016, OpenText had a market cap of around 3 times annual revenue.
Rackspace is another MTW that has proven profitability. Before they got caught up in a price war led by AWS, the company gener ated an operating income as high as 29% by focusing on “fanatical support.” Perhaps this is a proof point that differentiated services can help unlock higher profits. In fact, one of the company’s newest tactics to battle against AWS’s aggressive price-cutting onslaught is to refocus its offers and messaging to “Managed Cloud.” The lead paragraph on their website in February 2016 read:
“Experience our highly specialized expertise and best-in-class service across the world’s leading infrastructure technologies, databases, and applications.”
They position the technology second and their expert services first.
As we made clear in Chapter 5 , Adobe is one of our favorite examples of a traditional license software company that has transitioned to a profitable subscription business model. By May 2013, Adobe was no longer licensing its popular Creative Suite software. Customers could only consume the software through a subscription. 8 A majority of Adobe revenues are secured through the technology subscription. As of 2014, only 11% of Adobe revenues were related to any type of value-added services. The company has proven they can live on the profitable side of the wedge model—but barely. As shown in Figure 8.12 , the transition from a big license engine to a big technology subscription engine has resulted in almost halving the operating income of the company. There is a lesson to be had here that we will explore more in the chapter on churn, costs, and commoditization.
In early 2016, Adobe had a market cap of around 9 times annual revenue.
But the one example that everyone loves to talk about most right now is Amazon Web Services. More than any other company we know of, they have successfully passed through all three phases in a remarkably short period of just 10 years.

FIGURE 8.12 Adobe Financial Performance Since Migrating to Subscription Pricing
Although the company has just recently started to break out the financial profile of this business unit, Amazon is reporting the following financial statistics: 9
• AWS is generating $2 billion in quarterly revenues.
• AWS revenues are growing at 78%.
• AWS is generating 25% operating income.
The AWS offering is incredibly service light from a revenue standpoint. We think this is a risky move for most companies. Betting the farm on features or scale alone can work, but is not often sustainable. For every Google search business, there are dozens of troubled XaaS companies that were driven into the ground by lower-priced or better-featured competitors. For AWS, revenue and profits are generated through a big technology transaction gear of renting computing cycles at very low rates. Their strategy is based on portfolio diversification. As their capabilities grow, customers expand their average MRR. For this wedge model to be so profitable, it is clear that Amazon must keep S&M and G& A expenses in check. It must also ensure that revenues are growing faster than COGS.
Because AWS is part of Amazon, we cannot place a specific stock value on it. However, many analysts speculate it to be worth more than $100 billion, which would give it a market cap of around 13 times annual revenue.
By comparison to these great XaaS company examples, in early 2016 most of the large, traditional enterprise hardware and systems companies were trading at around 1 times revenue. Most traditional enterprise software companies were trading at revenue multiples in the 2 to 3 times range. For those companies, it is easy to see why getting through the fish and potentially achieving multiples of 5 times or 8 times is of extreme interest to management and boards of directors alike. That is why we wrote this book—to gather up our reading of the tea leaves (and the data)—to begin formulating some road maps for the journey. Some road maps are for traditional companies moving into the subscription economy, and others are for companies born in the cloud era that need to begin pivoting their story from remarkable revenue growth to profits and solid growth.
Profile Traps
The other thing we are learning on these journeys is that there is real potential for XaaS offers to fall into traps in these three profiles. This is going to be especially dangerous if financial markets become more conservative. There are scenarios where actual company performance does not align to the strategy keys of the profit horizon. There are three very recognizable scenarios of disconnect:
1. FVAs that are spending like a drunken sailor on acquiring units of future value, but have no effective strategy to monetize them.
2. MTWs that have accumulated a large mass of paying customers but are not yet demonstrating improving economies of scale or efficiency, especially in sales and marketing.
3. CPMs that need current profits but are afraid to make some of the hard decisions to rapidly build scale by forcing customers onto their platforms, charging profitable prices, or diversifying their revenue mix.
What is the consequence of these mismatches? For public companies, the price will be paid in the company valuation. Just look at cloud storage and file sharing provider Box. Their valuation began a descent before their IPO and it has continued. We would argue they did not manage effectively from FVA to MTW.
The bottom line is this: There are specific management and financial objectives for each phase in the profit horizon journey. Start-up XaaS providers need to understand—if they are on an FVA or MTW profit horizon—what their financial keys are and what time frames they will accomplish them in. Legacy technology companies need to transition to XaaS on a path that accelerates them quickly into CPMs. We strongly believe aligning your XaaS strategy decisions with the profile you are attempting to execute increases your ability to improve shareholder value.
Timeline Planning
The notion of the three states of XaaS offers (FVA/FPI, MTW, CPM) is especially helpful as you think through the number of years in your financial transformation journey. Central to this part of the exercise is seen in Figure 8.13.
Although there are certainly some exceptions, the companies we have studied seem to spend a predictable range of years in each of these three states of management focus. The left column represents the shortest amount of time we have seen anyone in each state. The right column represents the longest. The “+” sign means that some companies never seem to get out of the FVA state. We predict these companies will flame out when the financial markets turn bearish.

FIGURE 8.13 Financial Transformation Journey
There are three important uses of this chart. The first is to help you predict how long your journey may be from your current state to achieving your end state of more than 20% GAAP EBITDA. You simply identify what state you think you are in today and make a decision about whether you plan to run through the remaining states quickly (left column values) or if it will require more time (right-hand column values). For each year of your journey, your goal would be to complete the revenue mix and margin exercisey shown in Figure 8.14. You should be able to explain why you think you are moving through states at a fast pace or a slow one.
Once this exercise has been completed for each year in your projected journey to 20% EBITDA, anyone in the company will be able to quickly see both the financial and the portfolio journey you need to pursue. You can then apply these ratios to your revenue projections to begin to compute actual dollar profits and losses along the way. This may be helpful in assessing the total capital required to get to the profit horizon event.
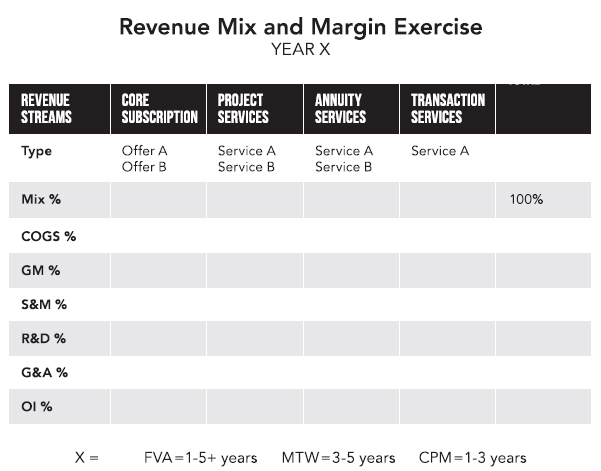
FIGURE 8.14 Revenue Mix and Margin Exercise
The second great use is to benchmark your current financial performance against our target states. If you look different, why is that? Are your costs lower in some areas and higher in others? Is your portfolio diversifying as the company changes states and approaches new targets? These financial models are by no means the only way to be a successful XaaS business, but they do seem to be characteristic of many we see.
Finally, if you are a traditional tech company, you can use this model to determine your point of entry into the XaaS market. As we have emphasized, we think these companies are smart to consider entering at scale in a CPM state. If managed correctly, they can use their huge scale to skip the FVA/FPI state and maybe even the MTW state. By forcing all their customers onto the XaaS offer, they can literally enter the market as a CPM and achieve GAAP profits in their first or second year.
XaaS Playbook Plays
Two plays that help a management team answer the question, “Can we make money with this XaaS offer?” are identified in this chapter:
Play : Identify Your Target Financial Metrics
Objective : Identify the metrics that will be used to determine if the company is on track to meet its business model objectives.
Benefits:
• Prioritizes critical metrics to track.
• Provides talk track for both employees and investors regarding how the company is defining success.
Players (who runs this play?) : Core players: CFO, CEO, and board. Review team: board.
Play : Model Your XaaS Profitable Economic Engine
Objective : Identify the specific revenue streams the company intends to monetize. Identify the mix and margin expectations for each revenue stream. Determine the number of years in your journey to target GAAP profitability.
Benefits:
• Identifies the target financial model for the company.
• Identifies investment requirements.
• Set expectations on target margins for each revenue stream.
Players (who runs this play?) : Core players: CEO, CFO, product development, services, marketing. Review team: CEO, CFO, board.
9
This book is about conducting successful XaaS offers. For companies that have been selling technology as an asset, the pivot to selling technology as a service can be overwhelming. The many things to consider and worry about can make this seem like a bridge too far. But a first step that traditional technology companies can take on this journey to help them ease into the XaaS marketplace is to stand up a managed services capability.
In this chapter, we’ll explore the special case of managed services (MS) as entrée into XaaS. For the past several years, we have been aggressively studying and benchmarking how enterprise tech companies of all sorts are incubating and growing MS businesses. So, let’s discuss the pros and woes of how, why, and when to build your MS offer. Specifically, we will cover the following ground:
• The explosion of managed service revenues.
• Trends driving managed services.
• The many flavors of managed services.
• Why product companies fear managed services.
• Why companies should embrace managed service opportunities.
• Success tactics when incubating managed service capabilities.
By the end of this chapter, management teams should clearly understand why managed services is the fastest growing service line in the technology industry and why this opportunity shouldn’t be ignored.
The Explosion of Managed Services
We benchmark the overall revenue mix of technology companies at a level of detail not available in the standard 10-K. One of our objectives with this data is to clearly understand how the economic engines of technology companies are changing over time. MS revenues have been present in the industry for years. In 2013, our data showed that 23% of the companies we benchmarked had some type of MS revenue stream. By the end of 2015, 46% of companies were reporting an MS revenue stream. That is a doubling of MS offers in just two years.
Not only are more companies jumping into MS, but MS is also starting to become meaningful revenue. The average revenue mix for companies that benchmark their managed services business with TSIA indicates that MS has blossomed to 12% of total company revenues, as seen in Figure 9.1.
More importantly, the average annual growth rate of these MS revenues exceeds 30%. This growth rate is far outpacing the average growth rate for product revenues we see in the industry today. In our last T&S 50 snapshot of 2015, product revenues, on average, were shrinking 8%! (See Figure 9.2. )
Finally, MS revenue streams are proving more and more profitable. The TSIA MS benchmark reports average MS gross margins greater than 40%. Some MS providers are generating gross margins just slightly south of 70%. In our annual survey on overall organizational structure, we ask technology companies to simply report the general profitability profile of every service line they have, the results of which are seen in Figure 9.3. For the past two years, MS has been reported as the second most profitable service activity, right after highly lucrative support services.
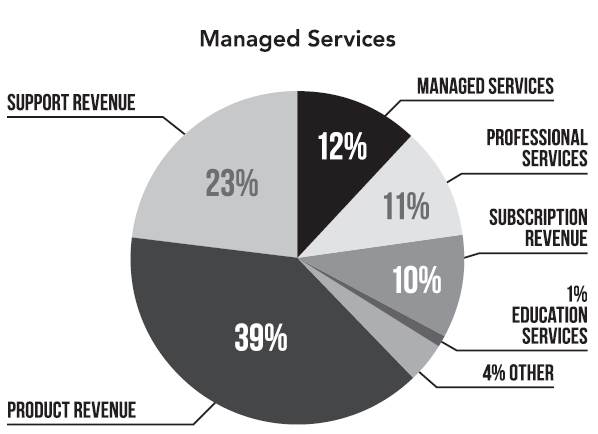
FIGURE 9.1 Revenue Mix for Companies that Benchmark MS

FIGURE 9.2 MS Revenue Annual Growth Rate
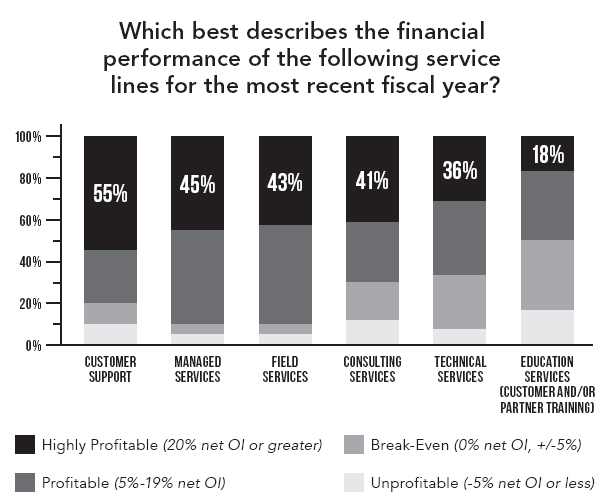
FIGURE 9.3 Profitability of Service Lines
So, MS is undoubtedly a rising star in the economic engine of technology companies. But why?
Trends Driving Managed Services
Multiple trends are driving the demand for managed services. Many of these trends were heavily discussed in our last two books, but let’s do a quick review:
• Reducing Operational Complexity. Customers no longer want the headaches of running IT operations, especially if they don’t view this as a core competency of the company.
• On-Demand Capacity. Customers don’t want to pay for IT capacity they don’t need. MS models are much more flexible and allow the customer to buy capacity as required.
• OpEx versus CapEx. Some customers (clearly not all) have a preference for spending operating dollars and not capital dollars when it comes to technology. CapEx leads to having big, lump-sum payments and then owning assets that must be depreciated over time. Migrating IT expenses to OpEx typically leads to smoother, more predictable expenses over time.
• Value Beyond Technology. Customers look for technology providers to apply unique insights to help maximize the business impact of technology. One common value proposition is MS offers that feature accelerated technology adoption versus do-it-yourself tech.
• Economies of Scale. Technology providers can create environments, tools, and processes that support multiple customers. These economies should allow providers to deliver technology environments more cost effectively than customers can create as a one-off.
• Strategic versus Tactical. CIO magazine published an article citing the growing demand for managed services. The magazine reported that CIOs are interested in leveraging outside vendors to manage day-to-day operations so internal IT staff can focus on strategic initiatives. 1
Generically, TSIA sees these trends resulting in five common MS offering value propositions, listed below and shown in Figure 9.4.
• Monitor. Monitor technology availability and performance for the customer.
• Operate. Operate the technical environment on behalf of the customer.
• Optimize. Work with the customer to optimize technology costs, improve technology adoption, and maximize the business impact of the technology.
• Transform. Help the customer implement and integrate a new set of technology capabilities.
• Managed XaaS. Technology may be on site, hosted, or a hybrid of the two. The solution is typically comprised of product (hardware and/or software), professional services, support, and operations elements bundled into a single per-unit, per-month price governed by a managed services agreement. Hardware and/or software is owned by the managed service provider.
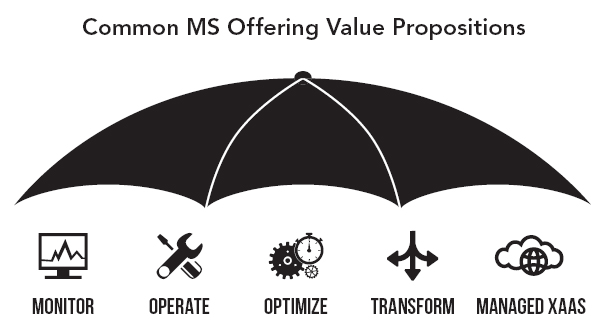
FIGURE 9.4 Common MS Offering Value Propositions
Importantly, current and future generations of MS don’t look anything like the low-margin outsourcing businesses of the past. Ideally, services are cloud-enabled, delivered from a remote network operations center. Delivery resources are typically shared across multiple clients. The product elements within the MS offer may be hosted and/or on premises; they may be single tenant or multi-tenant.
In September 2015, Forbes cited a study that more than half of IT managers expect to use multiple managed service providers (MSPs) within the next two years; a whopping 85% are at least somewhat likely to use MSPs. 2
So, if you have a customer who is demanding one of the MS value propositions previously cited and you don’t have an offer, you may lose that customer. How many customers can you afford to lose until you bring an MS offer to market that the market clearly wants?
The Many Flavors of Managed Services
Before you decide whether your company should pursue an MS business, it is important to segment the different types of MS businesses. TSIA segments MS offers based on the following five questions:
1. Is the offer standard across many customers or unique for each customer (as defined in Chapter 6 on portfolio power)?
2. Is the value proposition differentiated (again, referring to Chapter 6 )?
3. Regardless, whether the technology is on site or not, can the services be delivered off site (virtually)?
4. What are the specific value propositions of the offer as defined by TSIA’s five classic value propositions for MS offers?
5. Does the MS provider own the technology assets under management, or does the customer own the assets?
So, let’s map two different example offers:
1. Off-Site Monitoring. The customer would like you to monitor technology that’s been purchased from your company. You have unique capabilities to deliver this monitoring remotely.
2. On-Site Operation. The customer wants the technology to be present on their site, but they don’t want to manage the environment. You need to provide some onsite services to manage their environment. Also, they do not want to own the technology.
Figure 9.5 maps these two offerings on our offering grid. The grid has been further segmented to show whether an offer is being delivered on site or off site. A solid line around the offer means the MSP owns the technology assets. A dotted line around the offer means the customer owns the technology assets.
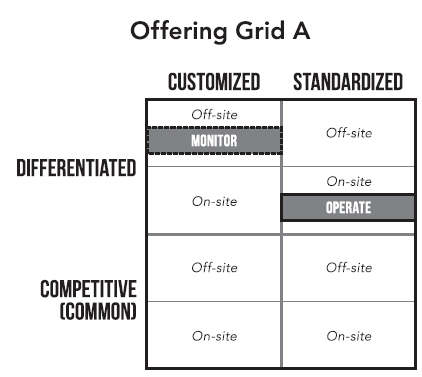
FIGURE 9.5 Offering Grid A
The question quickly becomes, “What are the high-growth and profitable MS offers?” This is exactly what we have been studying since 2013. There is no doubt that standard, off-site offers, where the customer owns the asset, have the greatest potential to drive the highest MS margins with the least financial risk to the provider (Figure 9.6. ).

FIGURE 9.6 Offering Grid B
Breaking our benchmark data down into more detail, here are the highest-to-lowest margin MS offer types:
• Customer premised, customer owned, remotely monitored.
• Customer premised, customer owned, remotely operated.
• Hosted, customer owned, remotely monitored.
• Hosted, customer owned, remotely operated.
• Hosted, provider owned and operated.
Also, the data clearly shows that standard offers are more profitable than custom offers. On average, there is a nine-point profit improvement if an MS offer can be standardized across customers.
Unfortunately, we see that customers often start MS conversations with a host of custom requests. In fact, many of these offers are actually created “in the field” to meet the needs of specific deals. That is not the right way to approach your MS business. Instead, it reflects a common scenario where headquarters are hesitant about launching an MS business when their customers clearly want it. So, rather than lose the deal and the customer, sales makes one up. In some of these early deals, customers are often interested in the provider owning the assets.
Here’s a better way: To accommodate early customer requests, successful MSPs are making three moves on the offer chessboard, listed here and seen in Figure 9.7.
• First Move. Work with strategic customers to define a differentiated MS offer. You can lean toward customers owning the assets, but you may need to be flexible. Perhaps you can arrange for a third party to carry the paper on the assets while you provide the managed service. Begin signing MS contracts.
• Second Move. Begin identifying the common building blocks of customer needs. Create a “standard” set of LEGO® building-block MS capabilities customers can string together into an offer that meets their needs.
• Third Move. Maximize every opportunity to leverage technology and off-site labor to deliver the offer.

FIGURE 9.7 Offering Grid C
So far, we have talked abot the compelling and special case of MS in the enterprise tech business circa 2016. We have helped define the drivers for MS offers. We have also helped define the different types of MS offers and how technology providers are successfully maturing their MS offers. Despite this help that we regularly offer to members, though, we still see many traditional product companies incredibly resistant to exploring MS conversations with eager customers. Why?
Why Product-Centric Companies Say No to Managed Services
George Humphrey vice president of research for the Managed Services practice at TSIA, refers to this dilemma as “the battle of the CFOs.” In one corner, we have the customer CFO. In their role, they are keen to acquire some of the benefits listed earlier—reduced operational costs, predictable IT costs, and improved ROI from technology investments. In the other corner sits the technology provider CFO. Their role is to protect the financial business model. They are extremely reticent to sign off on any offers that may increase company risk, reduce cash flow, or impact the margin profile of the company. The customer is asking for managed services, but the CFO and other executives at your company are quick to raise the following concerns:
• We don’t own customer assets. When negotiating MS deals, customers may not want to purchase the technology assets being managed. This means the provider has to carry the cost of these assets on their books. CFOs may be loath to reflect lower retained earnings on the balance sheet as a result of these added costs.
• Delayed revenue recognition. If the customer is not paying for the assets up front, that means the revenue for this technology will trickle in as part of a long-term service contract. Not ideal! We are a product company—we recognize product revenue, and we recognize it as soon as legally possible!
• Service revenue intensive. These MS deals are going to increase service revenues and decrease product revenues. Our financial model indicates how much revenue should be coming from products versus services. We will start looking like a services company to the street—which is not what we historically said we were.
• Increased risk. When we sell technology assets, the customer is ultimately responsible for achieving their target business results. With these MS contracts, we are taking on increased responsibilities. We are introducing new risks to the business. We may fail to meet contract SLAs and pay penalty clauses. The customer may be dissatisfied and cancel halfway through the contract. We might make an error in the customer environment and be sued.
• Channel conflict. Other executives beyond the CFO and CEO will start chiming in with their concerns. The executive who owns channel partners will be concerned that new MS offers conflict with partner offers. “We are stealing the bread from our partners’ mouths. They will jump to selling the product of our competitors.”
• Complex sales cycle. The sales executive may have concerns about the ability of sales reps to sell these complex MS offers. Also, by introducing an MS option, the customer selling cycle will most likely elongate—which is death to a sales force driven to close deals as quickly as possible and collect the cash.
• Smells like outsourcing. In the end, isn’t MS really just another word for outsourcing? And isn’t outsourcing one of the lowest-margin businesses in the technology industry?
The concerns and objections mount among executives, so there may be many reasons not to pursue this business. Yet, our point of view is that product companies should absolutely be pursuing MS opportunities when strategic customers begin knocking on the door for these services.
Just Say Yes
Despite the concerns listed here, we believe product companies should aggressively assess their opportunity to provide managed services for the following five reasons:
1. There is a compelling market opportunity for managed services.
2. Managed services is not IT outsourcing.
3. Managed services is an effective short-term defense against new XaaS competitors.
4. MS offers force the creation of new capabilities required to compete in the XaaS economy.
5. You could lose customer, after customer, after customer.
As cited previously in this book, market research firm Gartner signaled that worldwide IT spending was actually shrinking by 5.5% in 2015. 3 This opinion correlates with what we see in our T&S 50 data as we track the largest providers of technology solutions on the planet. Yet, the managed services market opportunity is exploding. Research firm MarketsandMarkets forecasts that the managed services market will grow from $107.17 billion in 2014 to $193.34 billion by 2019, at a compound annual growth rate of 12.5%. 4 For technology companies looking for growth, managed services becomes a compelling market opportunity.
Today’s MS offers are not like yesterday’s outsourcing offers. The traditional value proposition of IT outsourcing was simple: your mess for less. Outsourcers focused on cost reduction. As outsourcing became more competitive, margins for outsource providers eroded. But today’s MS offers from product companies are anchored on unique capabilities designed to unlock the full potential of a technology solution. Benefits go beyond cost reduction into other areas, such as revenue growth and risk reduction. Also, MS offers can be much more targeted to specific technologies or problem sets. Product companies are not asking to take over the entire IT operation for a customer. We are seeing an explosion of product companies wrapping a managed XaaS offer around their core products. This offer is creating differentiation in the marketplace when contrasted with product companies that are only interested in selling a product to the customer and then leaving. With your MS offer, you create value far beyond commoditized technical features by reducing total operational complexity.
When it comes to financial concerns about asset risk and revenue recognition, many manufacturers successfully use thirdparty financing to give customers more of the OpEx price model they crave without all the negative baggage. It helps them:
1. Minimize the financial risk of carrying infrastructure costs on their books. This tends to affect valuation for traditional companies.
2. Get immediate revenue recognition on the product portion of the deal.
Be aware, though, that many financial auditing firms will tell you that you still have to recognize the revenue on the product over the duration of the service contract because the “value” of the product is directly linked to and inseparable from the value of the service. Service providers, VARs, and system integrators don’t want the financial risk and burden of carrying all those assets on their books.
Cloud providers are somewhat exempt from all of this because, from day one, they embrace this business model. They know all revenue is recognized over the duration of the contract. They know there are inevitable costs of service that are asset and infrastructure based. Cloud investors also understand this. Manufacturer investors don’t.
In the book Zone to Win, 5 our friend Geoffrey Moore discusses the importance of playing defense during significant market transformations. When entrenched market leaders are threatened by new offer types that disrupt the status quo, the recommendation is to respond with offers that slow competitive disruption. These “neutralization” offers don’t have to go toe-to-toe against the new competitors. These defensive offers simply need to provide some new options to existing customers that may delay their choice to jump to the competitive offers. MS offers for entrenched product companies are a classic example of a neutralization offer. A large and strategic customer that previously purchased technology assets from you is now asking for a XaaS option. You meet them halfway with a special MS offer. The MS contract keeps the customer on your books and creates runway for you to develop a XaaS offer.
Finally, establishing MS offers is a forcing function for developing new organizational capabilities that will be required to compete in the XaaS economy. In our work at TSIA, we define and track “organizational capabilities.” We define organizational capabilities as “the ability to perform actions that achieve desired results.” We organize the capabilities into the nine categories shown in Figure 9.8.
In each of these categories, there are capabilities that organizations must master in order to scale and optimize their MS business. As previously mentioned, taking on MS deals typically requires product companies to develop new organizational capabilities. As an example, sales and finance must collaborate on new pricing, revenue recognition, and compensation models. Delivering MS offers will require the services organization to build capabilities related to monitoring customer environments, driving adoption, and helping customers optimize costs. Overall, we have identified more than 100 capabilities required to master a managed services business but are relatively immature in most product companies. Figure 9.9. provides a sampling of these emerging capabilities.

FIGURE 9.8 Organizational Capabilities Categories
Ideally, you would build out all the capabilities in our capabilities inventory before you take on your first MS customer. But more typically, by piloting new MS offers, product companies begin the journey of developing these new capabilities. All of these emerging capabilities will serve a product company well as customers pull them into the new XaaS economy.

FIGURE 9.9 Example Emerging Capabilities Required for MS
Picking the Right Customers
Although we are encouraging product companies to aggressively pursue emerging MS opportunities, we do not believe all opportunities are created equally. One of the significant concerns executives have regarding the additional risk being assumed in MS deals can be summarized in one sentence: “What if the customer doesn’t do what they need to do to achieve the target outcomes of the MS contract?”
This is a real concern and a healthy question to ask. The intuition is to solve this challenge contractually—to design contracts that hold customers accountable to deliver their end of the deal. When you look into the technology industry today, you’ll find two common types of service contracts: (1) contracts crafted by technology providers that are centered on meeting service level agreements, and (2) contracts crafted by system integrators that cover large, complex technology implementations. Figure 9.10. captures these two contract examples.

FIGURE 9.10 Common Service Contract Types
The purposes of these two contract types are different. SLAbased contracts are designed to meet customer expectations regarding technology availability. From the provider’s perspective, these contracts minimize risk when technology goes down if the provider has been meeting all of their SLAs. Product companies are very familiar and comfortable with these types of contracts. SI contracts centered on detailed terms and conditions are designed to minimize risk if an implementation project fails. As shown in Figure 9.11 , neither of these contract types really fit the bill for creating a contract that is designed to create an MS partnership with the customer to achieve targeted business outcomes.
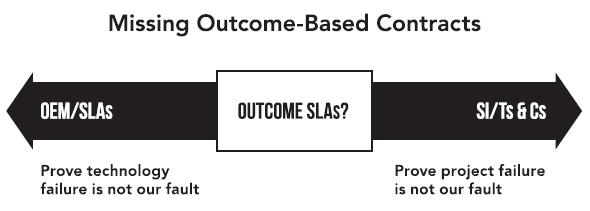
FIGURE 9.11 Missing Outcome-Based Contracts
When first exploring MS contracts that are designed to achieve specific business outcomes, we believe that attempting to craft a detailed contract that will drive customers to execute their side of the activities is not time well spent. Successful managed service relationships are not achieved through contracts. Initial MS success will be achieved by working with the right customers.
The recommended tactic when incubating MS is to identify the attributes required in a customer to make them a viable candidate for an MS offer. There are at least four attributes we believe a provider should test for before attempting an MS relationship with a customer:
1. Do senior customer executives view you as a strategic provider? If you spend your time with procurement or mid-level IT managers, it is not likely you will be able to influence the customer to execute the practices required to achieve a target outcome. Even worse, great progress and measurable results may not lead to increased customer spending.
2. Does the customer have a history of listening to your recommendations? If not, an MS relationship is high risk. Why will they start listening now?
3. Has the customer demonstrated reasonable project management and IT governance capabilities? If not, this customer will struggle to work with you to implement the technology and practices required to achieve targeted outcomes.
4. Do you have the ability to benchmark the customer’s current performance on targeted KPIs? If the customer refuses to share data or does not have the ability to generate the data, this is a significant red flag. How can you improve performance KPIs if you do not know the current starting point?
This list is just a starting point. Technology providers should build on it to create a comprehensive set of customer attributes that should exist before engaging in an MS relationship. This approach will minimize the risk that a customer will not do what they need to do. It is worth mentioning that profiling your MS customers is an ongoing effort. Well-structured deals that look profitable when being assembled may take a turn for the worse during the life of the contract. Continually measuring MS performance is crucial.
For decades, customers have qualified suppliers to ensure a good fit. When it comes to taking on more responsibility in achieving customer outcomes, suppliers need to qualify customers. Ongoing, focused client management allows you to “fire” (not renew) non-profitable deals and to double down on customers that are profitable and growing. This new approach will not come naturally to many sales reps that historically viewed any customer with a budget as an eligible prospect. If you are simply selling a technology asset to a customer who then assumes responsibility for getting benefit from it, that tactic is fine. But if you are relying on customers to successfully adopt or attain specific business outcomes from your technology in order to achieve your revenue or margin goals, you must qualify their willingness and readiness to take the necessary actions. No contract, no matter how detailed, will replace the need for applying a solid customer profile tactic.
Incubating Managed Services: Key Success Tactics
When incubating an MS business, the first three questions that must be answered are the same as those for any other XaaS offer:
1. What is the offer portfolio and pricing model, and who are we selling it to?
2. What is the customer engagement model that we will use to sell and deliver this offer?
3. What are the financial keys that will allow us to make money with this offer?
The TSIA Managed Services discipline engages with product companies to help them establish or optimize their MS businesses. Through that work, we have identified a set of success tactics to consider as you explore MS opportunities with your customers:
• Make finance your friend. If your finance group is not on board with pursuing MS offers, there is a high probability that the MS business will quickly atrophy from a lack of approved contracts. Finance needs to believe in this business, and they need to understand the financial models of MS.
• Understand the net-new capabilities that will be required to successfully deliver an MS offer. MS offers do require you to be intimately involved in IT operational practices. Common customer handshakes that must be mastered include applications management, capacity management, information security management, and release management. Mastering these processes will most likely require new organizational capabilities for your company.
• Understand the new sales skills that will be required to land MS offers. Our benchmark data is clear on this point. The existing product sales force will struggle with this offer. Yet, we know from our data that the most common approach is to attempt to sell new MS offers through the existing sales force. Our recommendation is to incubate a dedicated sales capability that specializes in selling MS offers. In TSIA benchmark data, we see that companies relying on their existing sales force to sell MS are seeing annual MS growth rates of 5%. Companies that invest in a dedicated MS sales force are seeing annual MS revenues grow an average of 39%.Also, dedicated MS sales reps secure deals that are almost 20% more profitable than the deals being sold by generalist sales reps.
• Establish key performance indicators and measure them regularly. One of the surprising facts we discovered is how many product companies have established MS offers with no clear definition of the KPIs that should be used to understand the health of an MS offer. If they did have KPIs, they often had no idea what “good” should look like for that KPI. This is not untrodden ground. The technology industry understands what metrics to measure related to MS. In addition, we have specific benchmarks on what pacesetting companies achieve on these metrics. Figure 9.12. provides a sampling of the KPIs we recommend MS organizations track.
• Pilot, pilot, pilot. As previously mentioned, it is very important to identify the right customers for your MS offers. Not all customers are good candidates for this type of relationship. Once you start identifying customers, the initial MS engagements should be approached as pilots designed to help you mature the offer. It is unlikely your first MS offer will spring from the heads of your offer designers fully formed. Early customers should understand you are partnering with them to help define the best offer possible for both sides.
• Invest in automation early. The most profitable MS organizations we benchmark have implemented commercial, off-theshelf tools and platforms to help automate aspects of their MS operations. Key tools can be seen in Figure 9.13. on the next page.
• Don’t ignore the channel. There is no doubt that when a product company decides to work with customers directly as a provider of managed services, channel partners get nervous. However, our point of view is that MS offers actually unlock an entirely new class of service opportunities for your partners as well. We will discuss this more in Chapter 10 .

FIGURE 9.12 Top 10 Metrics MSPs Should Be Tracking
Summary Comments
Product companies, historically, have resisted building service capabilities that are not directly related to installing and supporting their own products. However, we are at an interesting juncture in the history of the technology industry. We sit at an inflection point where old business models collapse and new business models emerge. Managed services represents a unique opportunity for product companies to start navigating through this inflection point. There is clearly a market appetite for these services. There is solid evidence product companies can be very successful with these services. If you are not currently investigating MS offers, we strongly recommend you revisit that decision.
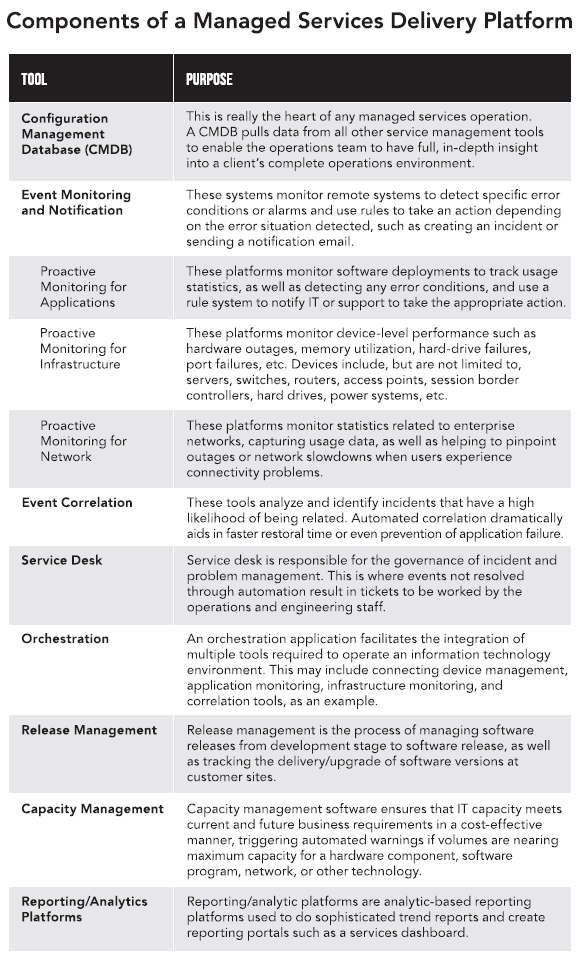
FIGURE 9.13 Components of a Managed Services Delivery Platform
Playbook Summary
Two plays are identified in this chapter:
Play : Saying “YES” to MS
Objective : Determine whether the company should explore MS offers.
Benefits:
• Itemizes the industry trends driving the explosion of MS revenues.
• Itemizes key success tactics the company will follow to minimize risk when incubating MS.
Players (who runs this play?) : Core players: CEO, CFO, head of marketing, head of services, head of product development.
Play : MS Opportunity Map
Objective : Identify potential opportunities the company has for MS offers.
Benefits:
• Creates a common taxonomy for the types of MS offers the company could pursue.
• Creates an understanding of what types of MS offers are the most profitable.
Players (who runs this play?) : Core players: product development, product marketing, services marketing. Review team: CEO, CFO, sales and services leadership.
10
One of the best, most effective plays that traditional tech companies have learned to run is the creation, care, and feeding of a huge network of channel partners.
Companies like Cisco, HP, and Oracle have vast global reseller channels that generate the majority of their total revenue— sometimes more than 80% of it. In some segments like SMB, the channel might account for 100% of the revenue. So naturally, these OEMs spend lots of cycles on trying to keep the channel big, healthy, and happy.
But let’s look one level deeper into most channel partner networks. From the OEM’s perspective, the channel performs two critical roles:
• It puts more salespeople into the market than the company does directly. They can reach the nooks and crannies that the OEM can’t.
• It delivers product-attached services that the company does not want to perform directly.
The channel looks something like Figure 10.1.
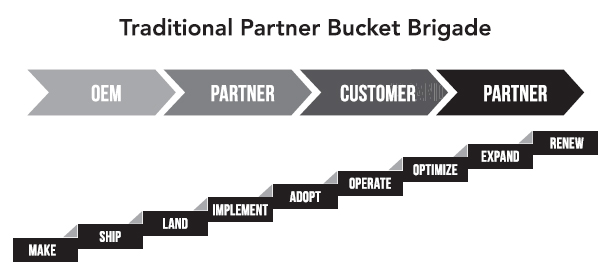
FIGURE 10.1 The Bucket Brigade
You can see these roles reflected in the revenue streams of channel companies like system integrators or VARs. The vast majority of their revenues come from the margins they make by reselling the OEM’s products and from the professional services they deliver to implement them. Take those two revenue streams away and most of the world’s channel companies would collapse.
Imagine what would happen if a traditional tech company that got most of its revenue through the channel stood up a new XaaS offer that the end customer could subscribe to directly in the cloud and that didn’t require much in the way of implementation services.
This scenario is already happening all over the industry. And, as you might expect, it can represent a fundamental challenge to the longstanding agreements between most OEMs and their partners. Obviously, there is a range of cloud-based offers, some of which still do require complex customizations, integrations, and implementations. But if you look at what AWS is achieving on a direct basis with minimal third-party requirements, you get a glimpse of the problem.
The fact is that OEMs and resellers alike are about to face one of the most disruptive eras in the long history of their partnership. Who does what? How does money get made by either party? Who owns the customer? All these questions and more must be reexamined quickly and effectively.
Let’s examine some of the specific challenges we face.
The “VA” in VAR
There aren’t many channel partners out there today who don’t feel they are adding value to the OEM’s solution, but let’s push back on that assumption a little bit. Sure, being able to successfully conduct a sales cycle creates value. It is valuable to the customer who learns how technology can benefit them. It is also valuable to the OEM because they didn’t have to pay the salary, commissions, and benefits of the salespeople. And, yes, implementation services like planning, installation, customization, integration, and training also add value. They allow the customer to master the complexity of the solution faster and more effectively than they could have on their own.
But our question is this: When the sales and implementation phases are all completed, what’s really different about the solution the customer inherits from a particular partner? If the customer had bought exactly the same OEM components from a different channel partner, how would the eventual solution be different? If they bought a Cisco-based network from partner A versus partner B, what lasting value differences would they be able to point to? Most likely, not many. As we mentioned, just how much of the total revenue of most channel companies comes from something other than product resales and product-attached implementation services? In many cases, probably not much.
What happens if the customer could subscribe directly for a new XaaS offer? Or what if the partners are all reselling the same OEM XaaS offer and then simply signing the customer up for it on the OEM’s partner portal? How will the partner add value? And if the need for complex, on-site implementation services is dramatically reduced, then what?
We think the first challenge we have to overcome is redefining what partner-added value truly means in the age of the cloud and XaaS. And, by the way, we know from our experience with channel companies that they are smart enough to already be asking these questions of their OEMs and, in most cases, they are not satisfied with the answers.
The OpEx Pricing Problem
The next problem is the subscription nature of most XaaS offers. Most cloud and managed service offers are priced either on a payfor- consumption or monthly subscription basis. They are funded out of the customer’s OpEx budgets, not their CapEx budgets. That means the revenue and the cash come to the reseller and the OEM over time, not up front.
In these cases, it’s really not a problem for the OEM. After all, it probably doesn’t cost them much to have one more incremental customer on their core XaaS platform. And it was the partner who paid the sales costs on the deal. So, the OEM can wait for the money to come in.
However, for the channel partner, it’s a bigger problem. It was their sales team who got the deal. They had to pay the salaries of that team during the sales cycle. Salespeople live and die based on commission. They are often affectionately referred to as “coin operated.” They live for that big check sitting out there if they close the deal. But if the customer isn’t paying much up front to subscribe to the XaaS offer, who is supposed to pay the sales costs? Who writes that big check to the salespeople? Is it the reseller who takes that risk? The OEM? If neither wants to take that on, will salespeople be happy getting paid a little bit each month as the customer eventually consumes the service and pays their monthly bills?
The LAER Problem
In several chapters of the book, we have discussed the new customer engagement models associated with profitable XaaS. LAER (land, adopt, expand, renew) is all about process-driven engagement activities involving many different players at both the provider(s) and the customer. Land selling teams hand the customer to implementation teams, who then hand them to customer success teams, who will sometimes bring in expansion sales specialists. Sometimes they will hand the customer back to the land sales team if the upsell opportunity is large enough. In LAER, the process owns the customer, not the salesperson on the deal. Importantly, many of these organizations like customer success and expand selling are net-new investments. They are costly to build and operate. They can also be complex, requiring new skills and systems. Not all resellers will have the appetite to build them.
Furthermore, many of these activities are data initiated. By that, we mean that the customer’s actual usage data, combined with the provider’s consumption analytics and success science models, are triggering specific sales and service interventions. That means someone needs to collect that data and pay to build the analytics and models, and then needs to monitor the customer every day to make sure the right interventions are happening at the right time. Without direct access to the customer’s usage data, the LAER model becomes significantly less effective. What’s more, some of the LAER engagement actually occurs through the product itself.
For these reasons, we think that the OEM will be best positioned to perform some of the important engagement activities required in profitable XaaS. Although there may be some large partners who have the resources and desire to do it for themselves, we think the majority of partners will not want or be able to.
This is an entirely different thought about managing customer engagement than the traditional indirect customer model. Let’s face it: most channel partners consciously tried to hide the identity of their customers from the OEM. They were worried that the OEM would begin to deal directly with them, especially if they were a larger company. Now we are proposing that both the partner and the OEM may be active in every account, every time! That is going to be quite a sea change for all three parties. The customer isn’t used to that model, and it’s an historically unnatural act for both the OEM and the partner. Nonetheless, it is likely to occur, and everyone needs to start deciding who does what.
The Skills Problem
This is a challenge shared by the OEM, so there will be lots of empathy on both sides. Most of the skill sets in play in most channel companies are product focused. That means they employ salespeople who can talk about the product, sales engineers who can demo the product, professional services teams who can install the product, and technical support teams who can troubleshoot the product. That’s great, and those needs are not going away overnight in a XaaS world.
As we discussed in Chapter 7 , new skills are needed. We need experts in vertical markets, business process consultants, solutions engineers, and outcome engineers. The people who have these skills are unicorns: They are hard to find and hard to keep. They have the unique ability to think like a businessperson but also be a product expert. They can interface with senior business buyers, not just IT and procurement staff. Sourcing, hiring, developing, and retaining this precious talent is going to be a defining characteristic of successful XaaS partners. It is closely related to redefining the “VA” in VAR. Not all channel partners will have the wherewithal to add these resources. Yet, not having the talent needed to put “VA” in your VAR story could prove fatal.
The Data Access Problem
As we mentioned, many of the engagement activities in the LAER life cycle are data driven. Absent the data, LAER becomes a costly, almost unwieldy, model. You have people running every play on every customer instead of being only at the right places at the right times.
So, where is this precious XaaS data sitting? In the OEM’s data center. Yes, some larger partners have their own XaaS offers and platforms. The data for those applications are sitting in the partner’s data center. However, the OEM XaaS parts of the solution are collecting and storing the data at the OEM.
If we are going to be data driven in our customer engagement model and the data is holed-up on the OEM’s servers, how are the channel partners going to get access to it? Well, it turns out that is only half the problem. The other half is getting the customer’s permission to access it. Even if the OEM and their partners can work out a technical solution for sharing the data in some form, the customer may not be comfortable having their usage data being shoveled all over the world. So, there are multiple challenges to contend with in this thread. We need to decide what data is relevant, whether an individual partner has secure capabilities to access it, whether the partner has the ability to act on the data if they can get to it, and whether the end customer is going to sign up for the whole scheme in the first place.
We think there is a better way to approach the dilemma.
The Software Problem
Many channel partners are woefully understaffed with software developers. As we are going to assert later in this chapter, the value-add of lots of partners is going to be in new kinds of applications and services. In both cases, most of that value needs to be delivered via software.
In a traditional channel relationship, the OEM did most of the software development. They shouldered the big R&D spend and gave products to the partners to resell. Yes, the partners could customize it if the customer paid them to, but with the exception of some of the largest partners, customers did not expect the partners to come to the table with much software of their own.
That is about to change. With software costs and development times coming down, app exchanges and marketplaces speeding time-to-market, and IoT spawning unlimited new application possibilities, software is becoming the game. But even if a channel partner isn’t into building applications, software is still critical. New kinds of project and annuity services are being delivered remotely via software more and more every day. We think successful channel partners are going to need more skills and capability to build software.
The Capital Problem
These last several challenges culminate in the issue of capital investment. Who is going to fund the expense line of swallowing the fish? If there are all these required new capabilities, are individual partners really going to be willing or able to fund the required investments? This is particularly difficult when the returns for these investments are perceived to be in the distant future when enough subscription customers have been added. Even then, the replenishment of capital occurs slowly as monthly revenues recur and the model becomes profitable.
The reality is this: Not all partners are going to be able to fund all the capabilities that they want to have (and the OEM wants them to have, too).
Once again, we think some unnatural acts are going to occur. The “aha” thought is that not all these capabilities need to be built individually by every partner. Many of them can be built once— by the OEM—and then provided to all the partners. This is the most efficient possible use of capital and, fortunately, it puts the responsibility mostly on the one player who can afford it, the OEM.
A second tricky capital question is: Who carries the paper on an asset that is being “rented” as part of a XaaS deal? Does the OEM do that? Or maybe that is the channel partner’s problem. Or maybe one of them needs to find a third-party financing entity that will take it on. It’s yet one more hot-potato issue as we pivot toward more XaaS deals.
The Legacy Customer Problem
Too, we cannot forget that channel partners have an existing installed base of customers. The vast majority of these customers have purchased technology as an asset. When do these customers get migrated to new XaaS offers? How can a channel partner add more value to these legacy customers who are not ready to migrate to new XaaS offers? After all, these existing customers are the ones paying the bills today. As we stressed in Chapter 5 , we think there is a case to be made for an aggressive posture on moving legacy customers onto XaaS platforms. However, we know it’s tricky and it can be unnerving to move customers before they are really willing.
Let’s turn away from challenges and starting heading toward solutions. Before we do that, though, let’s summarize the important questions we need to answer:
• What strategic, value-creation activities do partners need to engage in?
• What are the new financial models for partner companies?
• How do salespeople get compensated when a partner resells OEM XaaS offers?
• How do direct and indirect LAER teams interact?
• How will the requirement for new partner skills be met?
• How do we overcome the security concerns of customers?
• How does the channel avoid the need to make huge capital investments for XaaS offers?
• How does the channel put its customers on a successful XaaS migration path?
We certainly don’t have exhaustive and proven answers on all of these questions, but we do believe that a few big ideas can make them all seem more doable.
Selling Customer Business Outcomes Creates Significant New Opportunities
B4B 1 was an entire book with a single message: What customers want from their tech suppliers is changing . . . rapidly. They don’t want shiny objects called “features”; they want business outcomes. The beauty of XaaS is that it exponentially increases the ability to give them what they want. The time to value is faster, the cost to implement is less, the operation of the solution can largely be done by the provider, and the potential to innovate the customer’s business model is at an all-time high. To top it all off, most of the risk in the relationship shifts from the customer to the provider. After all, if the customer is not getting the return, they can stop. Sometimes, they can stop at the end of the contract. With other offers, they can stop immediately. From many customers’ perspectives, XaaS blows the doors off technology as an asset. The deal is simple: Give me business outcomes or get outta here.
However, many issues surround this new landscape of customer business outcomes:
• Delivering outcomes usually takes an ecosystem of providers, not just one.
• The keys to achieving outcomes from XaaS usually vary industry to industry.
• Outcomes are often vague and need to be specified so that the provider and the customer have common expectations.
• Often, customers don’t really understand how XaaS solutions can revolutionize some or all of their business.
• The biggest impediment to achieving outcomes is usually adoption.
• The biggest impediment to adoption is frequently suboptimal business processes within the customer.
• The conditions for delivering successful customer business outcomes begin in presales. Sales needs to have discussions they aren’t used to having.
• Providers need to qualify customers just as much as the customer qualifies the supplier.
• OEMs and channel partners need to work in concert to deliver the business outcome to the customer.
• The provider will play new roles traditionally performed by in-house IT or that went neglected by the customer altogether.
Here is the key point: Buried in all these challenges is the answer to the new definition of the “VA” in VAR for XaaS. Successful XaaS channel partners of the future:
• Will be educators, business model experts, and solution architects . . . painting business outcome visions that electrify CEOs and CFOs alike.
• Will work seamlessly with OEMs and other value-adding partners inside the partner network and with companies adjacent to their offer but important to the overall outcome. They will have “certified” multivendor solutions.
• Will offer vertical market solutions. As software eats the tech stack, more configurability and easier customization allow vertical nuances to create value far more frequently than in the past. Every layer in the stack is now “smart.”That means hospitals will use the same XaaS offer in a different way than a bank or a manufacturer. XaaS partners need to understand and amplify those vertical market opportunities.
• Will play a unique and differentiated role in achieving the customer’s outcome. They will fill a gap in the ecosystem: This could be through software or through services. However, they represent a point of differentiation. They do some specific thing that is different from or better than other partners in the ecosystem. That is why the increasingly vertical go-to-market nature of XaaS is so exciting. There are so many gaps in vertical solutions that partners can fill! It doesn’t mean the only way to add value is through vertical solutions, but it is ripe with opportunity, especially in emerging areas like IoT. If you can find horizontal value-add areas, by all means fill the gap.
• Will have sales teams able to tie the key features of the solution to the financial outcomes of the customer. The outcome chain methodology we cover in Chapter 7 does this.
• Will have a customer success offer. Whether they deliver it directly or they leverage the OEM’s customer success function, someone is on the job for every customer.
• Will have a business process consultative capability. They monetize that capability as part of the presales, implementation, and adoption phases of the relationship.
• Will have annuity offers to help the customer operate and optimize the solution. They will offer managed, adoption, or information services that optimize outcomes and reduce operating costs. They will also offer unique software or consulting that differentiates them from every other partner in the OEM’s network. This is core to the profitable partner financial model for XaaS—a defense against the killer Cs.
In short, the pivot to business outcomes opens the door to all kinds of new value-adding opportunities. Tasks that used to be performed by the customer (or that didn’t get done at all) can now be performed by providers. This is your chance to replace classic product-attached services with new, much higher value-adding operate and optimize services. The tech industry is maturing—no more bright, shiny objects. Successful channel partners will have a clear and specific set of roles in the customer’s outcome chain.
Just look at all the new service opportunities we identified in Chapters 3 and 4 .
There are a dozen new “optimize services” lines that can be added to the seven traditional product services lines. Though some are project-based services, most are annuity services, which we know can be delivered at very high gross margins if done correctly. Figures 10.2.1 through 10.2.4 document the evolution of the technology services portfolio.

FIGURE 10.2.1 Major Revenue Categories
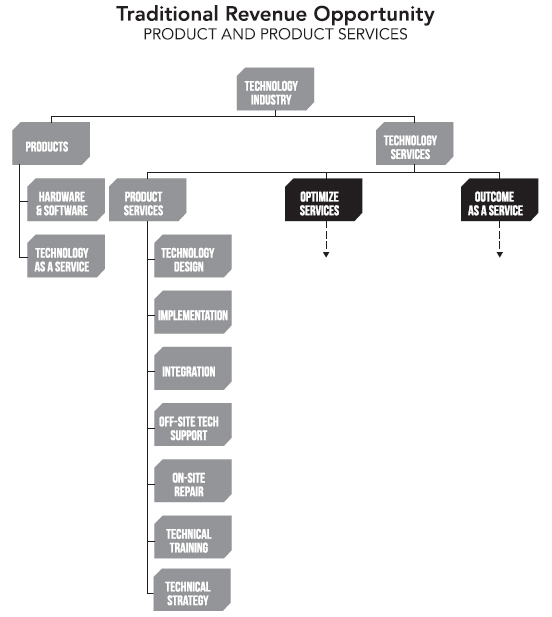
FIGURE 10.2.2 Traditional Product and Product Service Revenue Categories
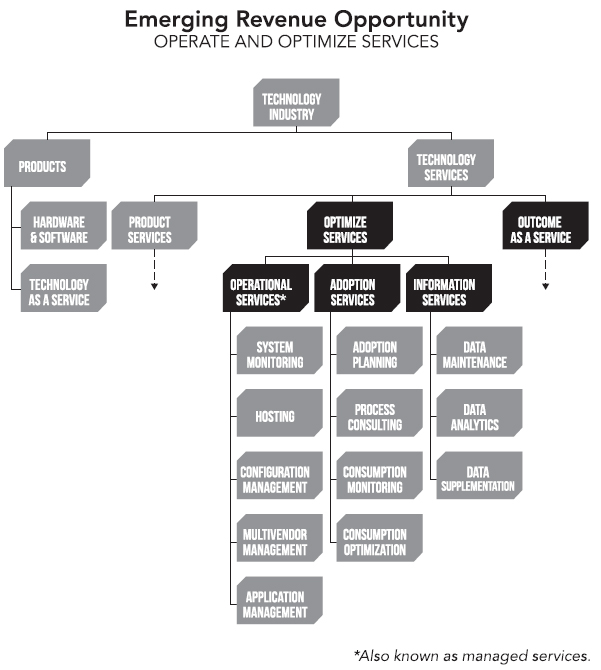
FIGURE 10.2.3 New Operate and Optimize Service Revenue Categories
One problematic hurdle is the coordination problem when multiple OEMs and/or partners are required to deliver a business outcome to the customer. Often the field teams don’t play nice in the sandbox. Having each provider trying to be the leader of the combined team is a recipe for disaster. The sales and technical teams need to be thoughtful and to plan carefully. They need to keep in mind that getting the deal is more important than leading the sales cycle. Three good rules of thumb: One is that the provider who is the highest in the stack, i. e., closest to the application level, is probably most important to the customer and, therefore, may be best suited to lead the deal. Second is that vertical trumps horizontal. Sales and technical resources with deep vertical expertise and who can converse with the business executives at the customer should be doing most of the talking. Business users don’t care about all the technical complexities. They are paying for someone else to do that. They want to talk about how the business value will be realized. Finally, we think that the OEMs should be orchestrating the first and most important “certified multivendor solutions,” including coordinating sales activities. Then, like taking the training wheels off of a bike, the partners will master sales coordination between multiple players.
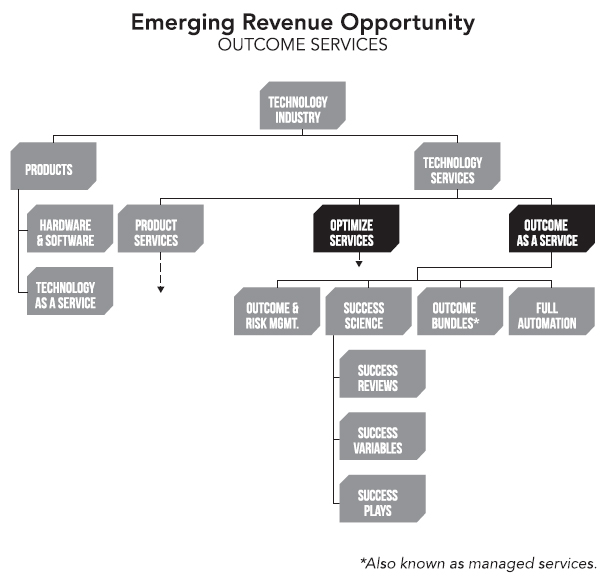
FIGURE 10.2.4 New Outcome Service Revenue Categories
We believe that the pivot to customer business outcomes will create many new chances to unlock value for the customer. We think channel partners can play a large and profitable role in delivering the outcomes either through their proprietary software, their vertical or business process expertise, or through their optimize services portfolio.
Leveraging the OEM’s XaaS Platform
As we mentioned, we don’t think it makes sense for certain investments to be replicated at partner after partner. Instead it makes sense for the OEM to make the investment once and then let the partners access the asset.
Remember our illustration in Chapter 4 and shown here in Figure 10.3 ?
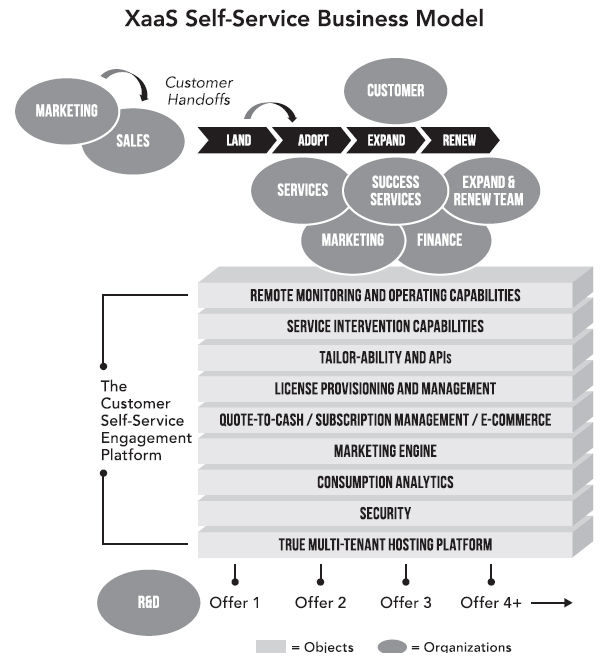
FIGURE 10.3 XaaS Self-Service Business Model
We call it the XaaS customer engagement technology platform. Again, the concept here is that the OEM builds a sophisticated technology platform that has three main attributes:
• The product offers attach to the platform. They can be provisioned, used, and managed from it.
• The customers interact directly with the platform. They place orders, use products, get marketing and training information, and they can even pay bills. It becomes a significant part of the overall customer experience. The platform is part of the OEM’s brand as well. It is a big part of their differentiation.
• Internal delivery functions such as services success and finance also leverage the platform. It feeds the internal systems with information about what to do for a particular customer and when to do it. It is the same for marketing and expand selling. Marketing can use the platform to deliver customized messages to buyers and users through the products that are attached to it. Expand selling can reach buyers to chat and transact.
Just to be clear, this platform is not a single piece of software. It is a stack of many objects, most of which will be purchased from third parties. However, there is a need to knit them all together, build the application layers, connect the offers, and integrate to the internal systems of the sales, marketing, and service organizations. That will likely be done in-house. But here is the point: This isn’t cheap. It absolutely does not make sense for every channel partner to attempt to build their own platform. This is why we believe channel partners should be heavily lobbying OEMs to establish these platform capabilities. So, if you are an OEM, brace yourself for this tsunami of partner requests!
What does make sense is that the individual channel partners can get the “keys” to access and integrate to the OEM’s platform. That means the partner can rely on the platform to undertake many of the post-land activities. They can simply be a user of the platform to enable and inform both their service delivery offers as well as their expand and renew sales motions. This approach also solves the data access problem. The partner doesn’t need to house or see the actual customer usage data: That data remains on the OEM’s platform. But the platform uses advanced analytics and models to pass actionable interaction triggers or customer health scores to the partner.
Even more powerful is the idea that the platform can become the actual operating platform for the “operate” and “optimize” services of the partner. Imagine offering a managed service to the end customer that the partner sells and operates, but they are using the OEM’s managed service platform as their service management system. Through the platform, they get fully processed indicators of the customer’s system performance and adoption. They can manage the technology or intervene with end users. They can add new customers and upgrade existing ones. They may even be able to use the platform to price and bill for their offers. The partner might use it under the OEM’s brand or perhaps the OEM allows the partner to co-brand the platform. Wouldn’t that be nice! Well, it’s happening today. There are many variations, but one version might look like Figure 10.4.
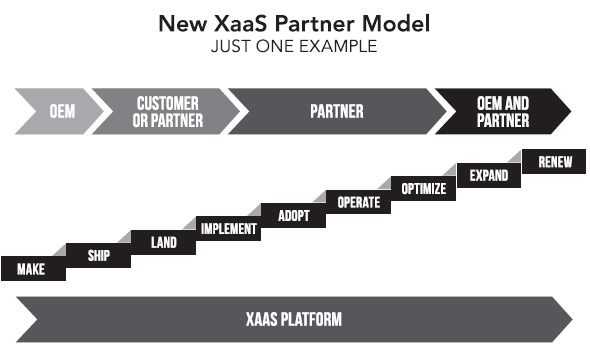
FIGURE 10.4 New XaaS Partner Model Example
Larger partners who resell many OEM solutions may be building some form of customer-facing platform of their own. In that model, their platform will be integrating to many OEM platforms. The OEM platforms can still provide the same value, but they are simply passing information back and forth to the partner’s platform. The partners’ customers and staff only experience the partner platform, but it is fueled by information coming from the OEM. In this case, it is in the OEM’s best interest to offer the most robust integration possible. That’s because the better they work with the partner’s platform, the more of their XaaS offers the partner will sell.
These approaches also act as an accelerator to closing the software skills gap for partners. If the OEM builds the platform, SaaS applications, and services with the channel in mind, partners will be able to tailor rather than build from scratch. OEMs will let partners stand up creative applications and services but do so far faster, less expensively, and with lower maintenance costs.
The New Financial Models for Partners
Essentially, many channel partners face the same exact fish model problem as the OEM. They, too, must keep the traditional, asset sale-plus-service business as robust as they can during their transition to a subscription business model. That is going to provide some financial air cover for the investments they need to make and cushion the short-term impact on revenue of switching customers to subscription pricing models like managed services or SaaS. There is no sense in waiting to get started. Traditional asset-based sales revenues are dropping across the industry. Next year isn’t going to be better for those revenue streams; it’s likely to be worse. Now is the time to begin the journey of swallowing the fish.
If channel partners are going to be using the same financial approach to modeling the transition as the OEMs are, we can borrow some content from Chapter 8 .
Most partners have the same five revenue streams as OEMs:
• Asset revenues (reselling technology as an asset)
• Technology subscription revenues (reselling technology as a subscription)
• Annuity services revenues
• Project services revenues
• Transaction revenues
And, like all businesses, each revenue stream has its normal costs:
• COGS (cost of goods sold) and gross margin (revenue minus COGS)
• S&M (sales and marketing)
• R&D (research and development)
• G& A(general and administrative)
So we suggest that channel partners need to complete the financial model exercise in Chapter 8 for each year of their transition. They need to allocate revenue across the five revenue categories each year in a way that reflects three important concepts:
• The decline of traditional asset revenue
• The rise of subscription revenue
• The replacement, and eventual growth, of traditional project and annuity revenue streams with new offers
We are not going to repeat all of Chapter 8, but if you are a channel partner, we suggest you read it and do the exercise. Also, our data tells us that a majority of channel partners have a majority of their revenue coming from the first data stream (reselling technology as an asset). This industry transition to XaaS will be just as disruptive to the economic engines of partners as it will be to the OEMs. We expect some large OEMs may be able to leverage their extraordinary cash piles to provide business financing to qualified, key partners as they migrate to the new model.
One part of the financial model we do want to touch on specifically is related to commissions (or points, margin, or discounts) that are extended to the partner for signing up the customer. This is a very interesting topic, and one that is new to most companies. So, let’s get a few concepts on the table. Thus far, we see the following trends emerging:
• Salespeople get commissioned on committed customer revenue (the part of the contract the customer can’t cancel).
• Most companies don’t want their salespeople living on residual income from previous years’ sales; thus, they are limiting the commissions to first-year committed revenue.
An interesting analog to the commission problem of a XaaS offer is from the insurance industry. According to The Wall Street Journal , insurers pay their independent agents anywhere from 15% to 20% of the first-year premium (for auto insurance) to more than 50% (for life insurance). 2 Many OEMs may hate the idea of paying 20% to 50% of their first-year revenue in commissions to the partner. Most partners are going to hate paying all of it to the sales team.
But, here is why you do it with a smile: In insurance, those high sales commissions on first-year revenue can work out to be less than 1% on the total lifetime spend of the customer. It’s basically to be viewed as just another financing, P& L, or cash flow challenge in the XaaS world. In TSIA’s view, we agree: You don’t want the salesperson making money on the renewal in years 2, 3, and 4. You want them making money on the land and expand phases. And, who pays the up-front commissions? It’s simple: Where does the customer pay? Do they sign up and pay with the partner? Or do they sign up and pay with the OEM? Whoever they commit to, that’s who subsidizes the sales effort. That’s what insurance companies do every day, and they have a lot more experience at optimizing this model than we do.
Vertical, Vertical, Vertical
Everyone needs a niche. In traditional tech, the OEM’s niche was often defined by a layer in the stack or a toolbox for managing it. As a result, most OEMs and their channel partners sold basically the same solutions from industry to industry.
We think, more than ever before, that niches are going to be important. That’s where differentiation will occur and how optimal margins will be realized. But what kind of niches will be sought by customers? If you believe that the influence of the business buyer and their obsession with business outcomes will continue to increase, we suggest there are (at least) three great places to play:
• Business process experts
• Managed service experts
• Vertical experts
Let’s take a look at each one.
Business buyers are responsible for adeptly executing processes within their organization. Most people agree that weak business processes is one of the primary causes of poor technology adoption and low value realization. For many years, IT departments were in charge of buying technology, and their mandates to vendors were often to ascribe to their company’s current systems and processes. They developed RFPs that were based on how they thought things should work. They spent millions to customize software and incorporate legacy systems into new solutions.
Today’s business buyers seem to be increasingly open to a new way of thinking. They often see XaaS companies as consultative partners. They expect the provider to tell them what best practices look like. They want to ascribe to what is proven to work in the industry, not to their old processes and systems. That opens the door for thousands of partners to specialize in business process optimization services.
Another characteristic of business buyers is that they don’t want to spend time administering or optimizing technology. They want someone else to manage it for them. Even IT departments whose budgets are being pinched and who want to deploy their talent to advancing new corporate capabilities rather than maintaining existing ones are now open to more managed services from their providers. This is another great new subscription revenue stream for partners. Please read Chapter 9 for more details.
Finally, we think that the industry—both suppliers and customers—is realizing that there is a lot more value to vertical solutions than horizontal ones. We mentioned this earlier in the chapter as part of delivering customer business outcomes, but we really want to stress the huge opportunity that vertical “everything” represents.
The math in the new niche opportunities created by “going vertical” is staggering. If you figure that 50% of the tech stack— starting at the network and security level and moving up through data management, analytics, collaboration, and applications levels— has hundreds of vertical optimization opportunities per industry, and there are hundreds of significant micro-verticals, then the number of opportunities to specialize and add unique value is immense.
All of these vertical value-adds require two basic ingredients: some experts and some customers willing to work with you. Only the partner can pick their spot. They need to identify good vertical markets that fit their vision. Hopefully, they already have some of both assets in the targeted industry(s). But their vertical value needs to be built on a real-world knowledge of that industry. They can develop software that fills a gap, provide business process services on critical tasks, provide benchmarks or analytics, and create a solution architecture—just for a single vertical or micro-vertical!
And the Internet of Things is going to light vertical opportunities on fire! We can’t stress how many new opportunities are likely to be created for vertical value-add over the next decade. Some partners are going to make a killing by being the 800-pound gorilla in their niche. Security will go vertical; collaboration will, too. So will high-performance networks and analytics. Don’t forget the hundreds of software applications and web service opportunities.
Evolving these new offers—especially service offers—must be done with care. Traditionally, services were synonymous with people. We think that is an antiquated notion. We think services should be a combination of people and software with a trending toward software. We encourage partners to pursue a line of thinking that we laid out in the book Complexity Avalanche . 3 In it we suggested that services be thought of as going through three “ages” (Figure 10.5. ).
In this progression, you are applying your best and brightest people to service engagements in the early stages. Their mission is to uncover the keys to success and the toughest challenges along the way. Then, you tell them that you are going to fund the development of tools to scale the value-creating motions; automate the repetitive, low-value ones; and build applications to shrink the challenges. Eventually, you will build those tools into the actual products you are delivering to the customer. The product itself then has the “option” of performing the tasks for itself. You can choose to make that an embedded but differentiating part of your solution or you can monetize it separately. But in any case, you should think about services development in this way. Once you have worked the smart people out of the delivery model, you move their focus to the next new service opportunity even higher up the value chain and repeat the cycle. Obviously, this is one reason partners need better software development capability.

FIGURE 10.5 The Three Ages of Services
We think tens of thousands of channel partners need to augment their traditional value-add of filling a local market “integrator” niche with a vertical market “expert” niche at the national or international level. But remember, you are going to need to partner with other partners who offer complementary vertical offers or skills to deliver full business outcomes to customers. It truly takes an ecosystem.
Picking the Right Customers, Migrating the Existing Customers
In traditional tech, any customer with budget was a good customer. In XaaS, that’s not necessarily true. After all, traditional tech was a pay-up-front world. If the customer was willing to part with the money, the OEM or the partner made money. Pretty simple. Of course, we all wanted the customer to succeed and buy more, but we were willing to gamble on the outcome because the risk was on the customer’s shoulder. But in XaaS, the customer might pay little or nothing up front. They might be locked in for multiple years but maybe not. The up-front costs to sell, implement, and train might have been absorbed by the provider in order to get the subscription. And, whatever commitments were made might have been for a pilot where the provider is smothering the customer with expensive love in the hope that the pilot will explode into an enterprise relationship.
The bottom line is that in XaaS, the risk is with the provider. The profits in the deal may be in year 2—or in years 3 or 4.Those profits may depend not only on renewal but also on expansion. As we said in Chapter 7, new customer engagement models are needed. That goes for channel partners, too. LAER is for them to execute just as much as for the OEMs. Please refer to that chapter for more details.
But, here is the main point: If the customer is not ready to do what they need to do to succeed with your XaaS offer, then you should not take the deal. Yes, that’s right, walk away. If they are not ready to engage with you to adapt their business processes, train their end users, utilize your expertise, run the customer success playbook that you gave them—if they don’t view you or your offer as a true partner to listen to—then focus your finite resources on a customer who will. This is a tough message for the sales force to hear. This is an issue for frontline sales management. It is up to them to spot these deals and not spend many cycles on them. They are uniquely positioned in that they are close enough to the deal to spot the trouble signs. They are mature enough to understand the problem. They need to be supported by executive management when they make the call. Believe me, we know of deals where tens of millions in losses have been incurred by providers over this issue.
This is also the principle that will guide you through the customer migration process. First, focus on migrating customers that are ready, willing, and able to engage in these new models. For customers that are resistant or unable, keep them on the legacy models. At some point, though, they will need to move. You will need a road map of incentives to make them move, along with disincentives if they stay. At some point, you may need to turn the fire all the way up and force them onto your XaaS offer. In the interim, understand that they will be a diminishing revenue stream. Once again, this is a tough message for your sales reps to internalize.
Leveraging the Scale Advantage of Traditional Tech
One of the premises of this book is that there has been an unfair playing field that, so far, has given the advantage to “born in the cloud” start-ups over traditional tech companies. In other words, so far, the ability to be innovative and disruptive has trumped the competitive advantages of scale enjoyed by traditional tech OEMs and partners. However, we think that’s a swing of the pendulum that can be driven back in the other direction.
As we mentioned previously, many pure-play XaaS companies are largely rooted in doing business in their home country. Most US SaaS companies get the vast majority of their revenue from the US market. This is the same for start-up enterprise XaaS companies in Germany and China. In addition, most pure-play XaaS companies espouse the “best of breed” value prop. They argue—right or wrong—that customers should pick from a menu of highly focused providers and knit them together to form complete solutions.
That’s great except for one thing: Some customers don’t buy into that strategy. Maybe they are global companies that want a consistent experience across all their locations worldwide. Maybe they prefer a deeply integrated solution from a company with a broad portfolio of core offers, not just one. Or they want one data partner that can operate globally and yet meet local country requirements. In any case, this is another way for partners to add value. If you have that scale, have an international sales and services capability, or represent a broad portfolio of XaaS offers that you have already built the software to knit together, then maybe you can be the only qualified provider in the eyes of that customer. Scale is still an advantage, even in the XaaS world. We think the pendulum is about to swing that way again. Just look at the investment focus of AWS and Salesforce. It’s about broadening the portfolio and their geographical footprint. That is what happens when innovations begin to mature and need to become “industrial strength.”
Traditional IT Sales and Services Don’t Go Away, They Just Trend Down
These new capabilities are not for every channel partner and certainly are not required on every deal. There is still value to be created by simply reselling products and delivering traditional systems integration, implementation, and support services. That is still a huge market today. Lots of money is being paid out by end customers for those services.
However, it’s not a trend that is likely to increase. IT budgets are plateauing or shrinking, and as much as half of technology decisions are being made by business users. Many XaaS offers are simply easier for them to try and require less of a service wrapper. There are many, many signs that channel monetization activities around traditional IT are not going to be a source of growth unless you can take share from a competitor. It’s going to be a tough road if that is your only growth strategy.
While IT may be trending down, though, things like IoT are trending up. So, if you know how to connect PCs, why can’t you connect IoT devices? If you can plan and manage an on-premise IT implementation, why can’t you manage an off-premise SaaS rollout? Fortunately there are many opportunities to repurpose and redirect existing resources into higher-growth areas. Yes, there are new things to learn and maybe even new OEMs or ISVs to partner with. But, as we have repeatedly pointed out, selling business outcomes to business buyers is where the real growth is going to be. Partners need to get on that train somehow.
The bottom line, as we said in B4B , is that these are AND strategies we are advocating, not OR ones. We think you will want to engage in your traditional monetization activities AND invest in these new capabilities. Go ahead and grab as much of the trillion dollars or more that customers spend on traditional products and services as you can. Hybrid computing is here for a long while. But, if you want your company to grow, if you want strategic customers instead of price shoppers, if you want to continue to innovate and attract great people . . . if you want those things, you will need to act.
So, Imagine . . .
Just like the smoke is starting to clear on profitable XaaS business models, we think the next-generation partner business model is beginning to take shape. We think the model has these characteristics:
• 70% to 80% of revenue is recurring.
• Recurring revenue comes from a balanced mix of technology subscription and value-added annuity services.
• Software and services dominate the portfolio.
• Value-added offers are built on top of the OEM’s platform.
• partner works with other partners in the ecosystem to deliver outcomes to the customer. They can also combine offers from multiple XaaS and traditional OEMs and act as a new style of SI.
• Their value-add is rooted in vertical industry, business process, or managed services expertise. Best-practice capture and conveyance are essential processes.
• Ongoing data analytics are central to the value proposition and are focused on “ongoing value over time” that fuels subscription services, not just project services.
• The partner doesn’t care how the end customer originally subscribed to the OEM’s core XaaS offer (direct or indirect). The partner can still add value and monetize that customer over time via services or software even if the OEM sold them originally. Customers are no longer “mine” or “theirs.” They are all “ours.”
• They offer their own form of LAER (see Chapter 7 ) working in concert with the OEM’s customer success teams.
Playing Your Position
Think about the team roles of a quarterback and a wide receiver in America’s National Football League. They each have their unique role to run in a winning play. They need different skills and carry the ball at different times, but they are both running one play. They feed off each other. They respect each other’s contribution, and they count on each other’s execution.
That’s how we think about the next generation of channel plays. Much rides on the OEMs. They have to call the play and deliver the ball. Then, the channel partner needs to run with it, finding their own spots and breaking through the holes that lead to the score. If either party fails, there is no score. But, it starts with the OEM. What plays are in their playbook? What route do they want the partner to run? Can they deliver the ball?
Honestly, we think that many OEMs are late to the table with their XaaS channel playbook. Many resellers we know are unhappy with the answers to the hard questions they are asking. They talk to customers every day. They know what’s happening out there. But they are dependent on their OEMs to explain how they will run the play and, more importantly, how they will make money. We hope this chapter helps frame some answers.
XaaS Playbook Plays
FOR OEMs:
Play : Model Your Profitable XaaS Partner Economic Engine Model
Objective : Use Chapter 5 to identify the specific XaaS revenue streams that you believe your partners should monetize. Identify the mix and margin expectations for each revenue stream. Model the number of years in their journey to target GAAP profitability for key partner segments.
Benefits:
• Identifies the target financial model for the partner types.
• Identifies investment requirements.
• Sets expectations on target margins for each revenue stream.
Players (who runs this play?) : Partner strategy and enablement team, finance. Review team: CEO, CFO, CIO, and board.
Play : Sketch Out Your Partner Platform Strategy
Objective: Draw a picture of your XaaS operating platform and how partners will access, add value, and monetize it. Determine what services you want to enable and whether they will be OEM branded or white-labeled to the partners. Determine how LAER will be performed for customers brought onto the platform by the partner. Determine how the platform will integrate with the platforms built by your larger partners.
Benefits:
• Identifies the core requirements of the platform for your channel business.
• Identifies investment requirements.
• Provides specifications to CIO/CTO.
Players (who runs this play?) : Partner strategy and enablement team. Review team: CEO, CFO, and CIO.
Play : Identify Key Vertical Opportunities
Objective: List those vertical market opportunities of greatest value. Identify existing partners who can fill the gaps in selling and delivering complete business outcomes in those markets. Note where you have holes and target new partners that can fill them. Begin to define go-to-market strategies that detail the financial, LAER, and coordination challenges that lie ahead to deliver the ecosystem outcomes at scale.
Benefits:
• Identifies the key vertical opportunities.
• Tells you what partners to focus on and what new ones to add.
• Lays out the to-do list of challenges that must be overcome.
Players (who runs this play?) : Partner strategy and enablement team. Review team: CEO, CFO, and CIO.
FOR PARTNERS:
Plays : We suggest partners run the Plays in Chapters 3 , 6 , 7 , 8 , or any other chapters that resonate with you.
Endnotes
Chapter 1
1 . Gladwell, Malcolm. 2002. The Tipping Point: How Little Things Can Make a Big Difference. New York: Back Bay Books.
2 . Wood, J. B.,Todd Hewlin, and Thomas Lah. 2013. B4B: How Technology and Big Data Are Reinventing the Customer-Supplier Relationship . San Diego, CA: Point B, Inc.
3 . For a complete listing of companies in both indexes, visit http://www.tsia.com/financial-sets.html .
4 . Why a Subscription Model Could Be the Future for All Businesses,” http://www.techradar.com/us/news/world-of-tech/management/why-a-subscription-model-could-be-the-future-for-allbusinesses-1249302; “Wall Street Loves Workday, but Doesn’t Understand Subscription Businesses,” http://allthingsd.com/20121128/wall-street-loves-workday-but-doesnt-understand-subscriptionbusinesses .
5 . http://seekingalpha.com/news/2575935-wedbush-downgrades-autodesk-worried-about-business-model-transition?app=1&uprof=25 .
6 . http://marketrealist.com/2015/04/will-oracles-transitioncloud-impact-margins .
7 . https://redmondmag.com/articles/2014/11/01/windows-cow.aspx .
8 . http://www.marketwatch.com/story/sap-profit-down-23after-cloud-move-2015-04-21 .
9 . http://seekingalpha.com/instablog/749739-vuru/3518265-adobes-adbe-strategic-shift-will-lead-to-growth-in-the-long-term .
10 . http://www.reuters.com/article/2015/01/24/us-sap-cloudprofitability-idUSKBN0KX0FY20150124 .
11 . http://www.forbes.com/sites/connieguglielmo/2013/10/30/you-wont-have-michael-dell-to-kick-around-anymore .
12 . http://www.reuters.com/article/2012/11/01/us-jdasoftwareoffer-idUSBRE8A00N820121101 .
13 . http://www.reuters.com/article/2013/05/06/us-bmcsoftwareoffer-idUSBRE9450F520130506 .
14 . http://www.theregister.co.uk/2015/10/16/dell_bought_emc_is_this_the_end_salvation .
15 . http://www.ciodive.com/news/informatica-now-private-announces-new-leadership-team/412011 .
16 . http://fortune.com/2014/10/08/hp-split-meg-whitman .
17 . http://marketrealist.com/2014/12/symantec-split-two-companies .
Chapter 2
1 . http://www.mcafee.com/uk/products/security-as-a-service/saas-free-trials.aspx .
2 . http://www.appfolio.com/benefits/pricing?_bk=appfolio%20property%20manager&_bm=e&_bc={creative}&_bt={creative} .
3 . https://www.veeva.com/services/ .
4 . https://blog.kissmetrics.com/saasy-pricing-strategies/ .
Chapter 3
1 . There is a great article analyzing Amazon’s elongated “unprofitability”: http://ben-evans.com/benedictevans/2014/9/4/why-amazon-has-no-profits-and-why-it-works .
2 . http://www.morningstar.com/InvGlossary/economic_moat.aspx .
3 . Burton, Jonathan. August 2, 2012.“Follow the Buffett Strategy.” The Wall Street Journal.
4 . For those of you too young to remember this commercial: https://www.youtube.com/watch?v=TgDxWNV4wWY .
5 . Gartner Says Worldwide IT Spending to Decline 5.5 Percent in 2015,” June 2015. http://www.gartner.com/newsroom/id/3084817 .
6 . Wood, J. B. 2009. Complexity Avalanche: Overcoming the Threat to Technology Adoption . San Diego, CA: Point B, Inc.
7 . https://www.zendesk.com/benchmark-your-support/ .
8 . http://logisticsviewpoints.com/2011/08/22/sap-performancebenchmarking-in-supply-chain-management/ .
9 . https://aws.amazon.com/premiumsupport/trustedadvisor/ .
10 . http://www.jda.com/thought-leadership/retail-self-assessment/ .
11 . www.granular.ag .
Chapter 4
1 . Wood, J.B.,Todd Hewlin, and Thomas Lah. 2013. B4B: How Technology and Big Data Are Reinventing the Customer-Supplier Relationship . San Diego, CA: Point B, Inc.
2 . http://organizationalphysics.com/2012/01/09/the-5-classicmistakes-in-organizational-structure-or-how-to-design-yourorganization-the-right-way/ .
3 . https://www.pac-online.com/sap-services-simplifies-customerengagements-%E2%80%9Cone-service%E2%80%9D .
4 . Moore, Jeffrey A. 2015. Zone to Win: Organizing to Compete in an Age of Disruption . New York: Diversion Books.
5 . To watch the full presentation, visit: https://www.youtube.com/watch?v=0WOLc3a8lHg .
6 . Wood, J.B.,Todd Hewlin, and Thomas Lah. 2013. B4B: How Technology and Big Data Are Reinventing the Customer-Supplier Relationship . San Diego, CA: Point B, Inc.
Chapter 5
1 . For more details on this analysis, review TSIA’s quarterly T&S 50 webcast presentation.https://www.tsia.com/events/webinars/ondemand-webinars.html .
2 . Wood, J.B.,Todd Hewlin, and Thomas Lah. 2013. B4B: How Technology and Big Data Are Reinventing the Customer-Supplier Relationship . San Diego, CA: Point B, Inc.
3 . http://www.wsj.com/articles/when-it-comes-to-tech-servicescloud-can-be-a-nebulous-term-1454375944 .
4 . http://www.adobe.com/aboutadobe/pressroom/pressreleases/201110/100311AdobeCreativeCloud.html .
5 . http://ww2.cfo.com/revenue-recognition-accountingtax/2015/07/intuit-manages-big-accounting-change .
6 . http://www.sec.gov/Archives/edgar/data/769397/000076939714000018/adsk-0131201410xk.htm .
7 . http://www.autodesk.com/products/perpetual-licenses/perpetual-licenses-faq .
8 . Moore, Geoffrey A. 2015. Zone to Win: Organizing to Compete in an Age of Disruption . New York: Diversion Books.
9 . Christensen, Clayton M. 2013. The Innovator’s Dilemma: When New Technologies Cause Great Firms to Fail . Boston, MA: Harvard Business Review Press.
10 . Herbold, Robert J. 2007. Seduced by Success: How the Best Companies Survive the 9 Traps of Winning . New York: McGraw-Hill.
11 . http://fortune.com/2014/06/18/for-adobe-cloud-tractionleads-to-record-high-stock-price .
12 . https://wedesignstudios.com/why-adobes-subscriptiononly-plan-sucks .
13 . http://www.fool.com/investing/general/2016/01/28/why-servicenow-inc-stock-sank-today.aspx .
14 . http://q4live.s1.clientfiles.s3-website-us-east-1.amazonaws.com/454432842/files/doc_presentations/2014/Salesforce%20Analyst%20Day%202014.pdf .
Chapter 6
1 . Wood, J.B.,Todd Hewlin, and Thomas Lah. 2011. Consumption Economics: The New Rules of Tech . San Diego, CA: Point B, Inc.
2 . www.tableau.com .
3 . www.liveperson.com/solutions/marketing .
4 . http://www.workday.com/applications/human_capital_management.php .
5 . For more information on Tim Matanovich work, visit: http://www.valueandpricing.com .
Chapter 7
1 . http://www.chaotic-flow.com .
2 . TSIA 2015 Consumption Analytics Survey.
3 . Lah, Thomas. December 3, 2014.“Defining the Customer Engagement Life Cycle.”TSIA.
4 . http://www.forentrepreneurs.com/2014-saas-survey-1/ .
5 . Wood, J.B.,Todd Hewlin, and Thomas Lah. 2013. B4B: How Technology and Big Data Are Reinventing the Customer-Supplier Relationship . San Diego, CA: Point B, Inc.
Chapter 8
1 . TSIA T&S Cloud 20, Q4 2015 snapshot.
2 . 10-Q, posted November 20, 2015.
3 . According to Wikipedia. https://en.wikipedia.org/wiki/DocuSign .
4 . Ibid.
5 . According to Wikipedia. https://en.wikipedia.org/wiki/LinkedIn .
6 . Sharf, Samantha. July 20, 2015. “Why the 10% Drop in Software Sales Is the Most Important Number in IBM’s Q2 Earnings Report. http://www.forbes.com/sites/samanthasharf/2015/07/20/whythe-10-drop-in-software-sales-is-the-most-important-number-inibms-q2-earnings-report .
8 . Shankland, Stephen. May 6, 2013. “Adobe Kills Creative Suite, Goes Subscription-Only.” CNET. http://www.cnet.com/news/adobe-kills-creative-suite-goes-subscription-only .
9 . McAbllister, Neil. April 23, 2015. “Amazon Lifts Lid on AWS Money Factory, Says It’s a $5 BEEEELLION Biz. The Register .
10. http://www.theregister.co.uk/2015/04/23/amazon_q1_2015_earnings_cloud .
Chapter 9
1 . “Why Businesses Are Turning to Managed IT Services,” CIO, June 2015, http://www.cio.com/article/2930498/it-strategy/why-businesses-are-turning-to-managed-it-services.html .
2 . “Your IT Wingman: The Agile Managed Services Provider,” Forbes-Tech, September 2015, http://www.forbes.com/sites/centurylink/2015/09/25/your-it-wingman-the-agile-man aged-services-provider/#2715e4857a0b408bd03b34da .
3 . “Gartner Says Worldwide IT Spending to Decline 5.5 Percent in 2015,” http://www.gartner.com/newsroom/id/3084817 .
4 . “Managed Services Market Worth $193.34 Billion by 2019,” http://www.marketsandmarkets.com/PressReleases/managed-services.asp .
5 . Moore, Geoffrey A. 2015. Zone to Win: Organizing to Compete in an Age of Disruption . New York: Diversion Books.
Chapter 10
1 . Wood, J.B.,Todd Hewlin, and Thomas Lah. 2013. B4B: How Technology and Big Data Are Reinventing the Customer-Supplier Relationship . San Diego, CA: Point B, Inc.
2 . http://www.wsj.com/articles/SB10001424052702304177104577305930202770336 .
3 . Wood, J.B. 2009. Complexity Avalanche: Overcoming the Threat to Technology Adoption . San Diego, CA: Point B, Inc.