Chapter 12
Enabling Improved Decision-Making
IN THIS CHAPTER
 Applying business intelligence
 Supporting better decisions by digging into analytics
 Doing data science for decision support
 Deciding which approach to apply first
Business and data science are both complex topics in their own rights. You can easily find yourself getting caught up looking at the bark on the trees and accidentally forgetting to look for a way out of the forest. That’s why, with each new data project, it’s extremely important to stay focused on the goal. Ultimately, no matter the business function or industry you support, true north is always the same: business profit growth. Whether you achieve it by creating greater efficiencies or increasing sales rates and customer loyalty, the goal is to create a more stable, solid profit-growth rate for your business. In this chapter, I focus on showing you how to use data to increase business profit by improving decision support at your company.
Improving Decision-Making
Before discussing how to use data to help improve decision-making, it pays to take a closer look at decision support systems and whom they benefit. A decision support system is an information system that's capable of converting complex, raw data into data insights that inform business decision makers about the health of their operations and units. Back in the olden days, decision support products were only provided to business leaders, managers, and executives. These products fed them the intel they needed to make decisions on behalf of their companies. Nowadays, however, things have changed: Rapid innovation in data science and AI have made it relatively easy to improve decision support for workers at all levels of the business. The focus of this chapter is to explain how you can use data science, data analytics, and business intelligence to improve decision support for employees who serve in a wide variety of functions at businesses in all industries.
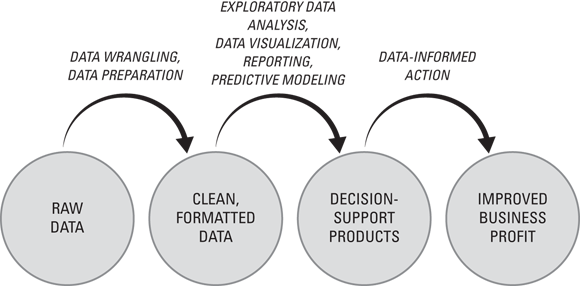
FIGURE 12-1: The data-to-dollars flowchart.
As shown in the data-to-dollars flowchart in Figure 12-1, you always start with raw messy data, which you then need to clean and reformat in order to produce a meaningful result. Once it's ready, you can build data products that support and improve employees' decision-making at your company. The goal of this improved decision-making is, of course, to increase profits for the business — in other words, bring in more money, waste less money, or generate new revenue streams altogether. In a case study featured later in this chapter, you can see how data science was used to create decision support AI that resulted in improved customer satisfaction, thereby decreasing customer churn and driving up the customer lifetime value (the total revenue per customer, in other words).
Barking Up the Business Intelligence Tree
Between business intelligence, data analytics, and data science, business intelligence is the simplest way to support decision-making, so let’s start there. In all honesty, until about 2013, the decision support function fell squarely within the responsibility of business intelligence (BI), which I can handily define for you as the practice of transforming raw, historical business data into meaningful reports, data visualizations, and dashboards that decision-makers can use to guide them in deciding how to proceed to reach the business’s goals. Within BI, business analysts (folks I discuss thoroughly in Chapter 9) use business intelligence tools to generate descriptive analytics — analytics based on historical and current data that seek to answer the question, “What happened in the near or distant past?” The goal of BI decision support products is to help decision-makers decide the next-best course of action based on what happened in the past.
The process by which business intelligence is useful in transforming raw data to improved profits is shown in Figure 12-2.
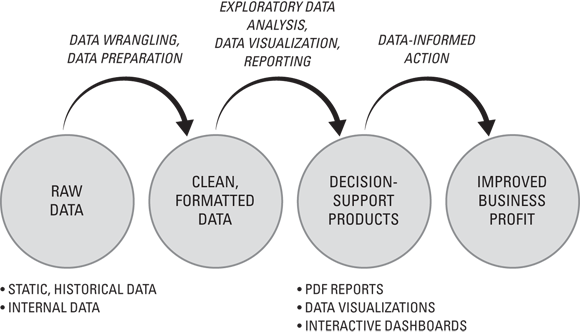
FIGURE 12-2: The business intelligence path within the data-to-dollars flowchart.
Four characteristics that help you distinguish BI from data analytics and data science — its more sophisticated cousins— are that BI generally involves these elements:
- Historical, static data: Most traditional BI tools are designed to generate decision support products from existing data sets that sit inside structured RDBMSs or
.csvfiles or within an Excel spreadsheet. They don't support real-time data, moving data, unstructured data, or messy data. Data sets must be cleaned, transformed, and settled into a static data container before you can use traditional BI tools to generate decision support products from it. - Internal data: Traditional BI utilizes internal data — data that's generated as a by-product of your company's operations or that's generated from systems that your company runs in the course of doing business.
- Mostly small and medium-size data sets: Traditional BI tools don’t accommodate huge data sets. If you want to generate BI products from huge data sets, you need to wrangle and reformat the data to smoosh it down to the size your tool can accommodate. (I have more on data-wrangling later in this chapter.)
- Tools, technologies, and skill sets: Certain keywords are a dead giveaway that someone is doing BI. Examples here are online analytical processing, ETL (extracting, transforming, and loading data from one database into another), data-warehousing, and information technology for business applications.
Figure 12-3 shows my favorite BI reporting tool that is used in my business, Segmetrics. (I use many BI reporting tools, but this is my favorite tool for rectifying marketing activities with their return on investment in terms of leads and sales for my business.)
Notice that this tool provides time stamps indicating when its source data was last updated. I've set up this BI tool so that, every two hours, it pulls structured data from various marketing and sales systems within my business. More specifically, it pulls only the most crucial sales and marketing data that I need from within these systems and leaves out all the rest. After that's done, it serves up the BI reports to me on a silver platter — interactive data tables, bar and line charts, and drill-downs. In this case, I am the business decision-maker, so I use the tool directly, but if I weren’t technically oriented and had a data analyst helping me, the tool would provide that person with easy-to-use features for generating PDF reports or pulling the data in .csv format for their own analytical needs. The best thing about this tool is that it comes preconfigured. I spent 5 minutes hooking up my data sources and it was ready to roll. Pretty cool, huh?
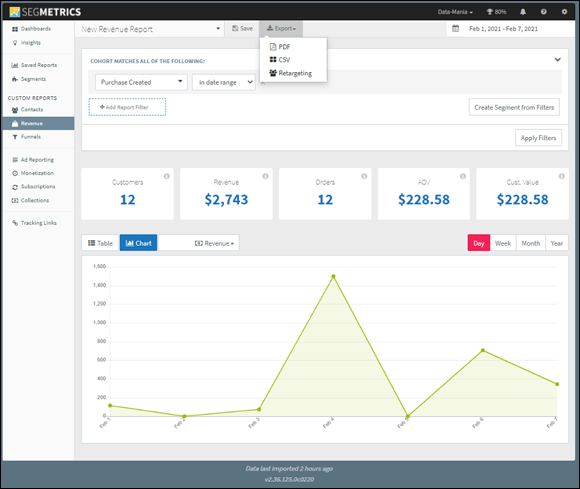
FIGURE 12-3: An example of a modern, SaaS BI tool.
Using Data Analytics to Support Decision-Making
When you're on the quest to help support and improve decision-making across a company, data science is usually an unnecessarily complex route. In most cases, you can gain the insights you need faster by just using an analytics or business intelligence tool. In this section, I talk about how data analytics can still fit into the journey between raw, messy data and the dollars generated for your business. Similar to BI, data analytics is the practice of converting raw data to a usable format and then analyzing it to generate answers to business questions. The few notable differences between BI and analytics are shown in Figure 12-4.
Analytics are different from BI in several ways, as this list makes clear.
- Support both real-time data and historical, static data: Analytics tools and techniques are more robust and sophisticated than traditional BI. You can use them to generate meaningful insights from real-time data moving through your systems as well as from existing data that sits static in a RDBMS.
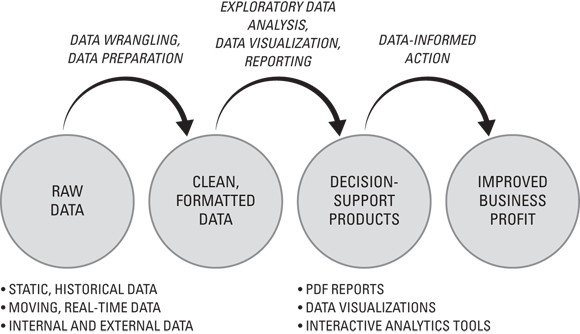
FIGURE 12-4: The analytics path within the data-to-dollars flowchart.
- Integrate external and internal data: A key feature of analytics is that they can accommodate for, and generate insights from, external data — data that’s highly relevant to your business but isn’t generated from within your business directly.
- Can be generated from any size data set, even if it’s unstructured: Because analytics are more sophisticated, you can build them inside, or on top of, all sorts of software environments, allowing you to create meaningful data visualizations from data of almost any volume and variety.
- Big data tools, technologies, and skill sets: Keywords that tend to represent data analytics include Hive, Pig, Spark, big data, machine learning, predictive analytics, NoSQL, MongoDB, online analytical processing (OLAP), and SAP Analytics.
The goal of analytics decision support products is to inform decision-makers about what happened in the past as well as what’s happening now so that they can use that information to make better decisions on behalf of their companies and hopefully increase their profitability. An excellent example of what a quintessential analytics tool looks like is shown in Figures 12-5 and 12-6.
You might immediately recognize Google Analytics (GA) here, because it’s one of the more popular data analytics tools. Part of that popularity lies in the fact that it offers real-time analytics about live activity on any web property where you’ve installed the GA tracking pixel. This tracking pixel collects website activity data and feeds it to the GA application. Additionally, GA integrates and generates analytics from relevant external data sources. (Refer to Figure 12-6.)
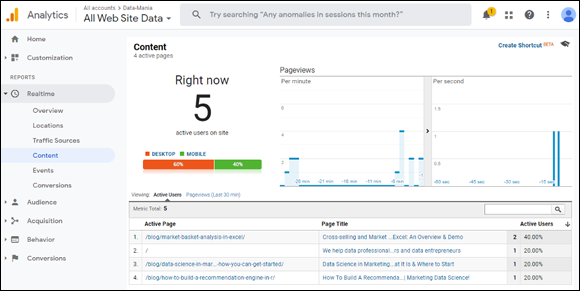
FIGURE 12-5: An example of analytics that report on real-time data.
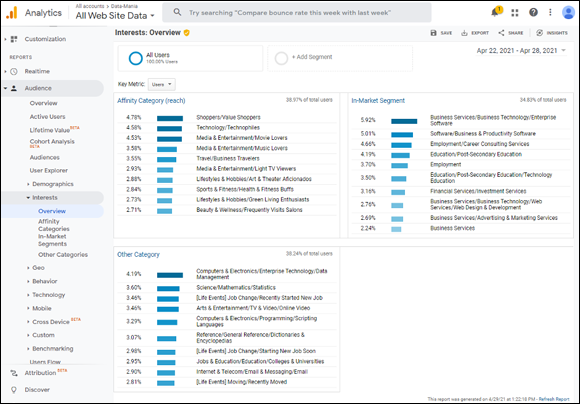
FIGURE 12-6: An example of analytics that report on external data.
Types of analytics
Data analytics isn’t a one-size-fits-all kind of enterprise — you have choices when it comes to the analytics type you want to generate. Listed here, in order of increasing complexity, are the four standard types (or categories) of data analytics:
- Descriptive analytics: This one answers the question, “What happened?” Descriptive analytics are based on historical and current data. Business analysts, data analysts, and data scientists all base modern-day business intelligence on descriptive analytics.
- Diagnostic analytics: You use this type of analytics to find answers to the question, “Why did this particular something happen?” or “What went wrong?” Diagnostic analytics are useful for deducing and inferring the success or failure of subcomponents of any data-driven initiative.
- Predictive analytics: Although this type of analytics is based on historical and current data, predictive analytics go one step further than descriptive analytics. Predictive analytics can be generated using the correlation methods I mention in Chapter 4, and this simpler type of predictive analytics can be built by data analysts. More sophisticated predictive analytics involve complex model-building and analysis to predict a future event or trend. In a business context, these more sophisticated analyses would be generally performed by the data scientist.
- Prescriptive analytics: This type of analytics aims to optimize processes, structures, and systems through informed action that’s based on predictive analytics — essentially telling you what you should do based on an informed estimation of what will happen. Both business analysts and data scientists can generate prescriptive analytics, but their methods and data sources differ.
Common challenges in analytics
Analytics commonly pose at least two challenges in the business enterprise: First, organizations often have difficulty finding new hires with analytics skills; second, even skilled analysts often have difficulty communicating complex insights in a way that makes intuitive sense to management decision makers.
To overcome these challenges, your organization must create and nurture a culture that values and accepts analytics products. The business must work to increase data literacy across all levels of the organization so that management not only has a basic concept of analytics but is also capable of seeing the successes that can be achieved by making well-informed decisions based on them. Conversely, data analysts and scientists must have a solid working knowledge about business in general and, in particular, a solid understanding of the business at hand. (For more on the need for a solid working knowledge of business, see Chapter 9.)
Data wrangling
Data-wrangling is another important portion of the work that’s required in order to have data yield decision-support insights. To build analytics from raw data, you almost always need to use data-wrangling — the processes and procedures you have to use in order to clean and convert data from one format and structure to another so that the data is accurate and in the format that analytics tools and scripts require for consumption. The following list highlights a few of the practices and issues I consider most relevant when it comes to data-wrangling:
- Data extraction: You have to first identify which data sets are relevant to the problem at hand and then extract sufficient quantities of the data that’s required to solve the problem. (This extraction process is commonly referred to as data mining.)
- Data preparation: Data preparation involves cleaning the raw data extracted via data mining and then converting it into a format that allows for a more convenient consumption of the data. (Six steps are involved, as you can see at the end of this section.)
-
Data governance: Data governance standards are used as a quality control measure to ensure that manual and automated data sources conform to the data standards of the model at hand. Data governance standards must be applied so that the data is at the right granularity when it’s stored and made ready for use.
 Granularity is a measure of a data set's level of detail. It is determined by the relative size of the subgroupings into which the data is divided. For instance, if you’re measuring brand loyalty for a certain product in the US is it going to be coarse-grained at the state or national level, or more fine-grained by neighborhood or ZIP code?
 - Data architecture: IT architecture is the key. If your data is isolated in separate, fixed repositories — those infamous data silos everybody complains about — then it’s available to only a few people within a particular line of business. Siloed data structures result in scenarios where a majority of an organization’s data is simply unavailable for use by most other people working in the company. (Needless to say, siloed data structures are incredibly wasteful and inefficient.)
-
Import.
Read relevant data sets into your application.
-
Clean.
Remove strays, duplicates, and out-of-range records, and also standardize casing.
-
Transform.
In this step, you treat missing values, deal with outliers, and scale your variables.
-
Process.
Processing your data involves data parsing, recoding of variables, recombining variables, and other methods of reformatting the data set to prepare it for analysis.
-
Log the data.
In this step, you simply create a record that describes the data set. This record should include descriptive statistics, information that describes variable formats, the data source, collection methods, and more. Once you generate this log, store it in a place you’ll remember, in case you need to share these details with other users of the processed data set.
-
Back it up.
The last data preparation step is to store a backup of this processed data set so that you have a clean, fresh version — no matter what.
Increasing Profit Margins with Data Science
At its core, the process of progressing from raw data to improved business profits is the same for data science as it is for analytics and business intelligence. You can see some important distinctions, though, in Figure 12-7.
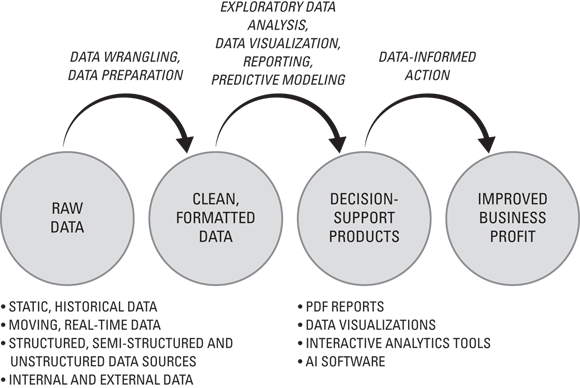
FIGURE 12-7: The data science path within the data-to-dollars flowchart.
Though the process is the same, with data science you can actually codify a decision engine and deploy it within a software product. This means that, in addition to producing PDF reports, data visualizations, and interactive analytics tools, data scientists are able to generate predictive insights that support decision-makers directly, by way of a software application. (In all honesty, you almost certainly need a software developer and a machine learning engineer to help with the software side of the equation if you really want to make that happen.) You can then deploy this decision engine on many people's machines across your company, thus enabling you to use one solution to improve decision-making for many workers. What’s more, you can take that same solution and sell access to it as a new product — thus generating new revenue streams on top of the improved revenues you're generating from better decision support systems. (For more on monetizing data, check out Chapter 14.)
Seeing which kinds of data are useful when using data science for decision support
You can use data science to derive business insights from standard-size sets of structured business data (just like BI) or from structured, semistructured, and unstructured sets of big data. Data science solutions aren’t confined to transactional data that sits in a relational database; you can use data science to create valuable decision support products from all available data sources, including these:
- Transactional business data: A tried-and-true data source, transactional business data is the type of structured data used in traditional BI. It includes management data, customer service data, sales and marketing data, operational data, and employee performance data.
- Social data related to the brand or business: The data covered by this rubric includes the unstructured data generated from email, instant messaging, and social networking such as Twitter, Facebook, LinkedIn, Pinterest, or Instagram.
-
Machine data from business operations: Machines automatically generate this unstructured data, like SCADA data, machine data, or sensor data.
 SCADA stands for Supervisory Control and Data Acquisition. SCADA systems are used to control remotely operating mechanical systems and equipment. They generate data that is used to monitor the operations of machines and equipment.
 - Audio, video, image, and PDF file data: These well-established formats are all sources of unstructured data. In the case study at the end of this chapter, you can see an incredible example of using data science to convert raw audio data to real-time decision support that decreases customer churn and increases customer lifetime value.
As with most topics, it's easier to show than to tell, so I've come up with a decision support use case for you to check out that utilizes data science and artificial intelligence to increase the lifetime value of customers. The next section gives the details.
Directing improved decision-making for call center agents
Data scientists build predictive models that convert real-time unstructured data into instantaneous real-time prescriptive analytics from within a software application that can be installed on an unlimited number of computers. I start off this particular discussion with a success story case study and then follow it up with the business and technology specifics that can support it.
Case study: Improving call center operations
Humana, which has provided health insurance to Americans for over 50 years, is a service company focused on fulfilling the needs of its customers. A great deal of Humana’s success as a company rides on customer satisfaction, and the frontline of that battle for customers’ hearts and minds is Humana’s customer service center.
From an operational perspective, call centers are hard to get right. Many emotions rise to the surface during a customer service call, especially one relating to health or health insurance. Sometimes people are frustrated, sometimes they’re upset, and sometimes the customer service agent (CSA) becomes aggravated and the overall tone and progression of the phone call go downhill, which is of course horrible for customer satisfaction.
THE NEED
Humana wanted to find a way to use artificial intelligence to monitor its phone calls and to help its CSAs do a better job of connecting with customers in order to improve customer satisfaction (and thus, customer retention rates and profit per customer).
THE ACTION
In light of its business need, Humana worked with Cogito, a company that specializes in voice analytics technology. Cogito offers a piece of AI technology called Cogito Dialogue, which has been trained to identify certain conversational cues as a way of helping the CSA and their supervisor stay actively engaged in a call with a customer. The AI listens to cues like the customer’s voice pitch: If it’s rising or if the CSA and the customer “talk over” each other, the dialogue tool sends out electronic alerts to the CSA during the call.
Humana fed the dialogue tool the customer service data from ten thousand calls and allowed it to analyze cues such as keywords, interruptions, and pauses, and then these cues were then linked with specific outcomes. For example, a representative who is receiving a particular type of cue is likely to earn a specific customer satisfaction result.
THE OUTCOME
Thanks to the data science project I outline in this section, Humana enjoyed a 28 percent increase in customer satisfaction and a 63 percent increase in employee engagement. From a revenue perspective, this project produced a net decrease in customer churn, and consequently, a significant increase in customer lifetime value. From a productivity perspective, this project improved both the employee engagement and the number of high-satisfaction outcomes per employee.
Customers were happier, and CSAs were more engaged. This automated solution for data analysis has now been deployed in 200 Humana call centers, and the company plans to roll it out to 100 percent of its centers. The initiative was so successful that Humana has been able to focus on the next steps in its data program. The company now plans to begin predicting the type of calls that are likely to remain unresolved so that they can forward those calls to management before they become frustrating to the customer and CSA alike.
What does Humana's success mean for you and your company? Well, if you’re looking for new ways to generate value by improving decision support for personnel at your company, this is proof that the perfect data use case is out there somewhere to show you how! It’s definitely worth taking a deeper look into the types of tools, technologies, and techniques that are running under the hood of this example. That’s where the use cases come in handy. Because this particular data project involves both customer sentiment analysis and decision support, you can see separate reconstructed business use cases for both aspects, shown in Table 12-1 and Table 12-2.
TABLE 12-1 Theoretical Business Use Case for Analyzing Customer Sentiment
|
A: Business use case |
|
Use case 1: Analyze customer sentiment |
|
B1: Description |
|
The system analyzes the sentiments of customers and CSAs who communicate by phone. The system collects data and generates reports. The aim is better customer retention and improved quality of customer handling. |
|
B2: Actors |
|
Primary actor: System Supporting actors
|
|
B3: Preconditions and post-conditions |
|
Preconditions
Post-conditions
|
|
C: Main success scenario |
|
Actor intention (basic flow)
Success scenario Data regarding customer sentiment and CSAs successfully collected, stored, and analyzed |
|
D: Industries and functions |
|
Industries: Finance / credit companies, retail industry, counselling organizations, hospitals Functions: Customer engagement, customer management, call center operations, counseling, critical care services, medical care services |
TABLE 12-2 Theoretical Business Use Case for Real-Time Decision Support
|
A: Business use case |
|
Use case 2 (decision support): Suggest action to CSA |
|
B1: Description |
|
Based on the data collected and analyzed on customer sentiments, the system offers real-time suggestions to arrive at courses of action that the CSA can take. |
|
B2: Actors |
|
Primary actor: System Supporting actor: CSA Offstage actor: Customer |
|
B3: Preconditions and post-conditions |
|
Preconditions
Post-conditions
|
|
Actor intention (basic flow)
Success scenario Real-time suggestions are offered in order to improve call management and customer management. |
|
D: Industries and functions |
|
Industries: Finance or credit companies, retail industry, counseling organizations, hospitals Functions: Customer engagement, customer management, call center operations, counseling, critical care services, medical care services |
Table 12-1 is all about defining the problem in search of a solution — more specifically, a data intensive solution. Table 12-2 spells out the decision support component of this particular data science project.
Tables are nice, but sometimes an illustration gets the point across quicker. Figure 12-8 breaks things down to a much simpler level by plotting out the use case diagram.
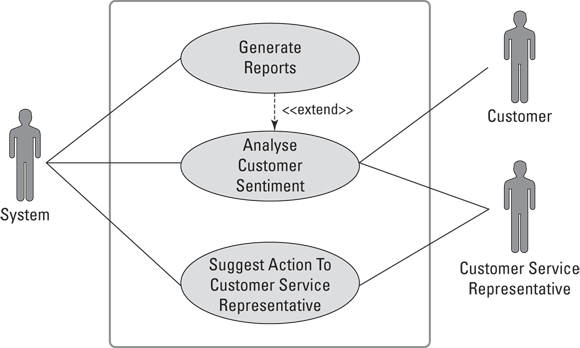
FIGURE 12-8: A business use case diagram for automated decision support AI for call center workers.
As for the data science and technologies that are likely required in order to make a system like this one function smoothly, I detail those in Table 12-3.
Naturally, data scientists and software engineers would be responsible for building the AI application that supports this use case. In this Humana example, however, they outsourced that data science and software engineering to the solution provider, Cogito. Imagine how much money you can save your company — and even make for your company — if you’re able to build and deploy a system like this one in-house!
TABLE 12-3 Theoretical Technology Stack for Automating Client Interactions
|
Technology Stack |
Data Management Cloud data management: Amazon Web Services: Athena On-premise / cloud / hybrid data management: Big data
Traditional data
Analytics and visualization tools
Machine Learning Technologies
|
|
Data Science Methodologies |
|
Discovering the tipping point where the old way stops working
I've talked a lot about how business intelligence, analytics, and data science can potentially function to improve decision-making across a company. Now it's time to talk about when it's most appropriate to use each of these approaches. In all honesty, it doesn’t matter whether you’re a data leader, a data implementer, or a data entrepreneur, you need to know how to use and generate BI and analytics decision support products — even if it's just to support your own decision-making. The good news is that if you’re already working with data regularly, BI and analytics are readily available to you without your company needing to sign off on a big budget. For business intelligence decision-support products, you can easily start off by creating them in Excel. As for analytics decision support products, those are a bit more sophisticated, but you can generate real-time analytics by using analytics software such as Tableau or Tableau Desktop.
 When preparing to analyze data and generate decision support insights, be sure to follow this 6-step data preparation process:
  A breach of data privacy is a huge financial risk. Unless you’ve secured someone’s official sign-off to use a SaaS tool on your company’s data, it’s a much better idea to gain permission and have the necessary software installed on your computer. If your company’s data becomes breached because you took unauthorized actions to upload it to the cloud, it can be grounds for termination. (For more on data privacy and ethics concerns, check out