Appendix C
Model Answers for Self-study Problems
C.1 Chapter 1
1. A chemical reaction reaches equilibrium when the rates of the forward and reverse reactions become equal and the concentrations of the reactants and products do not change with time.
2. We will assume the following molecular mass values:

a. Dissolve 0.59 gm NaCl into 100 mL water will give 0.1 M NaCl.
b. Dissolve 3.73 gm KCl in 1 liter of water, take 10 mL of this solution.
c. 9.53 gm of anhydrous MgCl2 dissolved into 100 mL will give 1 M.
d. 14.93 gm of the MgCl2 hydrate dissolved into 100 mL will give 1 M.
e. 0.373 gm of KCl dissolved into 100 mL of water gives 20 mM. Pipette 10 μL of this solution into 1 liter of water to give 2 μM KCl.
For practical preparations that involve the weighing of chemicals and the determination and dispensing of small solution volumes, the following guidelines are useful:
- A good, calibrated, analytical balance can weigh a 100 gm sample to an accuracy of ± 0.1 mg. (The more common top-loading balance can weigh 100 gm to a repeatability of ± 1 mg.)
- Class A calibrated glass cylinders can be used to an accuracy of ~1% (e.g. a 100 mL cylinder has graduations of 1 mL).
- Pipettes can dispense volumes ranging from 1 μL to 10 mL to an accuracy of ~1% (and better).
3. Two key properties of water that make it a good solvent for ionic and polar molecules are the polar form of the water molecule and its ability to form networks of hydrogen-bonds. This gives water a large relative permittivity (dielectric constant) value and excellent properties as a solvent for ionic salts because it can weaken the electrostatic interactions involved in ionic bonds to the point where the ionic crystal lattice dissociates into free ions. The ability of water to dissolve nonionic substances that possess polar chemical bonds (e.g. sugars and alcohol molecules) arises from it being able to form hydrogen bonds with such molecules. Organic molecules that are nonpolar and nonionic are not soluble in water.
4. A hydrogen bond is formed when an electropositive hydrogen atom is partially shared by two electronegative atoms, which for the case of water are oxygen atoms. The hydrogen in an H-bond can be thought of as a proton that has partially dissociated from a donor atom, allowing it to be shared with a second (acceptor) atom. An H-bond is strongest when a straight line can be drawn through the centres of its three participating atoms (OߝH...O). Common H-bonds in protein structures are of the form NߝH...O or NߝH...N, and water can weaken such bonds by forming competing H-bonds with the N or O atoms in these bonds.
Without its hydrogen-bond structure water would exist as a gas at room temperature rather than as a liquid.
5. On the assumption of 100% dissociation, then:
(a) pH = -log(1) = pH 0. (b) pH = -log(10−6) = pH 6. 0. (c) 10 mM NaOH dissociates to give [OH−] = 10−2M. At room temperature [H+][OH−] = 10−14, to give [H+] = 10−12 and a pH value of pH 12.
6. A pH value of pH 2.4 corresponds to a proton concentration
If fully dissociated [H+] should equal 1 M. A concentration of 4 × 10⁻³ M therefore indicates that the acid is only 0.4% dissociated. Acetic acid is thus a weak acid.
7. We can calculate the p
Ka value using the Henderson-Hasselbalch
equation (1.11):

8. We can define a base concentration factor α as:
Writing the Henderson-Hasselbalch equation in terms of α and differentiating, we obtain:


Thus:

.
The product α(1 − α) is a maximum, and thus
dpH/
dα a minimum, at α = 0.5. This corresponds to the situation [
A−] = [
HA], which from the Henderson-Hasselbalch equation corresponds to a value of
pH equal to the
pKa. The buffering capacity is thus a maximum at the
pKa. As a practical example, take the case of a solution of acetic or lactic acid (
pKa values of 4.76 and 3.86, respectively, and conjugate bases of acetate and lactate, respectively) to which is added a strong base such as sodium hydroxide. The resulting plots of
pH against added hydroxide will be of the forms of the curves shown in
Figure 1.5. At values of
pH removed from near the
pKa value, the
pH changes very rapidly with additions of small amounts of the hydroxide. However, near the
pKa the addition of the hydroxide base results in only small changes in pH. In other words, solutions of acetic and lactic acid are buffered at values of
pH near to their
pKa values.
C.2 Chapter 4
1.
a. The dye absorbs at wavelengths extending from red to yellow and extending into green, and also from violet into the ultraviolet. The dye therefore reflects and appears blue. (In fact the dye is methylene blue).
b. The molar extinction coefficient at 290 nm is ~ 4 × 10
4 M
−1 cm
−1. The absorbance at this wavelength is given by the Beer-Lambert law:

i. % Transmittance: T% = 100 antilog(−A) = 39.8%.
Therefore, percentage of incident radiation absorbed at 290 nm = 60.2%.
ii. % Transmittance at 420 nm ≈ 100%.
Therefore, percentage of incident radiation absorbed at 420 nm ≈ 0%.
iii. The molar extinction coefficient at 670 nm is ~ 8 × 10⁴ M−1 cm−1. The corresponding absorbance = 0.8.
% Transmittance: T% = 100 antilog(−A) = 15.85%.
Therefore, percentage of incident radiation absorbed at 670 nm = 84.15%.
iv. From the definition ε = 2.61 × 10²⁰ σ, the effective cross-sectional area σ of the methylene blue molecule at 670 nm = 3 × 10⁻¹⁶ cm2.
2.
a. d = 52.66 nm.
b. 0.37 Eo; 0.003 Eo.
c. Typically, the binding of an analyte to a biosensing agent (immobilised on the surface of a prism, glass slide or nanoparticle) is detected as the induced fluorescence of the analyte.
3. Absorbance
A = −log
T = −log(0.3) = 0.52.
From the Beer-Lambert law:

From the definition:

the effective cross-sectional area σ for the Cu2+ ion = 4 × 10⁻²⁰ cm2.
4. If
A and
AR have the same effective cross-sectional areas at resonance, then the ratio of their peak absorptions at wavelengths λ
AR and λ
R is:

From
Figure 4.22 the ratio of the two absorptions ≈ 0.8/0.3 ≈ 2.7.
With Keq = 2.2 × 10² M−1, the corresponding analyte concentration [A] = 12.2 mM.
1.
a. Eo: Standard reduction potential; n: number of electrons involved in the redox reaction; αOx and αR: activities (equal to the concentrations if low) of the oxidised and reduced species.
b. The factor corresponds to a voltage and has units of volts. Designating n = 1 indicates that the redox reaction involves a single electron transfer in the reaction.
2. The Nernst Equation applies to the reaction:

in which Ox is the oxidised species and R the reduced species of the redox couple.
Thus, for the reaction:

equations (c) and (d) are correct.
3.

(the copper electrode has a constant concentration (activity) of 1).
4.
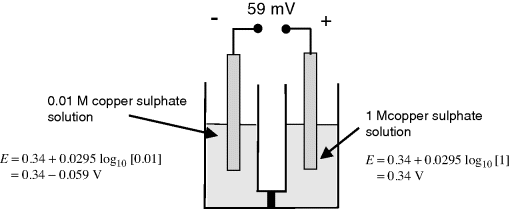
a. From the two relevant Nernst equations, we obtain a potential difference of 59 mV, with the polarity as shown above.
b. In the ½-cell with 1M copper sulphate the reaction direction is:

.
Copper ions deposit on the electrode and acquire electrons (are reduced). Copper atoms are deposited onto the electrode surface.
In the ½-cell with 0.01M copper sulphate the reaction direction is reversed:

Copper atoms dissolve into solution and give up electrons (are oxidised).
5. A reference electrode should have the following properties:
- It should be easy to make,
- It must provide a stable potential,
- It must be polarisable (ideally).
- It should have a low temperature coefficient.
6.
a. The equation:

contains the following parameters:
R: Universal gas constant (8.31 J K−1 mol−1);
T: Absolute temperature (Kelvin);
F: Faraday Constant (9.648 × 10⁴ C mol−1);
n: Number of electrons involved in the charge transfer reaction;
Io: The net charge transfer exchange current.
The derived units for Rct are [J A−2 s−1] = [V.A.A−2] = [V.A−1] = Ohms.
b. Rct is small when the exchange current Io is large, corresponding to a high charge transfer rate.
c. Apply a small sinusoidal voltage (≤ 5 mV pk.) across the working and counter electrode and measure the working electrode current. To ensure that there is a near linear current-voltage relationship, the area of the counter electrode should also be much larger than that of the working electrode.
d. 126 ohms.
7.
a. 2.6 kΩ and 20 Ω - both obtained by estimating the low frequency intercept of the semicircular arc on the Z′ axis (x-axis).
b. Apart from the impedance to current flow related to charge transfer at the electrode-solution interface, there is also effective impedance related to diffusion-controlled mass transfer. The left-hand Nyquist plot is indicative of an electrode reaction that is dominated by the kinetic control (electron tunnelling) of the overall charge transfer reaction at all the frequencies of measurement. For the right-hand plot we have a mass transport controlled impedance at the lower frequencies (the straight line portion of the plot) and kinetic control at higher frequencies.
1.
a. The
accuracy of a measurement defines how close the measured value is to the true value, while the
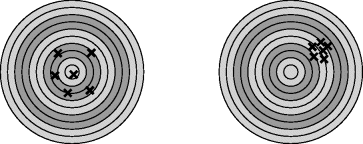
precision describes how the measured value changes with repeated measurements. You could just use a graph of the distribution of the results showing the accuracy (error in the mean) and the precision (spread of results) but a nice analogy involves a comparison with hits on a target in archery as shown in
Figure C.1
In the figure on the left the hits are accurate but imprecise, that is, they are centred on the bullseye but are well spread out. In the figure on the right the hits are more precise but less accurate, that is, they are grouped closely together but are not well aimed at the centre of the target.
b. Determining the accuracy and precision of a sensor will both require multiple measurements, typically made of a known ‘standard’ which will obviously change depending on what the sensor is measuring. For example with a pH sensor you would need one or more buffer solutions of known pH. Measurements need to be made with the same conditions and you need to be reasonably sure that the parameter being measured is not changing with time. Ideally the measurements would be made quickly to avoid any problems with drift in the sensor. The actual value of the standard isn't really important for measurement of precision, you just need to make enough measurements of an otherwise unchanging variable to determine the variance or standard deviation of the results. Determination of the accuracy will also require multiple measurements, unless of course you know for sure that the measurement is extremely precise, but the important figure here is the mean value of the parameter. The accuracy will be defined by the offset between the known value of the standard and the mean of the set of measurements. Of course these measurements will often only give you an idea of the accuracy and precision at one measurement point and it would be a good idea to have two or more standards to measure which are spread out along the range of values you expect to be using the sensor to measure.
c. This question could be more properly stated to ask how you would deal with these issues in a real sensor. Basically if the precision is poor then you need to make multiple measurements and take the average of these as your answer. The way to deal with an offset or inaccuracy is to measure this offset against a standard (or multiple standards) and calibrate the sensor instrumentation to remove this. If the offset is not a constant this might need to be done at several points.
2.
a. The parameters of the pH electrode equation are as follows:
E0 - Characteristic potential for the particular combination of glass electrode and reference electrode used
R -Universal gas constant = 8.314472(15) J K−1 mol−1
T -Absolute temperature (K)
F -Faraday constant = 9.64853399(24) × 104 C mol−1
Supplementary question: Where does the figure‘2.303’ come from and can you simplify the equation for T = 298 K (25 °C)?
c. In the linear region of
Figure 7.32 the output voltage varies by about 0.75 V over a pH range of 13, with a negative slope. Therefore the sensitivity is around −0.06 V pH
−1 (Nernst type response). In order to get an output resolution of 1 V pH
−1 we need an amplification factor
G of −16.67.
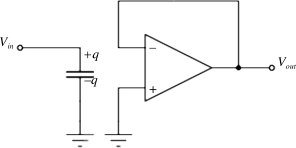
Because the output resistance of the pH sensor is very high, there is a problem with using an inverting amplifier which has a finite input impedance. One solution is to use a voltage follower or buffer between the sensor and the inverting amplifier as shown in
Figure C.3.
The gain of this circuit is given by the following equation:

For a gain of –16.67 using standard resistor values you could use:

but there are obviously many other possible solutions.
For a pH of 7 we can estimate the output voltage of the sensor to be around −0.42 V. The output of the amplifier will therefore be approximately 7 V which is a good confirmation that it's operating correctly.
d. The effective error in the output voltage will be equal to the input bias current (
Ib) multiplied by the feedback resistance
Rf. So that:

Therefore the error will be 20 nV for 1 pA bias current and 20 μV for 1 nA bias current.
3. The current required to charge a 10 μF capacitor by 1 V in 10 ms is:

Then, in order to drive 1 A through a 100 Ω resistor, a voltage of 100 V on the output of the amplifier connected to the counter electrode will be required. These are probably unrealistic numbers.
4. Using a Wheatstone bridge with the sensor taking the place of
R1, balance the bridge by making all the other resistors 1 kΩ. If we use a 5V supply for
Vs and
∂R1 is 10 Ω then
Vo will be ~12.5 mV using
equation (7.26). This is can be amplified using a buffered differential amplifier with a gain
G = 400. Alternatively the gain could be split between two amplifier stages or an instrumentation amplifier could be used. The output of the Wheatstone bridge may be positive or negative depending on which way round the differential amplifier is connected.
5. Rct can be estimated to be around 27 kΩ, then we can calculate the double layer capacitance using ω = 2πf = 1/RctCdl. It should be around 5.4 nF.
1.
a. The other resistors used in the bridge will also have some temperature dependence which will be confounded with that of the RTD if care is not taken. It would be very hard to control temperatures in an implanted device like that.
b. It is unlikely but if the temperature dependence of the other resistors can be made to be much much smaller than the measured device then this could almost be ignored.
c. The resistance of the electrical connections to the RTD become a problem. These could be balanced at one particular temperature but they may also have some temperature dependence that will cause an error in the measurement.
d. Current and voltage are separated in a four-terminal Kelvin measurement meaning that the resistance of the electrical connections should not impact on the measured resistance.
2.
a. 
b. This is obviously quite large and reflects the rather unrealistically high strain value.
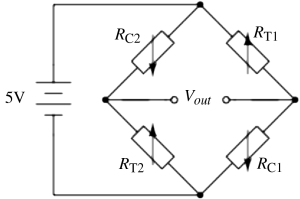
c. The gauges will be applied to the structure so that two are in compression (
RC1,
RC2) and two are in tension (
RT1,
RT2) these will be arranged so that they are opposite each other as in
figure C.4.
d. Assuming the same gauge factor as in (a) Δ
R will be 20 Ω. Then on one side of the bridge the divider voltage will be:

While on the other side it will be:

Therefore Vout will be 100mV.
e. If it is possible then attach one in compression (RC1) and one in tension (RT1) while the other two resistances will be standard resistors with values chosen to balance the unstrained gauges. The sensitivity will be halved so that the output for a strain of 1% will be 50mV. Alternatively if the gauges can only be used in compression then use RC1 and RC2 as in figure A8.1. Again the other two resistors will be unstrained and the output sensitivity will be halved compared to the full bridge implementation.
f. A variable resistor could be added to one arm of the circuit. This could be adjusted to give a zero output when the gauges are unstrained.
3.
a. The equations for the output voltages are as follows:
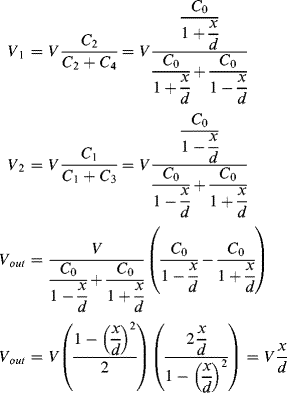
b. As the output is independent of C0 the output amplitude will be 0.05V
4. Figures C.5 and
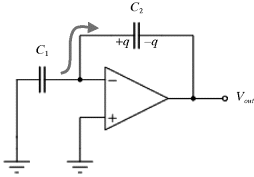
C.6 show the two different switch positions. In phase Φ1 (
Figure C.5)
C1 charges to
Vin so
QC1=
VinC1. Meanwhile
C2 is discharged. When the switches change to phase Φ2 (
Figure C.6)
C1will discharge and the current flow will charge up
C2but the direction of this will mean that:

So the transfer function is:

and this is an Inverting switched capacitor amplifier.
5.
a. Control voltage
Vin is applied and the resulting ion current
Ich flows through
Rf assuming the op-amp has very low input current. So the positive input to the diff. amplifier will be
V+= Vin– IchRf. The negative input of the diff. amplifier is connected to
Vin so the output will be:

b. Rf needs to be very large, for example a GΩ resistor would give output voltages in the mV range. Possible problems may include the time constant as a large resistor like that typically has a parallel parasitic capacitance.
c. Potassium channels are opened by applying a negative voltage step to simulate what happens when the membrane depolarises during an action potential event.
d. When it opens the K+ ions will flow out of the cell, which is equivalent to conventional current flowing out of the cell and through Rf. The output of the differential amplifier will be a negative voltage that is proportional to this current.
1. R = 10 kPa/(10−4/60) = 6 × 10⁹ Pa L−1s = 6 × 10¹² Pa m−3 s (units of Pressure/Volumetric flow)
2. This channel has a high aspect ratio (i.e. width
w 
height
h). The appropriate equation to calculate the fluidic resistance
R of thea rectangular microchannel is:

a. For a channel of width 100 μm, height 10 μm, and length L of 2 cm, filled with a solution of viscosity (η) 10
−3 Pa s, the corresponding value for
R is:

b. The pressure drop required to give a flow of 0.1 μl/sec is:

3.
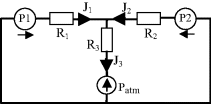
a. Apply Kirchhoff's rules to the electrical analogue of the fluidic Y-connector shown below:
(1) 
(2) 
(Define ΔP1 = P1 − P
atm.)
(3) 
(Define ΔP2 = P2 − Patm.)
Substituting J1 obtained from (2) and J2 obtained from (3) into (1):
we obtain J
3 = (ΔP1 − R
3J
3)/R
1 + (ΔP2 − R
3J
3)/R
2
(4) 
b. With R
1 = R
2 = 10
14 Pa m
−3 s, R
3 = 2 × 10
15 Pa m
−3 s, P1 = 200 kPa, P2 = 150 kPa, and P
atm = 100 kPa

4. The origin of the propulsive force is the surface tension (units of force per unit length) acting tangentially to the boat–water interface. The surface line element can be drawn as a closed loop around the boat. For a uniform surface tension the net surface tension force acting around this loop is zero. If, however, a surface tension gradient is produced a net force will act on the surface element and distort it through an induced flow of surface liquid. Surface tension gradients can arise from the presence of a surfactant, such as soap.
5. In a sufficiently narrow capillary of circular cross-section (radius
r), the interface between a fluid and the capillary surface forms a meniscus (surface tension
T) that is a portion of the surface of a sphere with radius
R. The pressure jump Δ
P across this surface is:

The radius of the sphere will be a function only of the contact angle θ, which in turn depends on the exact properties of the fluid and the solid with which it is in contact:

so that the pressure difference may be written as:

.
To maintain hydrostatic equilibrium, the induced capillary pressure is balanced by a change in height,
h, of the fluid (this height change can be positive or negative, depending on whether the contact angle is less or greater than 90°). At equilibrium:

Using this formula, the height to which water will rise in a glass tube of radius 50 μm, with
T = 7.3 × 10
−2 N m
−1, θ = 30°, ρ = 1000 kg m
−3,
g = 9.8 m s
−2, is given by:


 .
. .
.


 .
.
 contains the following parameters:




 height




 .
.

 = M1/2·L−1/2·t−1.


 ,
,


 is defined as the Drag Coefficient.)

 (this is related to the Reynolds Number).
 .
.