Chapter 4
Spectroscopic Techniques
4.1 Chapter Overview
Spectroscopic techniques are widely employed in biosensors and biomedical tests. The majority of these are photometric, simple examples of which include monitoring changes of the colour of a pH indicator, or of an analyte as it reacts with an immobilised reagent. More complicated examples include monitoring the intensity of reflected radiation in a surface plasmon resonance device, or ratio metric measurement of Förster energy resonance transfer between two chromophores. The electromagnetic waves used in photometric sensors range from frequencies as high as 1015 Hz down to 109 Hz. Most optical-based sensing techniques offer the significant advantage over electronic ones in that the transmission of photometric information through optical cables or space is not susceptible to electrical interference. A form of spectroscopy increasingly employed in electrochemical-based sensors is known as impedance spectroscopy. In this technique the effective charge-transfer resistance at the sensing electrode of a device can be monitored and quantified by measuring its electrical impedance for frequencies at the opposite end of the electromagnetic scale (typically 100 kHz to sub-hertz frequencies). In this chapter the theoretical and practical fundamentals of the various forms of spectroscopy will be described and serve as the background for the photometric biosensors described in Chapters 6 and 7.
After reading this chapter readers will gain a basic understanding of:
4.2 Introduction
Photometric spectroscopy is the analysis of the electromagnetic (EM) radiation absorbed, emitted or scattered by atoms or molecules when they undergo transitions between discrete energy states. EM radiation can be considered to consist of individual photons of energy E given by:

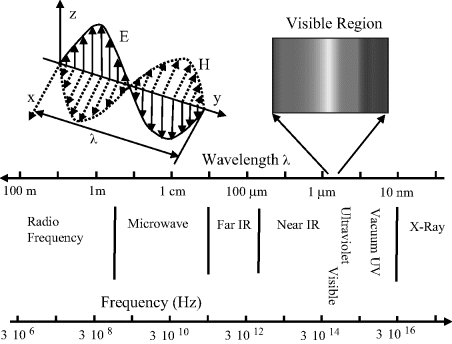
where h is Planck's constant (h = 6.62 × 10⁻³⁴ J s) and c is the velocity of light in a vacuum (c = 3 × 10⁸ m/s). The radiation takes the form of orthogonally associated electric and magnetic waves, which as shown in Figure 4.1 extend from low energy radio waves up to and beyond high energy X-rays. Propagated EM waves have a frequency of oscillation ν and wavelength λ related through the equation c = νλ. As detailed in Table 4.1, the region of the EM spectrum visible to the human eye is restricted to a narrow range of energies, corresponding to wavelengths from ~400 nm (violet) to ~700 nm (red). Spectroscopists often present their data as plots of absorption, or emission, or light scattering intensity as a function of either the radiation wavelength or the wavenumber (given by the reciprocal of wavelength, often expressed in units of cm−1).
Table 4.1 The colours, wavelengths and frequencies of light in the visible region of the EM spectrum.
| Colour | Wavelength (λ) (nm) | Frequency (ν) Hz/1014 |
| Ultraviolet | <300 | >10 |
| Violet | 390 | 7.7 |
| Blue | 450 | 6.7 |
| Green | 520 | 5.8 |
| Yellow | 580 | 5.2 |
| Red | 700 | 4.3 |
| Infrared | >1000 | <3.0 |
Figure 4.1 Electromagnetic (EM) radiation consists of orthogonal electric (E) and magnetic (H) fields that can propagate as sine waves over a wide range of frequencies. The visible region (λ = 400–700 nm) occupies a narrow part of this range.
4.2.1 Electronic and Molecular Energy Transitions
In Chapter 1 the chemical bonds in a molecule are described as the sharing of electrons between the nuclei of adjacent atoms. Fluctuating motions of electrons in molecular orbitals can give rise to attractive dipole-dipole (van der Waals) interactions between adjacent molecules, whereas the positive charges carried by the nuclei give rise to repulsive forces. The combination of these attractive and repulsive Coulombic forces leads to an equilibrium distance between nuclei and creates a stable molecular structure (see Figure 1.2 in Chapter 1).
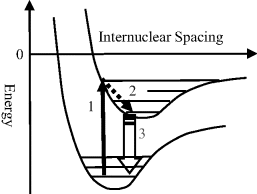
According to quantum mechanical theory molecules possess discrete states, or quanta, of energy. These states are called the energy levels of the atom or molecule. Changes in energy can arise from the redistribution of electrons within molecular orbitals and also, as depicted in Figure 4.2, as a result of perturbations (vibrations) of their chemical bond lengths or changes of molecular rotation. Each of these energy transitions occur with characteristic time scales across a wide range of energies. The energies involved in changing electron distributions are of the order of several electron volts with time scales in the range 10−14 to 10−17 seconds. Vibrational energy levels are separated by around 0.04 to 0.4 eV (timescales of ~10−13 s to 10−14 s) and rotational transitions typically involve energies at most one-tenth of this, with timescales from around 10−12 s to 10−10 s. Electronic redistributions between orbitals, and changes of the vibrational and rotational motions of molecules, can be induced by light (electromagnetic radiation) and studied by spectroscopy. Examples of such transitions are shown in Figure 4.3. In Chapter 3 we learnt that the factor kT corresponds to the mean thermodynamic energy available to a particle when it is in equilibrium with its environment at temperature T (k is the Boltzmann constant). At room temperature kT has a value of 0.025 eV. From this we can deduce that electronic transitions can only occur from the ground electronic state, whereas many rotational states are already ‘occupied’ at room temperature and so rotational transitions can occur from a wide range of energy levels, not only from the ground state. Analysis of the electromagnetic radiation absorbed, emitted or scattered by atoms or molecules as they undergo transitions between two discrete energy states can provide information about the electronic structure of atoms, as well as the bond lengths, bond angles and bond strengths of molecules.
Figure 4.2 Electronic transitions in atoms and molecules, and bonded nuclei exhibit vibrational and rotational motions across a wide range of time scales.
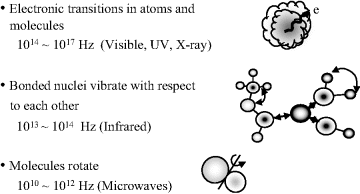
Figure 4.3 Electronic transitions between molecular energy levels can include: (1) absorption of light leading to the excitation of an electron to a higher energy level; (2) relaxation to a lower energy state as a result of energy lost to molecular vibrations; (3) radiative decay (fluorescence) back down to the ground state.
4.2.2 Luminescence
This is a general term for the emission of radiation from a cool object (incandescence is the emission of light from hot metals, as for example from the filament of a light bulb). The two main categories of luminescence that can be excited by optical irradiation are fluorescence and phosphorescence, whilst luminescence arising from a chemical reaction is known as chemiluminescence.
4.2.3 Chemiluminescence
This is the emission of light driven by a chemical reaction, of which the most common natural form is bioluminescence employed by some aquatic animals to hunt for food (e.g. angler fish), by some insects (e.g. glow worms, fireflies) to attract mates, and by some marine microorganisms to signal distress.
4.2.4 Fluorescence and Phosphorescence
These are the two modes of radiative decay of electronically excited states. Electronically excited states have a finite lifetime, and in most cases the energy of excitation is dissipated into random thermal motions of surrounding atoms with no luminescence observed. However, the excited state may also lose energy through radiative decay accompanied by the emission of a photon as the electron falls back to its lowest orbital energy state (see Figure 4.3). If photon emission occurs directly from the excited state following absorption of the excitation radiation it is known as fluorescence. Fluorescence is therefore a very fast response and disappears rapidly after the radiation being absorbed is switched off. If there is a time delay following absorption of the excitation radiation, the photon emission is known as phosphorescence. The delay associated with phosphorescence is a consequence of an electron in its excited state reversing its spin to form what is termed an excited triplet state (two electrons having parallel spins instead of antiparallel spins in a singlet state). This reversal of spin can occur as a result of spin-orbital coupling with an adjacent large atom. This excited triplet state can lose energy through thermal exchange with the surrounding solvent until it reaches the lowest triplet energy. The direct transfer of a triplet state down to its ground singlet state is forbidden and so the energy associated with the excited triplet state remains stored until a spin reversal again takes place through spin-orbital coupling with the large atom. At this point the energy released on getting back to the ground state is released as radiation (phosphorescence).
Naturally fluorescent biomolecules include those containing haem (iron containing) and redox proteins (e.g. haemoglobin, myoglobin, cytochrome-c, ferredoxins, rhodopsin) and pigments such as fluorescein, flavins, coumarin and cyanine. The chemical group in these molecules responsible for the fluorescence is called a fluorophore. Such groups will absorb radiation of a specific wavelength and re-emit radiation at a longer wavelength, whose value is dependent on the amount of energy lost in the transition according to the nature of the fluorophore and to some extent its chemical environment. An important example of a protein fluorophore was first identified and isolated from the jellyfish Aequorea victoria – namely the green fluorescent protein (GFP) which exhibits bright green fluorescence when exposed to blue light. The GFP gene can be inserted into a cell or organism, and the subsequent appearance of green fluorescence indicates that the gene of interest has been successfully taken up and expressed by the cell or organism under study [1]. This has been achieved for a wide range of bacteria, cell types, fungi and plants, flies, fish and animals, and has been applied to many important applications. For example, proteins are too small to be observed even under an electron microscope, but their fluorescence can readily be observed. Thus, by infecting a T-cell with HIV containing GFP labelled proteins researchers have found how HIV proteins pass from an infected cell to a noninfected cell. Furthermore, the fusion of GFP and GFP-like proteins to another protein does not alter the function or location of the protein in a cell. This has been used to follow the differentiation and proliferation of cells during embryonic development. A new scientific field known as optogenetics has evolved from GFP technology and is now routinely used by neuroscientists to study and control the switching on and off of individual neurons in a brain. The 2008 Nobel Prise in Chemistry was awarded to those (Martin Chalfie, Osamu Shimomura and Roger Tsien) who pioneered this GFP technology.
4.3 Classes of Spectroscopy
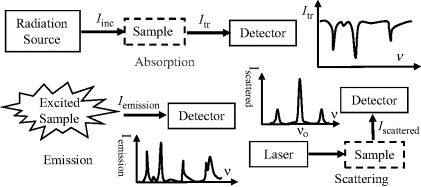
The various classes of spectroscopy involve different kinds of interaction of incident EM radiation with a test sample. The basic modes of practical operation and output spectra for the three main classes of optical spectroscopy (absorption, emission, scattering) are summarised in Figure 4.4.
Figure 4.4 The three main classes of spectroscopy (absorption, emission, scattering) differ with respect to their mode of operation and output spectra.
The absorption, emission and scattering of EM radiation can only result if there is an interaction between the electric or magnetic field component of the EM radiation with the atomic or molecular structure of the test sample. The conditions that allow for interactions with the electric field component of the EM radiation can be summarised as follows:
- Atoms or molecules can absorb EM radiation if its energy exactly matches that required to excite an electron from its ground state up to a higher energy state. This corresponds to electronic spectroscopy and is illustrated in Figure 4.5. Radiation will be re-emitted at the same frequency as the incident EM radiation, and if ~180° out of phase with it will result in an attenuation of the incident radiation.
- Molecules can absorb EM radiation and produce vibrational transitions if this absorption results in a change in the dipole moment of a molecule during its vibration. This corresponds to vibrational spectroscopy.
- Molecules in the gaseous state can absorb EM radiation and lead to rotational transitions only if they possess either a permanent electric or magnetic dipole moment. This gives rise to rotational spectroscopy.
The corresponding conditions for interactions with the magnetic field component are:
- Atoms or molecules can absorb EM radiation if they possess permanent magnetic dipole moments or magnetic moments associated with the spin states of electrons or nuclei.
Raman spectroscopy, named after the Indian scientist C.V. Raman, is used to study vibrational and rotational transitions and relies on inelastic scattering (Raman scattering) of monochromatic light, usually produced by a laser of wavelengths fixed at a value that can extend from the near ultraviolet through the visible and into the near infrared. Interaction of the laser light with vibrational or rotational modes of a molecule excites the molecule from the ground state to a virtual energy state. When the molecule relaxes it emits a photon and returns to a different rotational or vibrational state. The difference between the original state and the final state results in the energy of the emitted radiation being shifted up or down from that of the incident radiation. If the final vibrational state energy of the molecule is greater than the initial ground state, then from the principle of conservation of energy the emitted photon will be shifted to a lower frequency. This shift in frequency is termed as a Stokes shift. If the final vibrational state is less energetic than the intitial state, the emitted photon is shifted to a higher frequency in what is termed as an anti-Stokes shift. The condition required for rotational Raman spectroscopy is that the molecule must have an anisotropic polarisability. The polarisability of a molecule is a measure of the extent to which it is distorted in an electric field. For a single atom this polarisability is isotropic, the distortion of the atom is the same irrespective of the direction of the applied field. Most molecules, however, exhibit anisotropic polarisabilities, their polarisability does depend on the field direction. This allows Raman rotational spectroscopy to be performed on molecules that do not posses a permanent electric or magnetic dipole moment, as required for normal rotational (microwave) spectroscopy. For vibrational Raman spectroscopy to occur the polarisability should change as the molecule vibrates. This condition exists for most molecules, including homonuclear diatomic molecules that do not posses a permanent dipole moment and are therefore not able to be examined by normal vibrational (infrared) spectroscopy.
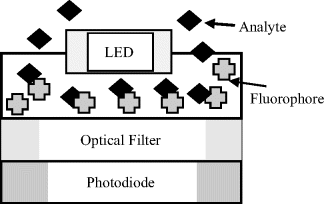
Spectroscopic instruments can take on various forms of complexity in their design. Designs that can readily be miniaturised are of particular interest to designers and users of biosensors, and examples that fall into this category are shown in Figures 4.6 and 4.7
Figure 4.5 Incident EM radiation of energy equal to a transition between two electron energy levels in an atom will be absorbed and then re-emitted. The re-emitted radiation will occur at the same frequency, and if ~180° out of phase with the incident radiation will be attenuated.
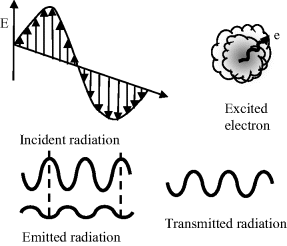
Figure 4.6 In this schematic of an absorbance spectrometer, a light beam passing through the test sample is reflected off an elliptical mirror at the rear of the sample container onto a grating polychromator and analysed by a linear array of photodiodes.
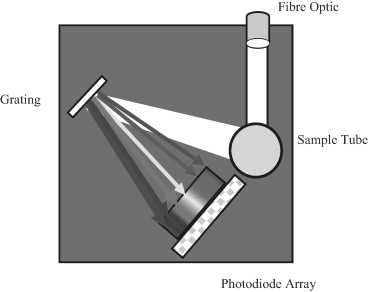
Figure 4.7 A solid-state fluorometer for detecting the change of fluorescence of a fluorophore on combination with a target analyte molecule.
4.3.1 Electronic Spectroscopy
This is the measurement of the absorption or emission of EM radiation associated with transitions of electrons between energy states in an atom or molecule. Transitions between the ground, the lowest most stable, state and higher states of an atom involve energies in the X-ray region of the EM spectrum. Those of relevance to biosensors mostly correspond to energies in the UV and visible regions, and are associated with the excitation of electrons between energy levels characteristic of the molecular structure. Examples of this include the excitations that give rise to the colours of pigments, dyes, plants and flowers. The absorption spectra for two forms of chlorophyll are shown in Figure 4.8.
Figure 4.8 Absorption peaks for chlorophyll lie in the red and blue regions of the visible spectrum, and arise from electronic transitions. Leaves that contain chlorophyll therefore reflect green light, which is the colour of white light with red and blue light removed.
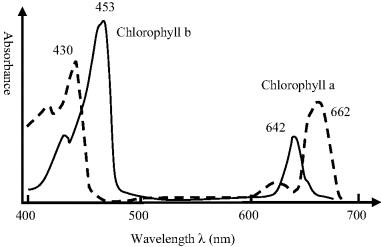
Leaves containing chlorophyll absorb wavelengths in the red and blue regions of the visible spectrum, and so reflect colours in the green region. Chlorophyll is not a very stable compound and is continually synthesised, a process requiring sunlight and warmth. Leaves therefore lose their chlorophyll molecules in Autumn. Another pigment often found in leaves is carotene, which absorbs blue-green and blue light and so reflects in the yellow part of the spectrum. Carotene, which can protect chlorophyll from oxidative damage and whose energy of light absorbed is transferred to chlorophyll, is more stable and persists in leaves when the chlorophyll disappears. Anthocyanins, which absorb blue, blue-green and green light and so reflect in the orange and red region, are produced when sugars in the leaves increase sufficiently to react with certain proteins. The changing colours of leaves during Autumn result from the disappearance of chlorophyll and the retention of the carotene and anthocyanin pigments. The rule to remember is that if a substance absorbs in the visible range, it will be seen as the complementary colour to that absorbed. A material absorbing in the red will be seen as green since red and green are complementary colours. A complementary colour corresponds to the colour of white light if that colour is removed. Thus, if a solution appears yellow or blue, respectively, it has a chromophore absorbing in the purple or orange, respectively.
The group of atoms in a molecule most strongly involved in absorption of radiation is called a chromophore. An important example is the C=C double bond whose action as a chromophore arises from optical excitation of one of the electrons forming the double bond (called a π-electron) into an antibonding π* orbital (chemists refer to this as a π to π-star transition). The absorption required for this electronic transition is in the UV. When the C=C double bond is part of a linear chain of conjugated carbon atoms (ߝC=CߝC=Cߝ) the π,π* absorption shifts towards longer wavelengths and into the visible part of the spectrum. The retina of the eye contains a chromophore known as ‘visual purple’, which consists of a conjugated compound (retinol) attached to a protein that absorbs over the entire visible region.
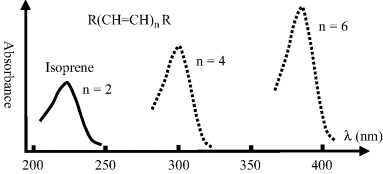
Chromophores with increasingly more complex chemical structures exhibit absorption peaks that increasingly move towards longer wavelengths and exhibit more intense absorption peaks. This last effect is mainly associated with the increase in molecular size, and thus of the effective cross-sectional area presented as resonant absorbing sites for incident photons. A simple representation of this is shown in Figure 4.9.
Figure 4.9 A schematic to show how the absorption spectrum of a linear conjugated hydrocarbon compound increases in absorbance magnitude and wavelength as the number of double bonds (n) increases. Isoprene with two double bonds has an absorption peak at 220 nm in the UV. β-carotene (from carrots) with n = 9 absorbs most strongly between 400–500 nm in the green-blue part of the spectrum.
An important concept in understanding spectra obtained by electronic spectroscopy is known as the Frank-Condon Principle. This is based on the fact that nuclei are far more massive than electrons, so that the assumption can be made that during the time taken by an electron to transition between energy states the nuclei do not change their internuclear positions. This is the basis for representing the initial excitation and final radiative transition back to the ground state as vertical lines in Figure 4.3. When an electron is excited into a higher molecular energy level, this can alter the electronic spatial distribution and hence the coulomb forces that determine the equilibrium length of a chemical bond. The situation shown in Figure 4.3 implies that the internuclear distance increases during the time period where the excited electron lost energy in interactions with vibrations of the molecule.
4.3.2 Vibrational Spectroscopy
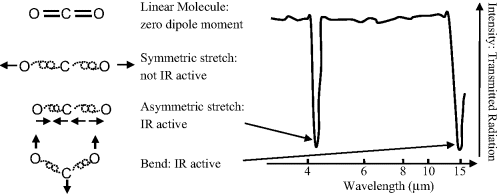
Vibrational transitions, involving the stretching, bending or other forms of deformation of chemical bonds only produce an absorption or emission spectrum if the vibration interacts with EM radiation. Apart from the special case of Raman spectroscopy, this dictates that there must be a change in the dipole moment of the molecule. Energy levels between vibrational states are closer together than molecular orbital levels, so that transitions between vibrational energy states result in emission or absorption of energies in the infrared, rather than the visible, region of the EM spectrum. Diatomic molecules composed of dissimilar atoms (e.g. CO, HCl, NO, HF) produce vibrational (infrared) spectra because the magnitude of the permanent electric dipole moment changes as the bond length changes during vibration. However, homonuclear diatomic molecules (H2, O2, N2, Cl2, Br2, I2, F2) do not produce infrared spectra because they do not possess a permanent dipole moment, and one is not produced during vibration. A molecule does not have to possess a permanent dipole moment to be infrared active. For example, because of its linear symmetry the carbon dioxide molecule does not possess a permanent dipole moment, but as shown in Figure 4.10 an asymmetrical stretching or bending of this molecule results in the appearance of a dipole moment and the presence of infrared absorptions.
Figure 4.10 A molecule that does not possess a permanent dipole moment can be infrared active. Although the carbon dioxide molecule does not possess a permanent dipole moment, asymmetrical stretching or bending results in a dipole moment and an associated infrared absorption.
If the two atoms of a chemical bond are displaced slightly from their equilibrium separation, the force acting to restore their original positions is to a first approximation proportional to the change in the bond length. The two atoms can thus be treated as two point masses connected by a massless spring, corresponding to the classic example of a harmonic oscillator. For two atom masses m1 and m2, and a spring force constant k (a measure of the chemical bond strength), the frequency of harmonic oscillation is given by:
As for all atomic and molecular energies, the vibrational energy levels are quantised. The allowed vibrational energy levels are given by:

where h is Planck's constant. The selection rule for allowed transitions between vibrational energy levels is Δn =± 1 (a positive transition corresponds to absorption of energy from a lower to higher energy level, a negative one to emission). The transitional energy between vibrational states with quantum numbers n + 1 and n is therefore:

The transition energy is thus independent of quantum number, so that all transitions associated with a particular molecular vibration occur at a single frequency given by Equation (4.1). Molecules with strong bonds (large k) between low mass atoms have high vibrational frequencies. Vibrations involving the bending of bonds tend to occur at lower frequencies (higher wavelengths) than stretching vibrations because they are generally less stiff. This is exemplified in Figure 4.10 for the carbon dioxide molecule.
At high vibrational excitations the separation of the atoms in a bond may extend so far beyond their normal equilibrium locations that the assumption they occupy a parabolic energy well, and hence exhibit harmonic motion, is no longer valid. This behaviour is termed anharmonicity and results in the allowed energy levels becoming closer together than described here.
4.3.3 Rotational Spectroscopy
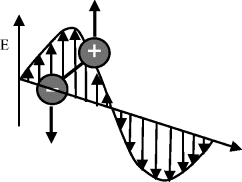
This class of spectroscopy is also known as microwave spectroscopy. As shown in Figure 4.11, if a molecule possesses a permanent dipole moment (i.e. it is a polar molecule) it can experience a rotational torque when exposed to an electric field, causing it to rotate more quickly (in excitation) or more slowly (in de-excitation). If a molecule, such as the oxygen molecule, does not have a permanent electric dipole moment but does possess a magnetic dipole moment, it can couple to the magnetic field component of EM radiation and exhibit rotational absorption.
Figure 4.11 A molecule possessing a permanent dipole moment can interact with the electric field component of EM radiation, inducing a rotational torque which can cause its rotation rate to increase or decrease.
The classical rotational kinetic energy of a molecule is expressed in terms of angular momentum J and rotational inertia I:
The quantised angular momentum number J (J = 0, 1, 2, ...) when inserted into Equation (4.2) gives the energy of rotation confined to the values:

The absorption and emission of EM radiation associated with changes in molecular rotation typically occurs at microwave frequencies. Rotational spectroscopy is practical only in the gas phase, where changes in rotation correspond to transitions between the molecule's rotational quantum numbers. In gases at high pressure, or in liquids and solids, the rotational motion is usually quenched due to molecular collisions.
Molecules can undergo a change in rotational energy at the same time as a change in vibrational energy, and this can be studied spectroscopically. The combination of the vibrational and rotational energy is given by:

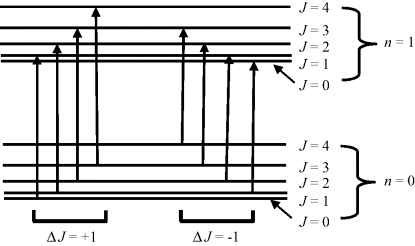
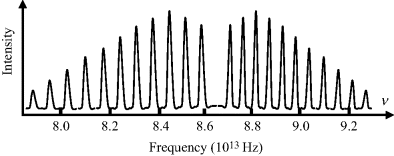
The allowed transitions between vibrational and rotational energy levels, and their combination, are shown in Figure 4.12.
Figure 4.12 The allowed transitions between energy states for molecules experiencing a combination of vibrational and rotational energy changes. The Δl = 0 transition is forbidden.
The classic example of a combined vibrational and rotational absorption spectrum is that exhibited by the HCl molecule, a schematic of which is shown in Figure 4.13. The absorption peaks correspond to the allowed energy transitions shown in Figure 4.12. The spacing between the absorption peaks shown in Figure 4.13 can be used to compute the rotational inertia I of Equation (4.2). It should be noted that the peak corresponding to the central frequency, given by Equation (4.1), is absent from the absorption spectrum. This is the direct result of the selection rule for rotational spectroscopy that the molecule must posses a permanent dipole moment. During a rotational energy transition the transition dipole moment must not vanish and there must also be conservation of angular momentum when a photon (which possesses angular momentum) is emitted or absorbed by a molecule. These conditions are only met for rotational transitions ΔJ = ± 1. The transition ΔJ = 0 is forbidden.
Figure 4.13 A schematic of the combined vibrational-rotational absorption spectrum for HCl, corresponding to the allowed transitions shown in Figure 4.11. The absence of the central frequency peak results from the Δl = 0 transition being forbidden (based on [2, 3]).
4.3.4 Raman Spectroscopy
We have noted that the selection rule for rotational Raman spectra is that the molecule must possess an anisotropic polarisability. It must experience nonsymmetrical distortion in an electric field. A distortion of a molecule in an electric field will return to that form after a rotation of 180° in the field, in other words twice every cycle. This leads to a quantised rotational Raman selection rule of ΔJ = ± 2. When the molecule makes a transition with ΔJ = +2, the emitted photon has a lower frequency than the incident photon that excited the molecule, producing what is known as a Stokes shift. When the molecule makes a transition with ΔJ =− 2, the emitted photon leaves the molecule with higher energy than the incident photon. There is an effective transfer of rotational energy from the molecule to the incident light beam, and the scattered light of higher frequency produces what are known as anti-Stokes lines.
If the molecules to be examined by Raman spectroscopy are adsorbed onto a roughened metal surface, or a surface coated with metallic nanoparticles, the intensity of the Raman signal is increased. This is considered to primarily arise from an excitation in the metal surface of collective electronic oscillations known as plasmons, which in turn magnifies the electric field component E of the incident radiation, and is known as surface enhanced Raman spectroscopy. It is particularly effective if the surface features have dimensions smaller than the wavelength of the incident radiation, and when the plasmon frequency is in resonance with the incident radiation. The energy of the incident radiation that excites the Raman modes, and that of the emitted Raman signal, is each enhanced by a factor that is proportional to E2. The total enhancement is thus proportional to E4, and if both the incident and emitted radiation frequencies are close to the plasmon resonant frequency the total enhancement can be as great as 1010. This permits the detection of single molecules by Raman spectroscopy.
4.3.5 Total Internal Reflection Fluorescence (TIRF)
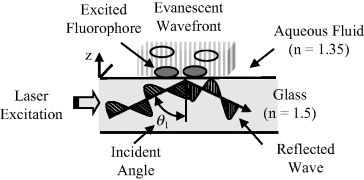
TIRF has been used in various forms of biosensor. The basics of this are outlined in Figure 4.14, to show a laser light beam propagating along a glass waveguide, which can take the form of a microscope slide, for example. Total internal reflection of this light beam is possible if the refractive index n of the glass is larger than that of the medium making contact with the glass. Thus, should a light beam propagating through glass (n = 1.5) strike an interface with an aqueous medium (n = 1.35) at a sufficiently high angle of incidence it is refracted along a direction that is parallel to the interface. This refractive behaviour is governed by Snell's law:
Figure 4.14 Total internal reflection fluorescence (TIRF) makes use of the EM evanescent wave generated by the interference between an incident and reflected light wave. Total internal reflection occurs above a critical angle of incidence, provided that the refractive index n of the light guide is greater than that of the adjacent medium. Excitation of fluorophores by the evanescent wave is confined to a region within ~100 nm from the waveguide-fluid interface. In this case two of the four fluorophores shown are excited.

where θ1 is the angle of the incident beam in the medium of higher refractive index n1 and θ2 is the refracted beam angle in the lower-index n2 medium. At the critical angle of incidence the refraction direction becomes parallel to the interface between the two media (90° relative to the normal), so that the critical angle is given by:

For our case of the light passing from glass (n1 = 1.5) to an aqueous medium (n2 = 1.35) this gives θc = 64.15°. At a larger angle of incidence than this the incident light beam is totally reflected back into the glass waveguide.
If the reflected wave has the same amplitude as the incident one, the incident and reflected components of the magnetic field vector parallel to the boundary of light incidence, and that of the magnetic flux density perpendicular to this boundary, superimpose destructively. The electric field components parallel to the boundary plane (x-direction) will however superimpose constructively. There can therefore be no solution of Maxwell's equations at the boundary plane without a nonvanishing transmitted wave. However, the incident and reflected waves have equal energy and so the principle of energy conservation demands that the transmitted wave cannot be a sinusoidal travelling wave. The only possible solution is that the transmitted wave is a standing wave that decays exponentially – in other words an evanescent wave. The solution for the electric field E beyond the interface (neglecting its time dependence) is given by [4]:

where k = (2π/λ)n2 sin θ is the component of the wave vector in the z-direction parallel to the interface, and λ is the vacuum wavelength of the light beam. The vector amplitude of the transmitted field A depends on the amplitude and the polarisation of the incident field, and the angle of incidence. The characteristic attenuation distance d depends on the angle of incidence, and is given by:

At distance d (often referred to as the penetration depth) the magnitude of the evanescent electric field vector drops to 1/e (i.e. 0.37) of its initial value at the interface. The intensity of the evanescent wave is:

where C is a constant for a given polarisation of the incident light beam. For incident radiation of wavelength λ = 450 nm, for example, the value for d is 304 nm (for n1 = 1.5, n2 = 1.35, θ1 = 66°). At distances z = 10 and 300 nm from the interface, respectively, the evanescent wave intensity I will have fallen by 6% and 86%, respectively. The effective penetration depth of the evanescent wave decreases rapidly as the angle of incidence increases, and this can be adjusted to obtain the desired degree of penetration. For example, with θ1 = 70° in our present example, d = 176.8 nm and the corresponding evanescent wave intensity at a distance of 300 nm will have fallen by 97%. Thus, the evanescent wave does not effectively extend beyond a distance of several hundreds of nanometers into the adjacent medium, and typically less than a distance equal to the wavelength of the incident light.
In a typical biosensor application, the biosensing agent (e.g. an antibody or specific RNA sequence) is immobilised onto a glass slide or polymer film that acts as the waveguide for the incident light beam (e.g. [5–7]). If the glass slide is thin enough, multiple internal reflections can be generated along the slide. The zigzag path of the guided beam produces a periodic evanescent wave intensity distribution, each area of which can be ‘spotted’ with a different antibody to provide multiple analyses of different analytes. If a divergent light beam is used, with a small spread of incident angles, a homogeneous intensity distribution can be obtained after a long enough pathlength. The binding of analytes to the surfaces of nanoparticles can also be studied, where incident light is totally reflected within the particles (e.g. [8]). Fluorophores, potentially able to be excited into fluorescence by a wavelength within the bandwidth of the incident laser beam, are introduced into an aqueous medium in contact with the functionalised surface. These fluorophores have also been designed to bind specifically to the target analyte, and because the evanescent field intensity falls off exponentially this provides a very sensitive method for detecting the binding of the analyte with the surface immobilised sensing agent. Excitation of fluorophores in the bulk of the aqueous medium is avoided, thus confining the fluorescence emission to a very thin region and giving a much higher signal-to-noise ratio than is achieved compared to conventional fluorescence techniques. The fluorescence can be collected and detected using the optics of a microscope focussed onto the surface of the glass slide.
4.3.6 Nuclear Magnetic Resonance (NMR) Spectroscopy
NMR measures the resonant absorption of radiofrequency radiation when nuclei (with nonzero spin angular momentum) undergo a transition between spin states whose energies have been separated by an externally applied magnetic field. A nucleus with nonzero spin behaves like a magnet. In the presence of a magnetic field B the states acquire different values of energy:

where g is a numerical g-factor that is a measured characteristic of the nuclei. The parameter μN is known as the nuclear magneton, and its value is inversely proportional to the mass of the nucleus. For example, the two spin states (mI = ½ and mI =− ½) of a hydrogen  nucleus in a magnetic field are separated by energy:

More nuclei will be in the lower of the two energies (according to the Boltzmann distribution law). EM radiation of energy resonant with the energy separation induces transitions between the spin states and is strongly absorbed. The resonance frequency,  , is proportional to the strength of the applied magnetic field and is in the radiofrequency region of the spectrum. Inductive search coils are used to provide and detect the radiofrequency signals.
NMR provides information on the different chemical environments of nuclei in a molecule. The nuclear magnetic moments of a nucleus will interact with the local magnetic field. This local field differs from the actual applied field because electronic orbital angular momentum induced in neighbouring nuclei by the applied field produces currents that create small additional magnetic fields. The resonance condition for a particular nucleus therefore depends on the magnitude of this additional induced field, and the shift away from the resonance condition defined by the applied field is known as the chemical shift of the nuclei. The magnitude of the resonance absorption is proportional to the number of equivalent nuclei in the same environment. Coupling between the magnetic moments of neighbouring nuclei produces fine structure in the absorbance signals and can be deciphered to give information of the magnetic and hence chemical environment of the molecule.
NMR in the form of Magnetic Resonance Imaging (MRI) or Magnetic Resonance Tomography (MRT) is used for medical imaging. This utilises the spin magnetic moment possessed by protons in water, as well as the fact that protons in different tissues relax back to their equilibrium states at different rates. The density of proton nuclear spins; the relaxation times (T1 and T2) that characterise the way that the spins relax back to their thermal equilibrium populations; spectral chemical shifts arising from interactions of proton magnetic moments with the moments of other types of nuclei; are used to construct images. MRI is particularly useful for imaging soft tissue (for which X-ray imaging is not effective) of high water content and little density contrast, such as the brain, muscle, connective tissue and tumours.
4.3.7 Electron Spin Resonance (ESR) Spectroscopy
ESR, or electron paramagnetic resonance (EPR) as it is also called, is analogous to NMR spectroscopy. The magnetic fields at which molecules containing unpaired electrons come into resonance with monochromatic radiation is studied. Molecules possessing unpaired electrons are termed paramagnetic, there magnetic moments align with an externally applied magnetic field. An electron possesses half-integral (½) spin angular momentum, which gives rise to two possible spin orientations distinguished by the quantum numbers ms = +½ and ms = −½. In the absence of an externally applied electric field the energies of these two orientations of the electron magnetic moment are equal, and as for NMR a magnetic field is used to cause separation of their energies. Transitions between the two states are induced by the absorption of EM radiation resonant with the energy separation.
The energy separation of the two electron spin orientations is proportional to the Bohr magneton, which takes the same form as the nuclear magneton but instead is inversely proportional to the mass of an electron. The mass of an electron is 1837 times smaller than that of a proton, and so the energy separation of the two electron spin orientations is greater for a given applied magnetic field than for nuclear spin orientations. Therefore, ESR resonance absorptions occur in the microwave rather than the radiofrequency region of the spectrum. The microwave generation and detection is performed using waveguides.
ESR differs from NMR in an important respect. The Pauli exclusion principle requires that whenever two electrons occupy one orbital their spins must be paired. It is therefore only possible to reorientate the spin of an electron if the electron is unpaired, and so ESR is restricted to chemical species with an odd number of electrons (radicals, so-called triplet states, and d-metal complexes). The intensity of an ESR absorption obtained for a sample will be proportional to the concentration of unpaired electrons present. ESR signals can show hyperfine structure that depend on the degree of coupling of the unpaired electron with magnetic nuclei, and this can therefore provide information on the electronic structure of radicals. If a reagent does not possess an unpaired electron, it can be ‘spin-labelled’ by incorporating into it a known paramagnetic molecule.
4.3.8 Surface Plasmon Resonance (SPR)
The excitation of surface plasmons by light to produce a surface plasmon-polariton is termed as surface plasmon resonance. Plasmons are quasi-particles arising from the quantisation of the harmonic oscillations of free electrons in a metal about the fixed positive charges of its crystal lattice. Surface plasmons are collective electronic oscillations that are confined to a metal surface and can interact strongly with incident polarised light to create polaritons. Coupling of light (photons) into surface plasmons can be achieved using a prism or optical grating to match the photon and surface plasmon wave vectors. A schematic of this is shown in Figure 4.15.
Figure 4.15 At a critical angle of light incidence the photons interact with surface plasmons in a metal film to create polaritons. This critical angle is sensitive to changes of the refractive index of the adjacent medium probed by the created evanescent wave, and changes of this (e.g. caused by analyte capture to an immobilised probe) can be monitored as a change in reflected light intensity.
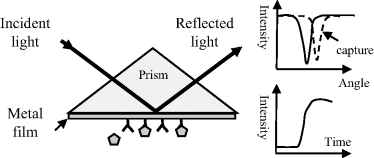
Basically, a laser beam is focused onto a thin (≤50 nm) metal film deposited onto a glass prism. At a critical angle of incidence of the light beam, energy is absorbed by the metal to excite the surface plasmons into resonance, and the intensity of the reflected light beam is significantly reduced. This strong coupling of the electric field component of the photon beam with the plasmons produces polaritons that are able to conduct along the metal surface. An evanescent EM wave is also created that decays exponentially from the metal surface into the adjacent medium, such as air or an aqueous fluid. EM radiation (light) of frequency below a plasmon resonance is reflected because the electrons screen the electric field component of the radiation, but at higher frequencies they are unable to respond fast enough and the light is transmitted. In most metals plasmon resonances occur in the ultraviolet, giving them a shiny appearance in visible light. For metals such as gold and copper, the resonances occur in the visible range and the metal takes on its characteristic colour.
The angle of incidence of the light beam to achieve the plasmon resonance is very sensitive to any changes of the effective dielectric properties (i.e. the refractive index) of the medium adjacent to the metal surface and within the influence of the evanescent wave. Changes of surface refractive index can result from the adsorption of molecules to the metal's surface, or by the capture of an analyte to a ligand attached to this surface. These effects can be monitored by observing changes in the critical angle of incidence, or more sensitively by detecting the sharp increase of the reflected light intensity as it shifts away from its original minimum value.
4.3.9 Förster Resonance Energy Transfer (FRET)
Named after Theodor Förster, the German scientist who formulated the original theory, this is the process whereby an electronically excited chromophore may transfer energy (without the emission of radiation) to a neighbouring chromophore as a result of the alignment and coupling of their dipoles. When the two chromophores are fluorescent, the term fluorescence resonance energy transfer is sometimes used. This resonance interaction does not involve a collision of the two chromophores, and also occurs without conversion to thermal energy by way of induced molecular vibrations. The donor is the chromophore that absorbs the incident radiation energy, and the acceptor is the one that eventually receives this energy. For this resonance transfer to occur efficiently there must be an overlap of the emission spectrum of the donor chromophore with the adsorption spectrum of the acceptor. The separation distance between the two chromophores should also typically be no more than a critical distance (of the order 10 nm) and the FRET efficiency also depends on the degree of parallel alignment of the donor emission dipole moment and the acceptor adsorption dipole moment.
FRET leads to a decrease in fluorescence intensity of the donor chromophore and to the lifetime of its excited state. The fluorescence intensity of the acceptor is also increased. This means that FRET can be quantified as a ratio-metric determination of the two fluorescent signals. If the acceptor does not fluoresce, the resonant energy transfer can be monitored as a quenching of the donor fluorescence. Both of these methods can be employed in biosensor designs. For example, the acceptor molecule can be immobilised and fluorescence monitored to detect the presence of a donor analyte. Genetically encoded GFP and related fluorescent dye proteins have been employed in FRET measurements in biological cells, to monitor protein–protein interactions as well as the annealing of RNA oligonucleotides, for example. FRET activity can also be used to monitor the action potentials of neurons and heart muscle cells. The donor chromophore is a phospholipid-based molecule that binds only to the extracellular surface of the cytoplasmic cell membrane, whilst the acceptor molecule is a negatively charged hydrophobic molecule that can bind to either the external or internal membrane surface. Excitable cells such as neurons in their resting state have a membrane potential of ~70 mV with respect to the extracellular medium, and so the negatively charged acceptor molecules prefer to be located on the outer membrane surface, along with the anchored donor molecules. If the cells are radiated with light absorbed by the donor molecules, FRET activity can be detected as the characteristic fluorescence emission of the acceptor. An induced action potential will cause the membrane potential to reverse polarity (depolarises) to a value of ~+30 mV. The acceptor molecules will now be repelled from the outer membrane surface, and attracted across the membrane to the positive internal surface. This transition can occur in less than half a second. At a donor-acceptor separation distance equal to that of the membrane thickness, FRET can no longer take place. This sequence of events is depicted in Figure 4.16, for the example where the donor can be excited to emit a red fluorescence, and the acceptor blue fluorescence. In the resting membrane state the donor and acceptor molecules can be close enough for FRET to take place, and blue fluorescence is emitted by the acceptor. When the cell undergoes an action potential event, the donor and acceptor molecules are separated and only the red fluorescence of the donor is evident.
Figure 4.16 The behaviour of electrically excitable cells can be studied by monitoring how the blue fluorescence of a negatively charged acceptor molecule ceases when the membrane potential reverses polarity during an action potential event. The resting state is characterised (in this example) by emitted blue fluorescence arising from FRET from the excited donor molecule, which when energetically uncoupled from the acceptor through their separation being greater than the critical distance fluoresces in the red.
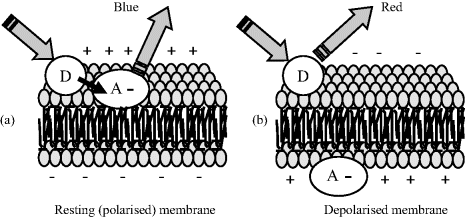
The FRET procedure (also known as voltage sensitive dye imaging) depicted in Figure 4.16 has been used to identify neuron circuits that underlie rhythmic patterns of electrical output in nerve fibres [9]; the optical recording of individual neuron action potentials and synaptic potentials [10]; and the electrical activity of heart muscle cells [11]. Further examples of the application of FRET are given in Chapter 8.
4.4 The Beer-Lambert Law
The Beer-Lambert law, also known as Beer's law, relates the optical absorbance A of a chemical analyte to its concentration [C]. This law is usually given as the linear relationship:

where a(λ) is a wavelength-dependent absorption coefficient, and l is the optical path length through the analyte sample. If the concentration [C] is given in terms of molarity, this equation becomes:
where ε is the molar absorption coefficient with units of M−1 cm−1. Ultraviolet, visible and infrared spectrometers usually display the absorption data in terms of transmittance T or %-transmittance. Transmittance T is defined as:

where Iinc is the incident light intensity, and Itr is the light intensity after it has been transmitted through the sample. The relation between absorbance A and transmittance T can be derived using the scheme described in Figure 4.17.
Figure 4.17 A sample of length l, containing resonating absorbing species, subjected to incident light of intensity Iinc, exits the sample as transmitted light of intensity Itr. An infinitesimally thin slice dx absorbs light of intensity dI.
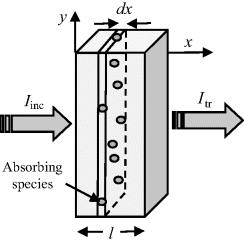
In Figure 4.17 a sample of length l is shown that contains N absorbing species per cm3. Incident light of intensity Iinc enters the sample at x = 0, and leaves it at x = l as transmitted light of intensity Itr. We will assume that each individual absorbing species at resonance presents a cross-sectional area σ to photons passing through the sample. (Typically σ ~ 10−16 cm2 for molecules.) At the resonant frequency, photons striking this molecular area are totally absorbed (they operate as black objects), but otherwise the photons continue passing through the sample. It is also assumed that the solution containing the analyte molecules does not absorb radiation over the range of wavelengths employed in the spectroscopic analysis. Assigning the light intensity incident on an infinitesimally thin slice dx at x = x to be Ix, and dI to be the intensity absorbed in this slice, the fraction of light absorbed per unit area of the slice is equal to σN dx. The fraction of light transmitted per unit area is thus:

For the whole sample length we need to sum up (integrate) this result:

to give:

or

The relationship between the absorbance A and transmittance T is defined as:
The concentration [C] of the absorbing species is given by:

(Nav = Avogadro's Number = 6.022 × 10²³). Equation (4.4) can therefore be written as:
Defining the molar absorption coefficient ε = 2.61 × 10²⁰σ (M−1 cm−1) then from Equation (4.5) we obtain the Beer-Lambert law given by Equation (4.1). Absorption peaks in the visible and ultraviolet range of wavelengths typically correspond to values for ε of 104 ~ 105 M−1 cm−1. The molar absorption coefficient has units expressed in terms of the reciprocal of the product of concentration and optical path length. This can also be given in units of cm2 mmol−1 (1 M−1 cm−1 = 1 cm2 mmol−1) to more clearly indicate that ε is a molar cross-section for absorption. The larger the effective cross-sectional area of a molecule at resonance, the larger will be the reduction of the intensity of an incident light beam.


4.4.1 Limitations of the Beer-Lambert Law
For a fixed optical pathlength through a sample, the linear relationship between absorbance and concentration given by Equation (4.1) no longer holds at very high values of the absorbance. The critical level for this will depend on the concentration of the analyte and its molar absorption coefficient. A value of [C] larger than around 10 mM often merits caution in this respect. At high concentrations analyte molecules in close proximity with each other can experience electrostatic interactions, which can alter the absorbance coefficient ε as well as the refractive index of the sample. At higher concentrations and longer pathlengths there is also an increasing probability that two or more absorbing species will lie in the same optical path. This will lead to an underestimate of the molar absorption coefficient. The chemical equilibrium of some samples (e.g. dissociation of molecular salts) can also shift with increasing concentration. Active fluorescence or phosphorescence of the sample, as well as the scattering of light by particulate matter can also limit the linearity of the Beer-Lambert law. Practical limitations can also occur as a result of stray light entering the sample or the optical system. Because the absorbance coefficient ε is a function of wavelength, the use of nonmonochromatic radiation can lead to errors. This can be minimised if measurements can be made in a wavelength region close to a maximum absorption band having a relatively flat profile. The incident radiation should also take the form of parallel light rays, all of which travel the same distance through the sample.
 . The chemical equilibrium constant K is known for this reaction. Can the analyte concentration be determined by measuring the height of the distinct absorption peak of the AR complex?
 R
R of the immobilised reagent is given by the sum of the free reagent available for the reaction and the amount already present in the complex:
 1/K), Equation (4.9) predicts that the absorbance will be proportional to [A]. With increasing analyte concentration the absorbance will increase and approach a constant level for [A]
  1/K.
1/K.
4.5 Impedance Spectroscopy
This form of spectroscopy does not involve the interaction of EM radiation with a test sample. The principle method of impedance spectroscopy is measurement of the alternating current (ac) resistance of a system. This is usually accomplished by applying a small amplitude ac voltage perturbation and detecting the ac current response. Small perturbations are studied to ensure that the system is exhibiting as near to a linear response as possible (see Figure 4.18). The term impedance spectroscopy is used because the current response is determined for a range of ac frequencies, rather than for only one set frequency. The impedance Z of the system is defined as the ratio of the voltage-time signal V(t) to the induced current-time signal I(t):
Figure 4.18 Sinusoidal voltage and current waveforms, with the current (I) lagging the voltage (V) by ϕ radians.
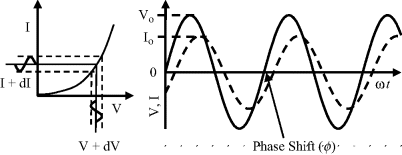
where Vo and Io are the peak values of the ac voltage and current signals, ω is the angular frequency (2πf) and ϕ is the phase shift between the current-time and voltage-time signals. These relationships are shown in Figure 4.18.
In complex notation, and making use of Euler's relationship, Equation (4.11) can be written as:

where j = √−1. The impedance is thus a complex quantity having real (Re) and imaginary (Im) components, commonly expressed as follows:
(4.12) 
For electrochemical and biosensor applications of impedance spectroscopy, the real component is associated with a resistance element R, and the imaginary component with a capacitance C having reactance X (=1/(jωC). A system comprising of resistance and reactance will exhibit an impedance of the form:
where Ro and R∞ are the limiting low- and high-frequency values of the equivalent series resistance, and τ is a characteristic time constant (τ = RC). Representing the complex impedance of a RC system in the form Z = R − jX, these series components are
Equation (4.13) can be written in the form:

with

In the complex plane u and v are orientated 90° to each other, with a vector sum equal to the real and constant quantity (Ro − R∞). The right angle included by u and v is thus inscribed in a semicircle of radius (Ro − R∞)/2, which represents the locus of all values of the effective resistance R and reactance X as ω varies from a very low to a high frequency. The locus is a semicircle, and not a circle, because the capacitive reactance is only a negative quantity. A semicircle of this form, centred at x1, is described by the equation:
By eliminating (ωτ)2 from the two equations of (4.14) we can derive the following relationship:
On adding [(Ro − R∞)/2]2 to both sides of Equation (4.16) a relationship of the same form as Equation (4.15) can also be derived:
For a simple series RC system the locus of all values of the effective resistance R and reactance X, as we proceed from low to high frequencies, will thus be a semicircle of radius (Ro − R∞)/2 with its centre at (Ro + R∞)/2. The maximum value for X is (−[(Ro − R∞)/2]), with a corresponding value of R = ([(Ro + R∞)/2]), and occurs at the frequency where ωτ = 1.
Impedance spectroscopy can be applied to the study and analysis of a wide range of materials such as dielectric or ionic solids and liquids, as well as electrochemical reactions whose fundamental properties can be modelled as a series of combined electrical circuit analogues. A simple dielectric material, containing one type of dipole species and where electrode polarisation effects can be neglected, can be represented as a parallel combination of a resistance R and capacitance C. The frequency dependent complex impedance of such a system can be presented as a complex plane impedance plot (frequently misnamed as a Nyquist diagram in the electrochemistry literature) of Z′ versus Z″ as shown in Figure 4.19. The ideal shape of the arc shown in Figure 4.19 is a semicircle with its centre on the real axis of the complex impedance plane. At very low frequencies the capacitive reactance (1/ωC) is very large, equivalent to an open circuit, and the absolute impedance |Z| is equal to the resistance R, with the phase angle ϕ = 0°. At very high frequencies the capacitive reactance becomes negligibly small, acting as a short circuit across the resistor, and |Z| = 0, with ϕ = 90°. These data can also be presented as a Bode plot, where unlike the complex impedance plot the frequency information is shown explicitly as either the logarithm of absolute impedance |Z| or phase angle ϕ plotted as a function log frequency.
Figure 4.19 The complex impedance Z of a simple RC network, as a function of frequency, can be represented as a plot of the real and imaginary components of Z.
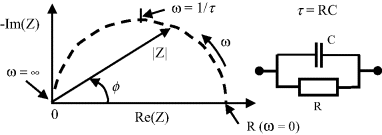
For materials containing mobile ions and where electrode reactions can occur, the equivalent electrical circuit becomes more complicated so as to take into account not only the bulk RC properties, but also electrode reactions, diffusion of ions and their adsorption at electrodes, and possible ion-pairing or other charge recombination effects. The major task is then to identify the most suitable physico-chemical model to adopt and if possible assign this to a pertinent equivalent circuit. This last task is often not straightforward – for example it can be shown by topological analysis [12] that 11 nonidentical circuits can give any single impedance versus frequency characteristic! Physicochemical insight is therefore required to identify which circuit is applicable.
The parallel RC circuit shown in Figure 4.19 can commonly represent the geometrical capacitance and bulk resistance of a sample, leading to the concept of a dielectric relaxation time τ = RC of the material. Parallel RC responses are also representative of an electrode reaction, where we can define a reaction resistance and a capacitance associated with an electrical double-layer at the electrode surface. An equivalent circuit of the form shown in Figure 4.20 can be used to represent the combination of a geometrical capacitance and a bulk resistance in series with an electrode reaction. The bulk resistance is shown is series with the parallel electrode reaction because the charging and discharging of the electrical double layer involves charge transfer with the bulk material. If the associated RC time constants for the bulk dielectric relaxation time and the electrode reaction are well separated, then the Nyquist plot will take the form of two separated semicircles. In the more general case where there is an overlap of the time constants, the complex impedance plane plot takes the form shown in Figure 4.20.
Figure 4.20 A plot of the complex impedance of an equivalent circuit representing a system consisting of bulk resistance Rb, a geometrical capacitance Cb, and a parallel combination of Re and Ce, to represent an electrode reaction characterised by a reaction resistance and an electrical double-layer capacitance.
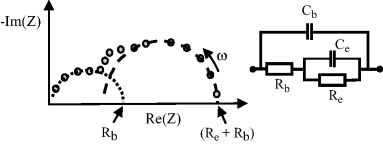
The arcs shown in Figures 4.19 and 4.20 rarely take the form of semicircles with centres located on the real axis of the complex impedance plane. One common cause of this is the presence of diffusion controlled processes, for example, in the system under study. These processes can appear as distributed resistance and capacitance elements having a spread of relaxation times, or as frequency-dependent resistance elements. A procedure to analyse inclined or depressed semicircular arcs is described by Lemaitre et al. [13].
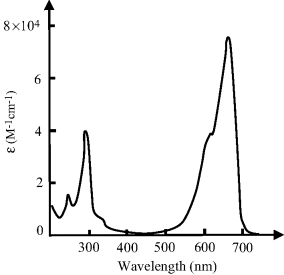
4.1 Figure 4.21 shows the absorption spectrum for a 10 μM solution of a dye dissolved in water, obtained using a 1 cm quartz cuvette. Peak absorptions are observed at 290 and 670 nm.
Figure 4.21 The absorption spectrum exhibited by a dye molecule. What is the observed colour of this dye?.
4.2 The evanescent wave in TIRF spectroscopy decays exponentially in energy with penetration depth, with a characteristic distance d given by:

4.3 The Cu2+ ion is the chromophore responsible for the visible absorption of copper sulphate (CuSO4) in aqueous solution. Using a 5 mm cuvette, the transmittance of 0.1 M CuSO4 at a wavelength of 600 nm was determined to be 0.3. Calculate the molar absorption coefficient of solvated Cu2+ and its effective cross-sectional area for photon capture.
4.4 A sensor operates by detecting changes in the intensity of light transmitted through a transparent substrate. A reagent R, immobilised on this substrate, selectively complexes with the target analyte A according to the reaction:

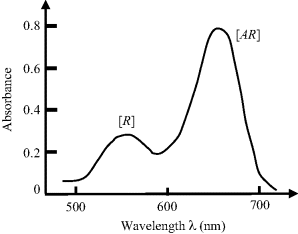
Based on the absorption spectrum shown in Figure 4.22, estimate the concentration of the analyte in the test sample. Assume that the effective cross-sectional areas of the R and AR chromophores are the same at their peak absorption wavelengths.
Figure 4.22 Absorption spectrum of light passing through a transparent substrate on which an immobilised a reagent (R) reacts with a target analyte (A) to form a chemical complex AR.
1. Tsien, R.Y. (1998) The green fluorescent protein. Annual Review of Biochemistry, 67, 509–545.
2. Clermontel, D., Michel, J.P., Khatibi, P. and Vu, H. (1978) Vibration-rotation absorption spectra of HCl and HBr at very high foreign gas densities. Infrared Physics, 18 (3), 229–232.
3. Tipler, P.A. and Llewellyn, R.A. (1999) Chapter 9, in Modern Physics, 3rd edn, W.H. Freeman.
4. Klein, M.V. and Furtak, T.E. (1986) Chapter 2, in Optics, 2nd edn, John Wiley & Sons, Inc.
5. Engstrom, H.A., Andersson, P.O. and Ohlson, S. (2006) A label-free continuous total-internal-reflection-fluorescence-based immunosensor. Analytical Biochemistry, 357 (2), 159–166.
6. Tang, Y.J., Chen, Y., Yao, M. Zou, Z.X. et al. (2008) Total internal reflection fluorescence spectroscopy for investigating the adsorption of a porphyrin at the glass/water interface in the presence of a cationic surfactant below the critical micelle concentration. Journal of Fluorescence, 18 (2), 261–267.
7. Brandenburg, A., Curdt, F., Sulz, G. Ebling, F. et al. (2009) Biochip readout system for point-of-care applications. Sensors & Actuators, B139, 245–251.
8. Charlton, C., Gubala, V., Gandhiaman, R.P. Prasad, R. et al. (2011) TIRF microscopy as a screening method for non-specific binding on surfaces. Journal of Colloid and Interface Science, 354 (1), 405–409.
9. Cacciatore, T.W., Brodfuehrer, P.D., Gonzalez, J.E. Jiang, T. et al. (1999) Identification of neural circuits by imaging coherent electrical activity with FRET-based dyes. Neuron, 23 (3), 449–459.
10. Stein, W., Stadele, C. and Andras, P. (2011) Single-sweep voltage-sensitive dye imaging of interacting identified neurons. Journal of Neuroscience Methods, 194 (2), 224–234.
11. Ella, S.R., Yang, Y., Clifford, P.S. Gulia, J. et al. (2010) Development of an image-based system for measurement of membrane potential, intracellular Ca(2+) and contraction in arteriolar smooth muscle cells. Microcirculation (New York, NY: 1994), 17 (8), 629–640.
12. Foster, R.M. (1932) Geometrical circuits of electrical networks. Transactions of the American Institute of Electrical Engineers, 51, 309–317.
13. Lemaitre, L., Moors, M. and Van Peteghem, A.P. (1983) The estimation of the charge transfer resistance by graphical analysis of inclined semicircular complex impedance diagrams. Journal of Applied Electrochemistry, 13, 803–806.
Abbas, A., Linman, M.J. and Cheng, Q.A. (2011) New trends in instrumental design for surface plasmon resonance-based biosensors. Biosensors & Bioelectronics, 26 (5), 1815–1824.
Axelrod, D. (1989) Total internal-reflection fluorescence microscopy. Methods in Cell Biology, 30, 245–270.
Bally, M., Halter, M., Voros, J. and Grandin, H.M. (2006) Optical microarray biosensing techniques. Surface and Interface Analysis, 38 (11), 1442–1458.
Daghestani, H.N. and Day, B.W. (2010) Theory and applications of surface plasmon resonance, resonant mirror, resonant waveguide grating, and dual polarization interferometry biosensors. Sensors, 10 (11), 9630–9646.
Kastrup, L. and Hell, S.W. (2004) Absolute optical cross section of individual fluorescent molecules. Angewandte Chemie-International Edition, 43, 2–5.
Macdonald, J.R. (2005) Impedance Spectroscopy: Theory, Experiment and Applications, 2nd edn, John Wiley & Sons, New York.
Wu, J.S., Liu, W.M. Ge, J.C. et al. (2011) New sensing mechanisms for design of fluorescent chemosensors emerging in recent years. Chemical Society Reviews, 40 (7), 3483–3495.


