Chapter 5
Electrochemical Principles and Electrode Reactions
5.1 Chapter Overview
Many biosensors operate by detecting or controlling electrochemical reactions involving the target analyte itself, or an electroactive chemical product of the analyte. The reactions occur at an electrode (variously termed the working, sensing or indicator electrode) whose main function is to electrochemically interact with chemical species close to the electrode surface by way of an electron transfer reaction. The reaction rate and type can be controlled by changing the potential of the electrode, with respect to a reference electrode, and is often quantitatively analysed by applying a constant or time-varying potential change and measuring the electrode current response, or alternatively imposing a current and measuring the response of the electrode potential. The basic principles of electrochemistry and electron transfer reactions at electrode surfaces are presented in this chapter, and will serve to introduce concepts covered in the following chapters on biosensors and instrumentation.
After reading this chapter readers will gain a basic understanding of:
5.2 Introduction
Electrochemistry is the study of electron transfer processes that normally occur at electrode-solution interfaces, in what are termed redox reactions. The term redox reaction is shorthand for reduction-oxidation reaction. A large number of chemical reactions can be regarded as the outcome of a reduction and an oxidation process:
- Reduction: A + e− → A−; (molecule A receives an electron)
- Oxidation: B → B+ + e−. (molecule B loses an electron).
The overall result (sum) of these two reactions gives:

Such reactions can be created by mixing molecules A and B, where the electron released by B in the oxidation step is transferred to a nearby molecule A, which undergoes reduction. This is shown schematically in Figure 5.1.
Figure 5.1 A redox reaction in which molecule A gains an electron donated by the oxidation of molecule B. The overall reaction is A + B → A− + B+.
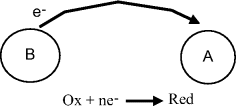
In virtually all cells that contain a nucleus, an electron transfer scheme of the form depicted in Figure 5.1 occurs along the mitochondrial electron transport chain in a process that generates stored energy in the form of ATP molecules. A series of metallo-protein molecules facilitate the controlled transfer of electrons from strongly reducing agents (molecules containing hydrogen created by nutrient metabolism in the citric acid cycle) to highly oxidising agents (oxygen molecules). The stepwise energy released in this process is used to create a proton concentration gradient to drive the synthesis of ATP. We can deduce the rate of electron flow by examining the overall chemical reaction:

Adult humans during normal physical activity consume ~0.4 litres of oxygen per minute in this reaction. At standard temperature and pressure the volume a mole of gas occupies is 24.5 litres, and so this consumption is equivalent to ~16 mM per min of oxygen. The reaction involves the transfer of four electrons for every oxygen molecule consumed, and this equates to the transfer of ~64 mM, or 3.85 × 10²², electrons per minute. If this occurred on a metal surface it would create a current flow of 103 Amps!
An electron transfer step in Complex I of the mitochondrial electron transport chain involves the iron (Fe) group in a protein containing an iron-sulfur active site being reduced as a result of receiving a high energy electron (initially donated by NADH) from a flavin mononucleotide (FMN) molecule. This reaction, in which the 3+ oxidation state of Fe is reduced to the 2+ state, is written as:

The Fe2+ and Fe3+ states are normally referred to as the Fe(II) and Fe(III) forms, respectively. The next step in the electron transport chain in Complex I involves the Fe2+ group handing on an electron to a lower energy level in a neighbouring iron-sulfur site. The Fe2+ group thus becomes oxidised to Fe3+ as a result of passing on this electron:

The large amount of energy that would normally be released in one ‘blast’ from the energetically favourable reaction, that effectively combines hydrogen and oxygen to form water, is thus instead released in 15 or more small steps. This controlled release of free energy drives a series of three proton pumps to create a pH gradient across the inner membrane of the mitochondrion, that in turn drives the synthesis of ATP. These proton pumping reactions can be represented schematically as in Figure 5.2.
Figure 5.2 Electron transfer reactions down the electron energy gradient in complex I of the mitochondrial electron transport chain. Two electrons accepted initially from NADH pass one at a time through a chain of iron-sulfur groups embedded in proteins. The free energy released drives protons across the inner membrane of the mitochondrion to generate an electrochemical proton gradient that then drives ATP synthesis.

The reduction and oxidation reactions shown in Figure 5.2 can be arranged to each take place at electrode surfaces, as depicted in Figure 5.3. Each of these electrode reactions then forms what is known as an electrochemical half-cell. If the two electrodes were to be connected by a conducting wire, so that electrons given up in the oxidation of Fe2+ at one electrode are carried forward for the reduction reaction at the other electrode, we would then have a complete electrochemical cell.
Figure 5.3 The reduction (left) and oxidation (right) reactions shown in Figure 5.2 can each take place at an electrode surface.

Other examples of electron transfer reactions occurring at electrodes, namely the electroplating of copper onto a metal and the corrosion of iron, are shown in Figure 5.4.
Figure 5.4 Examples of electron transfer reactions at electrodes. The electroplating of copper involves the reduction of solvated copper II (cupric) ions, and the corrosion (oxidation) of iron releases iron II (ferrous) ions into solution.

5.3 Electrochemical Cells and Electrode Reactions
Redox reactions taking place in a complete electrochemical cell, comprising two isolated half-cells and two solutions of molecules A and B, are shown in Figure 5.5. The solutions are contained within separate compartments, separated by an ion porous membrane, so that direct interaction between molecules A and B is not possible. However, allowing ion transfer between the two compartments ensures that no build up of net charge occurs in each half-cell to affect the electron transfer. An electrode is placed into each compartment. One of the electrodes acts as a source of electrons and the other as a sink, so that solution B gives up electrons to one electrode and solution A collects electrons from the other. The two electrodes are connected by a conducting wire that acts as a pathway for electrons given up by B to be carried to A. This forms a complete electrochemical cell.
Figure 5.5 In an electrochemical cell the reduction reaction occurs at the cathode, inducing a positive potential relative to the solution. A negative potential relative to the solution is induced at the anode as a result of its oxidation reaction. An ion porous membrane allows the flow of ions between the two halves of this cell.
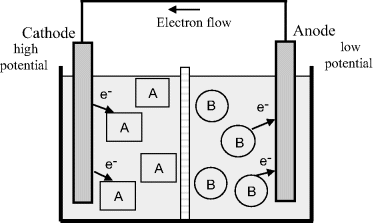
A discharging electrochemical cell (also called a Galvanic or Voltaic cell) therefore produces electrical energy from spontaneous chemical reactions that occur within it. The driving force for the electron flow and reaction is the potential difference (voltage) generated between the two electrodes. A battery consists of two or more electrochemical cells connected in series.
5.3.1 Anodes and Cathodes
By convention, as shown in Figure 5.5, the electrode where oxidation occurs is called the anode, and the electrode where reduction occurs is called the cathode. In an electrochemical cell, which acts as a source of electricity, the cathode is at a higher potential than the anode. This arises because, when chemical species A undergoes reduction, electrons are withdrawn from the electrode (the cathode) to leave a positive charge on it. In the compartment containing the anode, oxidation corresponds to B transferring electrons to the electrode, so giving it a negative charge – corresponding to a lower, more negative, potential.
For the case of an electrolytic cell in which electrolysis occurs, an otherwise nonspontaneous reaction in the cell is driven by an externally applied direct electric current. As the Greek word lysis (meaning to break up) implies, we can say that an electrochemical cell decomposes chemical compounds using electrical energy. The amount of electrical energy required is equal to the Gibbs free energy of the reaction plus any losses, such as heat. The anode (by definition) is still the site for oxidation, but now electrons must be withdrawn from the chemical species. At the cathode there must also be a supply of electrons available for reduction. Therefore, the anode must now be made positive with respect to the cathode. A simple example is the electrolysis of water, shown schematically in Figure 5.6, where water is broken down into hydrogen gas and oxygen gas. Hydrogen is evolved at the cathode and oxygen at the anode.
Figure 5.6 The electrolysis of water in an electrolytic cell. The current I required for the electrolytic reaction is supplied by an electrochemical (Galvanic) cell (or dc power supply). The direction of electron flow e− is opposite to that of the conventional current I.
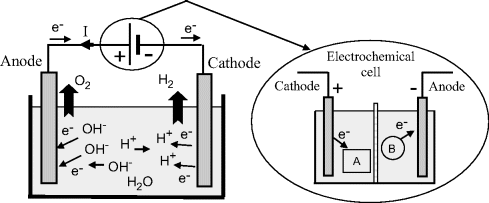
The overall electrolysis reaction shown in Figure 5.6 involves two half-reactions. At the cathode, where reduction takes place, the reduction of hydrogen cations produces hydrogen gas, leading to a removal of electrons and a build up of positive charge:

whilst at the anode an oxidation reaction generates oxygen gas, with electrons accumulating on the anode:

It is this charge difference between the cathode and anode that produces the external current. We have written the oxidation reaction equation in the direction shown because the number of electrons gained in the oxidation half-reaction must equal the number of electrons lost in the reduction half-reaction. The nomenclatures (aq), (g), (l) and (s) are used to denote the physical states (aqueous solvation, gaseous, liquid or solid, respectively) of the chemicals. Adding together these two half-reactions gives the overall reaction as:

The two electrons (2e−) appearing either side of the overall reaction cancel each other. Also, in accordance with the chemical formula for water the volume ratio of hydrogen to oxygen evolved is exactly 2:1. The number of electrons that are effectively conducted through the external wire is twice the number of hydrogen molecules that are generated, and four times the number of generated oxygen molecules. As given in Chapter 1 (Section 1.4) a litre of pure water at room temperature contains 1.0 × 10⁻⁷ M of H+ and an equal number of OH− ions. The electrolysis of water is therefore a slow process, but the electrolysis can be increased on adding dilute sulphuric acid, for example, to the water. This increases the concentration of H+ in the solution and thus an increased rate at which current can be transported by H+ conductivity.
Most students of physics and engineering are introduced to the terms anode and cathode as the terminals of an electrochemical cell (a battery) that drives conventional electric current through an external circuit. Confusion can arise with these terms when considering the case, as shown in Figure 5.6, where an electrochemical cell drives current through an electrolytic cell. Such confusion can be avoided by noting that in both cases we have the cathode defined as the site of chemical reduction, and the anode as the site of chemical oxidation. As summarised further in Table 5.1, in both cases the cathode accepts electrons from the external circuit, and the anode releases electrons to the external circuit. The only difference lies in the polarity of the electric potential of the two terminals.
Table 5.1 The definition and electron transfer characteristics of the anode and cathode for an electrochemical cell (battery) and a cell supporting electrolysis.
| Location | Electrochemical cell | Electrolytic cell |
| Anode | • Site of oxidation | • Site of oxidation |
| • The negative terminal | • The positive terminal | |
| • Releases electrons to external circuit | • Releases electrons to external circuit | |
| Cathode | • Site of reduction | • Site of reduction |
| • The positive terminal | • The negative terminal | |
| • Accepts electrons from external circuit | • Accepts electrons from external circuit |
5.3.2 Electrode Reactions
An electrode reaction is a chemical process involving the transfer of electrons into or out of the surface of a metal or semiconductor. This may be a reduction process whereby a species is reduced by the gain of electrons from the electrode, as in the following three examples:


By convention, the current flowing for a reduction reaction is a negative quantity. Alternatively, the charge transfer may be an anodic reaction in which a species is oxidised by the loss of electrons to the electrode, as in the following three examples:


By convention, the current flowing for an anodic process is a positive quantity.
The above examples indicate the possible diversity of electrode reactions. Furthermore, the electroactive species may be organic or inorganic; electrically neutral or charged; a species dissolved in solution; the solvent itself; a film on the electrode surface; or even the electrode material itself. Moreover, the product may be dissolved in solution, a gas, or a new phase on the electrode surface (e.g. growth of aluminium oxide on an aluminium electrode).
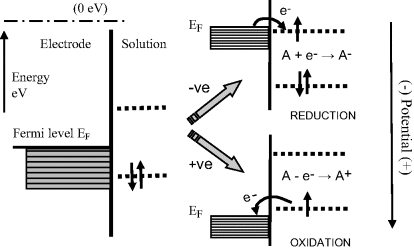
The reduction of a chemical species requires the transfer of an electron from occupied electron energy levels close to the Fermi level of the electrode to an unfilled molecular orbital (MO) of the chemical. Likewise, oxidation requires the transfer of an electron from an occupied MO to an unoccupied level near the Fermi level. These electron transfers, which involve the quantum mechanical tunnelling of electrons between the Fermi level and a molecular orbital, are depicted in Figure 5.7.
Figure 5.7 Reduction involves the transfer of an electron from the electrode's Fermi level EF to an unfilled molecular orbital. (MO) of a chemical species situated at the electrode surface. Oxidation involves the transfer of an electron from an occupied MO to an unoccupied level near the Fermi level.
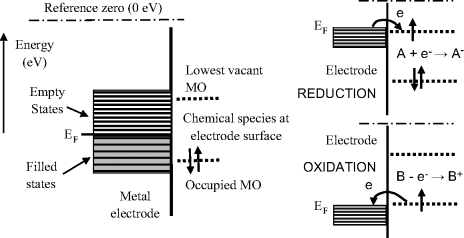
The Fermi energy level corresponds to the mean free energy of the most energetic electrons in the metal. At normal temperatures the electrons in a metal occupy energy levels below (more negative) than the reference level of zero electron volts, shown in Figure 5.7, which corresponds to the energy of an electron at rest some distance away from the electrode surface. An electron at rest has zero kinetic energy, and if removed far enough away from the influence of any kind of electric charge it will have zero potential energy. The energy transition required of an electron to relocate from the Fermi level to the reference zero level is known as the work function. The work function values for some metals are given in Table 5.2. The relative work function (hence Fermi energy) values for a gold and platinum electrode are shown in Figure 5.8, in relation to the highest electron occupied and lowest unoccupied molecular orbital level of a chemical species assumed to be at the electrode surface. Based on purely thermodynamic reasoning, the chemical may more readily be oxidised by a platinum electrode than by a gold one.
Figure 5.8 The relative Fermi energies for a gold and platinum electrode are shown with respect to the molecular orbital energy levels for a chemical species at the electrode surface (based on Table 5.2 and figure 1.1.3 of [1]). At their equilibrium (zero-current) potentials the chemical will more readily be oxidised by the platinum electrode than by the gold electrode. If their potentials are moved towards more positive values the gold electrode will, on purely thermodynamic grounds, more readily reduce the chemical than the platinum electrode.
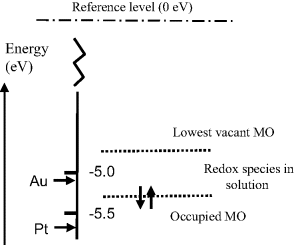
Table 5.2 Work function values for some common metals.
| Metal | Work function (eV) |
| Silver | 4.26 |
| Mercury | 4.49 |
| Copper | 4.65 |
| Gold | 5.10 |
| Platinum | 5.65 |
5.3.3 Electrode Potential
If a metal electrode M is dipped into its own metallic salt solution (i.e. a solution containing the corresponding metal ions Mz+) some of the atoms in the solid may dissolve into the solution as Mz+ ions. Each atom that does this leaves z electrons behind, which results in a negative charge on the electrode and a positive charge (cation) in the solution. An equilibrium state is reached when the rates of atom escape and capture become equal and the following redox equilibrium is set up:

This is shown for the case of monovalent ions in Figure 5.9. The amount and polarity of the net charge on an electrode will depend on where the equilibrium lies for this reaction. If the charge is positive at equilibrium, it will appear to an observer as a positive electric potential, because it is found that more work is needed to bring up a positive test charge from infinity than to an uncharged electrode. If the charge on the electrode is negative, the observer reports that the electrode has a less positive (more negative) potential because less work is needed to bring up the positive test charge.
Figure 5.9 The amount and polarity of the net charge on an electrode immersed into a solution containing its metal salt will depend on where the equilibrium lies for the two electrode reactions shown. The potential difference (voltage) appearing between the two electrodes is given by [(EM1 − ϕs) − (EM2 − ϕs)] = (EM1 − EM2). If EM2 is defined as the reference potential, then EM1 is the electrode potential of electrode M1 with respect to electrode M2.
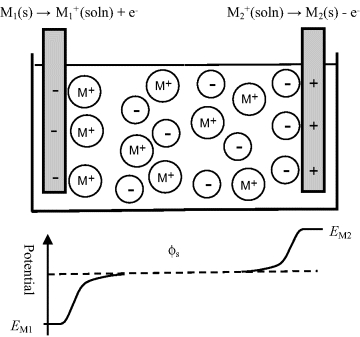
At equilibrium a potential difference is established across the electrical double layer at the metal-solution interface. The potential difference (voltage) appearing between the two electrodes in Figure 5.9 is given by:

where ϕs is the potential of the bulk solution. It is important to distinguish between the terms ‘potential’ and ‘voltage’. (Electronic engineers often use the term ‘applying a voltage’ to a circuit location, when what they are doing is applying a potential difference to this location with respect to a reference ground plane.) If EM2 is assigned to be the potential of a reference electrode, then EM1 is the potential with respect to that of the reference electrode M2. The absolute value of an electrode potential cannot be determined – it can only be given with respect to another potential. If the metallic salt solution into which the electrode is immersed is of unit chemical activity, then at the standard condition of atmospheric pressure (101.3 kPa) at 25 °C (298 K), the equilibrium electrode potential is known as the standard electrode potential.
The establishment of an electrode potential is produced at the expense of the loss of free energy of the system. If E is the electrode potential of the electrode, and the electrode reaction involves the transfer of n electrons, the electrical work available from the electrode is nFE (Joules), where F is the Faraday constant of value 9.65 × 10⁴ C/mol. For a reversible electrode reaction the free energy change is given by:
where ΔGo is the standard free energy. In Equation (5.1) the term [M] represents the effective concentration (chemical activity) of the metal electrode. This can be considered to remain constant and so the normal convention is to assign [M] as having a constant activity of 1. The energy per mol of any uncharged component of a solution is characterised by its chemical potential πi. This energy is the Gibbs energy, and is a measure of the component's ability to do useful work (e.g. electrical or osmotic work). In a dilute solution the chemical potential πi of a given component i of concentration Ci is given by

where  is the standard chemical potential at Ci equal to 1 molar. The work done to add a charged species to a solution of electric potential ϕ differs from that required when the potential is zero. If the species ‘i’ is an ion of charge zie, the extra work per ion is zieϕ, where zi is the charge number. The electrochemical potential Πi is related to the chemical potential πi of an uncharged species by:

When a positive ion (zi positive) is in a region of positive potential, the electrochemical potential is greater than the chemical potential. This corresponds to the ion having a greater tendency to escape from the region or to undergo chemical change. The opposite is true for a negative ion in the same region – it is less reactive. An important consequence of this is that at the equilibrium state the electrochemical potential of each chemical species is the same in every phase. This is an important concept for understanding the functioning of a reference electrode, such as the silver-silver chloride or calomel electrode, for example.
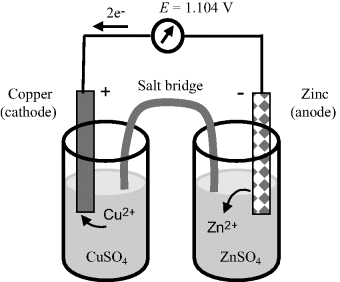
A good example of a practical electrochemical cell (or more precisely a combination of two half-cells) is shown in Figure 5.10 in the form of the Daniell Cell. This cell consists of a zinc electrode immersed into a zinc sulphate solution as one half-cell, together with a copper electrode immersed in a copper sulphate solution. These two half-cells are ionically connected via a glass tube containing a gel saturated with a potassium chloride solution. This so-called ‘salt bridge’ prevents charge building up in each half-cell during the electron transfer eeactions at each electrode. A porous ceramic can be used for this purpose instead of the salt bridge. Although the frit will produce small junction potentials, it is experimentally more convenient than preparing a conventional salt bridge. The Gibbs free energy (chemical potential) of the system is related to the emf E (1.1 V) of this cell by:
Figure 5.10 The Daniell Cell. The electrochemistry of this cell is discussed in detail in Example 5.1.
where n is the number of electrons transferred (n = 2 in this case). From Equations (5.1) and (5.2) the electrode potential is given as:
The factor (−ΔGo/nF) in Equation (5.2) is termed the standard reduction potential Eo.
5.3.4 Standard Reduction Potential and the Standard Hydrogen Electrode
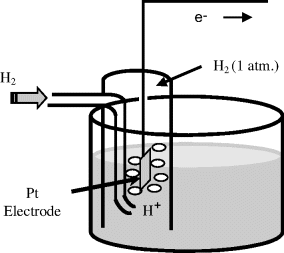
The reduction potential (also known as the redox potential or oxidation-reduction potential) is a measure of the tendency of a chemical species to acquire electrons and hence to be reduced. The reduction potential is measured in Volts. Each chemical species has its own intrinsic reduction potential. The more positive the potential, the greater is the species' affinity for electrons, and the greater its tendency to be reduced. Reduction potentials of chemicals in aqueous solutions are determined by measuring the potential difference between an inert sensing electrode (e.g. platinum, gold, graphite) in contact with the solution and a stable reference electrode connected to the solution by a salt bridge. The inert metal acts as a source or sink of electrons but takes no further part in the redox reaction. So far in this chapter we have considered the case of electrodes immersed in a solution (e.g. Figures 5.9 and 5.10). It is also possible to establish an equilibrium potential at a gas-metal electrode. The gas is passed over the surface of the electrode, which is immersed in a solution of ions related to the gas. If chlorine is the gas then the solution must contain chloride ions. Hydrogen can also be used as the gas, and so the solution should contain H+ ions (protons). The Standard Hydrogen Electrode (SHE) is the reference from which all standard reduction potentials are determined (see Figure 5.11).
Figure 5.11 The standard hydrogen electrode (SHE) defines the zero reference level for the determination of the standard reduction potential of another half-cell system (with a shared electrolyte of hydrochloric aced). The temperature is 25 °C and hydrogen gas is passed at a pressure of one atmosphere over a pure platinum electrode.
Hydrogen gas can readily be oxidised to form protons:

If this reaction is performed under standard conditions – the Gibbs free energy is defined to be zero. Standard conditions are defined to be a temperature of 25 °C (298 K) with pure hydrogen gas being supplied at a pressure of one atmosphere (101 kPa) and passed over a pure platinum electrode. This half-cell reaction, in turn, defines the zero reference level for the determination of the standard reduction potential of another half-cell system coupled to a half-cell containing a standard hydrogen electrode (without the presence of junction potentials). The standard reduction potential (Eo) is measured under standard conditions (298 K, a chemical activity of 1 for each ion participating in the reaction at a pressure of 1 atmosphere for each gas that is part of the reaction, and metals in their pure standard state). Standard reduction potentials for some reactions are given in Table 5.3.
Table 5.3 Standard reduction potentials for some common half-cell reactions. (P. Vanysek, CRC Handbook of Chemistry and Physics, 87th edn, Boca Raton, 2007).
| ½-Cell reaction | Standard potential Eo (Volts) |
| F2 + 2H+ + 2e− ↔ 2HF | +3.053 |
| Au3+ + 3e− ↔ Au | +1.498 |
| O2 + 4H+ + 4e− ↔ 2H2O | +1.229 |
| Br2 + 2e− ↔ 2Br− | +1.066 |
| Ag+ + e− ↔ Ag | +0.7996 |
| Fe3+ + e− ↔ Fe2+ | +0.771 |
| Cu+ + e− ↔ Cu | +0.521 |
| Cu2+ + 2e− ↔ Cu | +0.3419 |
| Hg2Cl2 + 2e− ↔ 2Hg + 2Cl− | +0.26808 |
| AgCl + e− ↔ Ag + Cl− | +0.22233 |
 |
0.0000 |
| CO2 + 2H+ + 2e− ↔ HCOOH | −0.199 |
| PbSO4 + 2e− ↔ Pb + SO42− | −0.3588 |
| Fe2+ + 2e− ↔ Fe | −0.447 |
| Cr3+ + 3e− ↔ Cr | −0.744 |
| Zn2+ + 2e− ↔ Zn | −0.7618 |
| 2H2O + 2e− ↔ H2 + 2OH− | −0.8277 |
| Al3+ + 3e− ↔ Al | −1.662 |
| K+ + e− ↔ K | −2.931 |
| Ca+ + e− ↔ Ca | −3.80 |
The reactions given in Table 5.3 are spontaneous in the direction as presented if the standard potential Eo is greater than zero, and are spontaneous in the reverse direction to that presented if the standard potential is less than zero. If an equation is reversed, so that the reactants become the products, the sign of Eo must also be reversed. Thus, referring to the chemical reaction shown in Figures 5.2 and 5.3, from Table 5.3 we can define the reduction of the ferric ion as follows:

This informs us that the standard reduction potential (E0) for this reaction is +0.771 Volts, as referenced against the standard hydrogen electrode (SHE). For the oxidation reaction (hydrolysis) of water, leading to the production of oxygen gas, we have to reverse the relevant reaction given in Table 5.3:

This informs us that the electrolysis of water does not occur spontaneously at pH 0, but has to be driven by a voltage of at least 1.23 Volts, applied externally across the electrodes of the electrolysis cell. Multiplying up or dividing down the various quantities throughout a reaction equation does not change the E0 value, because the ratio of the reactant to product concentrations is not changed. For example, doubling up the quantities in the water electrolysis reaction is written as:

5.3.5 The Relative Reactivities of Metal Electrodes
The E̊ values given in Table 5.3 for metal reactions provides the means to judge the relative tendency for a reduction reaction to occur at an electrode made of that metal, compared to that of the reduction of an H+ ion under standard conditions (i.e. at a hydrogen electrode). All of the metals appearing at the top of Table 5.3 (those having the largest positive E̊ values) have high reduction potential – they can be easily reduced and so act as strong oxidising agents. From Table 5.3 we can see that silver and copper are better oxidising agents than Zn2+ or Al3+, for example. On the other hand, the large negative reduction potential (−3.8 V) of a calcium electrode makes it very difficult to reduce Ca+ ions to Ca atoms. However, Ca+ readily loses electrons to act as a reducing agent. In summary, as the reduction potential increases (i.e. its negative value decreases) the tendency of the electrode to behave as a reducing agent decreases. Thus, metals such as calcium (Ca) and potassium (K) act as good reducing agents, whereas metals such as silver (Ag) and gold (Au) are very poor reducing agents.
Metals having the lower reduction potentials are not readily reduced but are easily oxidised to their ionic state by losing electrons. These displaced electrons can reduce a metal that possesses a higher reduction potential, and this can lead to an oxidised metal displacing a metal of larger reduction potential from its salt solution. For example, we can see from Table 5.3 that copper has a lower reduction potential than silver. If copper metal is added to a silver nitrate (AgNO3) salt solution, silver atoms will precipitate from the solution as they are replaced by copper atoms to form copper nitrate salt:

In general a metal at a lower position (standard potential) in Table 5.3 can displace the metals lying above it in the table from the solutions of their salts. Such metals are more reactive in displacing the other metals. Thus, of the elements listed in Table 5.3, calcium is the most electropositive element in solutions and fluorine the most electronegative.


5.3.6 The Nernst Equation
In Example 5.1 it was noted that the emf of a cell is sensitive to changes in temperature and the relative concentrations of the reactants and products. The Nernst equation provides a quantitative way to determine the shift of an equilibrium potential E away from the standard reduction potential Eo as a result of changes in the temperature and activities (equal to concentrations if dilute solutions) aO and αR of the oxidised and reduced species, respectively. The Nernst equation can be obtained directly from Equation (5.3) derived from the calculation of the free energy change of a reversible electrode reaction (and using chemical activity α rather than concentration):

or
in which R is the universal gas constant (8.31 J K−1 mol−1), n is the number of electrons involved in the electron transfer process, and F is the Faraday constant (9.648 × 10⁴ C mol−1). Thus, at T = 25 °C (298 K) for a redox reaction involving a single (n = 1) electron transfer process:

For reactions at a solid electrode surface we can take the electrode's activity to remain constant at 1. It is rarely, if ever, the case that a metal electrode is in equilibrium with its anion at the metal-solution interface. For example, all of the half-cell reactions given in Table 5.3 involve a metal cation. Therefore, at T = 25 °C for a single (n = 1) electron transfer reaction where, as is normally the case the metal is the reduced species and αR = 1, the Nernst equation takes the form:
(5.5) 
The final right-hand term of this equation assumes that the concentration [O] is sufficiently low to equate chemical activity to concentration. If we review the two half-cell reactions in the Daniel cell:


and inspect the convention used to denote a redox reaction (see Figure 5.1)

we find that the solid electrodes Zn(s) and Cu(s) equate to the reduced species R. For the unusual case, as might conceivably occur with a semiconductor electrode, the solid electrode material represents the oxidised species, the Nernst equation becomes:
(5.6) 
The direction of electron flow for a cell composed of two different half-cells can be predicted by comparing their redox potentials. A half-cell that accepts electrons from a standard hydrogen electrode is defined as having a positive redox potential, and a half-cell that donates electrons to a standard hydrogen electrode is defined as having a negative redox potential. Electrons will flow from the half-cell having the more negative Eo value to the half-cell having the less negative (or positive) Eo potential.


5.4 Electrical Control of Electron Transfer Reactions
Electron transfer reactions at an electrode surface can be controlled by changing the electrical potential of the electrode. We can approach an understanding of this by considering how an electric current can be induced in a metallic conductor. The energy band model of a metal depicts the free electrons partially occupying a band of delocalised energy levels up to the Fermi energy level. If a potential difference (i.e. a voltage) is applied to the ends of a metal wire in an electrical circuit, electrons will percolate down the induced gradient of energy levels in the metal to produce a current, as shown in Figure 5.12. The free energies of the filled electron energy states are increased in the metal end connected to the negative battery terminal, and are lowered at the positively biased end.
Figure 5.12 Electrons in the partially filled conduction band of a metal wire can be induced to flow down an externally induced potential energy gradient.
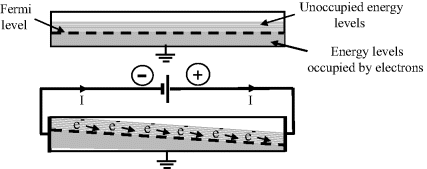
It is important to distinguish between potential energy and electrical potential. The potential, with respect to a reference level, of a metal connected to a negative battery terminal will be lowered because less work will be required to bring a positive charge up to it. On the other hand, the potential energy of its electron energy states will be increased because they are negatively charged, and can facilitate a reduction reaction by raising the energies of electrons at the Fermi energy of the metal to where they can make a transition (usually by tunnelling) into an unoccupied molecular orbital of a chemical species adsorbed or near the metal's surface. This achieves a reduction reaction. For a positively biased metal, its electronic energy states are lowered, making a reduction process less likely for a given chemical species but improving the chance that an oxidising reaction can occur. These two possibilities are demonstrated in Figure 5.13.
Figure 5.13 Electron transfer reactions at an electrode surface can be controlled by making the electrode potential more positive or negative. The situations shown here correspond to a more positive potential giving rise to the oxidation, and a more negative potential leading to reduction, of a chemical species.
We will consider a half-cell composed of an electrode immersed in a solution containing a chemical species that exhibits a reversible reaction:

where n is the number of electrons transferred in the reaction. The electrode is assumed to be an inert metal (e.g. platinum or gold) so that no electron transfer occurs across its surface when immersed in an electrolyte. In other words it performs as an ideal polarised electrode. To simplify our discussion we will also assume that the counter electrode completing the electrochemical cell is of sufficiently large surface area that its current density is very small. This will serve to make this counter electrode nonpolarisable, being able to conduct the cell current without changing its potential. This counter electrode could, for example, be platinum foil acting as a standard hydrogen electrode, separated from the first half-cell by a porous glass frit or a membrane. The voltage-current characteristics of the complete electrochemical cell are therefore determined solely by the performance of the first electrode, which we will call the working electrode. Also, the chemical concentrations of O and R are low enough that concentrations, rather than chemical activities, can be used in the Nernst equation (5.4).
If the working electrode potential is adjusted to enable an oxidation reaction where R is oxidised to O (R → O + ne−), the associated anodic (oxidation) current density is by convention assigned a positive value. To an external observer a conventional electric current is directed into the electrode. A negative value is given to the current associated with a reduction (cathodic) reaction where O is reduced to R (O + ne− → R), and conventional current flows away from the electrode and along the wire. At the condition of dynamic equilibrium the rates of oxidation and reduction are equal. Thus, the oxidation exchange current density IO and the reduction exchange current density IR density are equal and opposite to give a zero net exchange current density density Io:
(5.7) 
The magnitude of the exchange currents will each depend on the surface concentrations [O]s and [R]s of the electroactive species O and R, respectively, and on the electron transfer rate constants kO and kR:
At the equilibrium state the concentrations of O and R at the electrode surface remain constant with time. There are no concentration gradients of the electroactive reactants O and R at the surface of the working electrode, and so the potential of the working electrode will remain steady at the standard potential value E given by the Nernst equation.
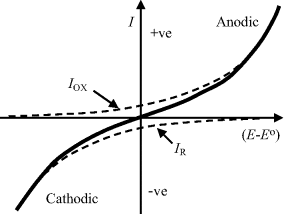
If a voltage is now applied across the cell so as to raise the working electrode potential to a value 0.24 V more positive than Eo, for example, a steady state condition can only arise if an anodic (oxidation) current flows so as to change the concentration ratio [O]s:[R]s from 1: 1 to a situation close to 1000:1. The Nernst equation in fact demands that this be the case. Under steady state conditions, with an electrode potential (E − Eo) = +0.24 V, the oxidised form (O) of the redox couple is by far the most dominant species. As first observed by Tafel in [2], cell currents are often related exponentially to the value of (E − Eo). This implies that the rate constants in Equation (5.8) depend on the applied potential, and the modern interpretation of this effect is embodied in the Butler-Volmer equation (named after two physical chemists, John Butler of England and Max Volmer of Germany):
The factor αA is the transfer coefficient for the electron tunnelling process involved in the anodic transfer of an electron from a molecular orbital in an oxidised species to the electrode, and αC is the corresponding transfer coefficient for the cathodic reaction. For simple transfer processes αA + αC = 1, and it is commonly assumed that αC ≈ αA ≈ 0.5. The quantity (E − Eo) is termed the over-potential to define the deviation from the equilibrium potential. Raising the working electrode potential to a value 0.24 V more positive than Eo represents a high positive value for the over-potential. In this case the second term of Equation (5.9) can be neglected to give the anodic current density as:
If the electrode potential is set to a value 0.24 V more negative than Eo, steady state conditions will arise through a cathodic current leading to [O]s/R]s = 0.001. The reduced form (R) then becomes the dominant species at the electrode surface. The second term in Equation (5.9) is now the dominant one and the cathodic current density is given by:
The total current given by Equation (5.9) is shown in Figure 5.14, as the sum of the two exponential components of the anodic and cathodic currents given by Equations (5.10) and (5.11). It is important to note that the current-potential response shown in Figure 5.14, based on the Butler-Volmer equation, is valid only for the situation where the electrode reaction is controlled by the charge-transfer kinetics at the electrode surface. No account is made of the rate limiting step which may result from the relatively slow diffusion of an oxidised or reduced electroactive species away from the electrode surface into the bulk electrolyte, or the diffusion of these species to the electrode surface from the bulk electrolyte. Such mass transfer is required in order to maintain the concentration ratio [O]s:[R]s dictated by the Nernst equation.
Figure 5.14 The current-potential response of an electrode reaction according to the Butler-Volmer equation (5.9). The total current is the sum of the anodic and cathodic currents given by equations (5.10) and (5.11). Any rate limiting steps associated with the mass-transfer of electroactive species between the electrode surface and the bulk electrolyte are not included.
Based on the treatment presented by Bard and Faulkner [1, ch. 3], Equation (5.9) can be modified to take into account the influence of diffusion-controlled mass-transfer as follows:
(5.12) 
When the electrode reaction is controlled by the diffusion of the electroactive species (mass-transfer controlled) the current has a limiting value Ilim given by:
where A is the electrode surface area, D and [C]bulk are the diffusion coefficient and bulk concentration of the limiting electroactive species, respectively, and δ is the distance from the electrode surface into the bulk electrolyte over which the diffusion process is effective (the diffusion layer thickness). Diffusion processes are described in Chapter 10.
5.4.1 Cyclic Voltammetry
This is the name given to the experimental procedure whereby the potential (relative to a reference electrode) of a working electrode immersed in a solution containing an electroactive species is cycled at a steady rate either side of the equilibrium potential value Eo. The resulting current flowing through the counter electrode is monitored in a quiescent solution. The potential-time waveform has a symmetrical ‘saw-tooth’ profile, with the same positive and negative sweep rates, that can range from a few millivolts up to 100 Vs−1. Thus, for example, the potential at any time t for a negative-going voltage sweep is given by:

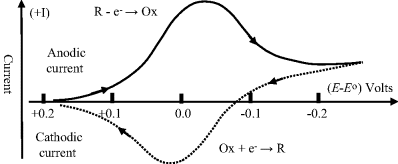
where Ei is the initial potential and ν is the linear sweep rate (Vs−1). When the potential of the working electrode is more positive than Eo, the electroactive species may become oxidised and produce an anodic current (i.e. electrons passing from the solution to the working electrode). On the return voltage scan, as the potential of the working electrode becomes more negative than Eo, reduction may occur and give rise to a cathodic current. A schematic of such a cyclic voltammogram is shown in Figure 5.15, and reflects the International Union of Pure and Applied Chemistry (IUPAC) convention that the anodic current is plotted in the upper (positive) half of the potential-current plot, with the cathodic current given in the lower (negative) half. However, in many textbooks (e.g. [1]) and scientific publications (mostly from laboratories in the USA) the IUPAC convention is not adopted, so that the cathodic (negative) and anodic (positive) currents are placed in the upper and lower halves of the plot, respectively!
Figure 5.15 A cyclic voltammogram for a reversible redox reaction. Starting at a value above the standard reduction potential Eo, with only the oxidised form of an electroactive species present, the electrode potential E is ramped to a value below Eo, and than back up again. This generates the reduction current peak (solid line) followed by the oxidation current peak (dotted line).
We can understand the basic shape of a voltammogram by rearranging the Nernst equation to form a time-dependent relationship:

This equation can also be written:
This form of the Nernst equation emphasises that the relative concentrations of the controlling electroactive species at the electrode surface are time-dependent in cyclic voltammetry. The example shown in Figure 5.15 corresponds to the situation where the electrode interfaces with a solution containing only the oxidised form of an electroactive species. The reduced form (R) is not present in the solution. The electrode potential is initially held at a potential sufficiently more positive than Eo, so that no charge-transfer at the electrode occurs under steady state conditions. As the electrode potential approaches the Eo value, reduction of the oxidised species commences, a reduction current flows and the concentration [O]s gets smaller. The reduced species (R) will diffuse away from the electrode and a concentration gradient of (O) is also created. Diffusion of (O) from the bulk electrolyte to the electrode increases and this leads to an increase of the reduction current. This process continues as the electrode potential gets more negative, until the potential falls below Eo. At this point the surface concentration of (O) approaches zero according to Equation (5.14), and mass transport of O to the electrode surface attains a maximum rate to produce a peak of the reduction current. Beyond this stage of the negative potential sweep the concentration of (O) is depleted and the reduction current approaches the limiting value given by Equation (5.13). On initiation of the reverse potential sweep, the large concentration of the reduced species [R]s at the electrode surface provides favourable conditions for their reoxidation. As the electrode potential approaches and then rises above Eo the generated concentration gradient of (R) at the electrode causes an increase of the oxidation current, which then passes through a maximum value before falling as the concentration of oxidisable species (R) is depleted.
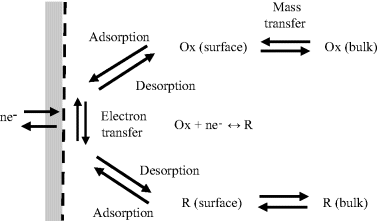
As shown in Figure 5.15, the peaks of the reduction and oxidation currents occur either side of the standard reduction potential Eo. The height and width of these current peaks depend on the rate at which the potential is cycled, as well as the kinetics of the charge-transfer processes at the electrode surface. Other factors include the rates of desorption of (O) and (R) from the electrode surface and their rates of diffusion (mass transfer) between the bulk solution and the electrode. These various contributions are shown schematically in Figure 5.16. Cyclic voltammograms contain a significant amount of information on the control of electrode reactions!
The geometry of the electrode can also influence the shape of a voltammogram. For a large area, flat, electrode, the diffusion (mass-transfer) processes depicted in Figure 5.16 are restricted to a planar surface over the electrode. A microelectrode protruding from a substrate, on the other hand, will have access to a much larger, hemi-spherical, diffusion surface. Cyclic voltammogramms obtained using micro- or nano-scale electrodes will not exhibit the same level of mass-transfer controlled characteristics as those obtained using large area flat electrodes.
Figure 5.16 The flux of electrons (−I/nF) across an electrode surface for a reversible redox reaction is controlled by the kinetics of the electrochemical electron transfer and the mass transport of reduced (R) and oxidised (O) species to and away from the metal surface. The mass transfer involves the diffusion and/or migration of R and O down concentration gradients and electric fields.
5.4.2 Amperometry
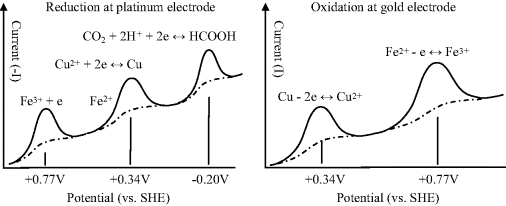
The most common class of biosensor operates as an amperometric device, where measurement is made of the current arising from an electrode reaction involving an electroactive analyte. The choice of electrode material is an important consideration for such devices. In general, as we have seen, when the potential of an electrode is moved from an equilibrium state towards more negative potentials, the chemical species that will be reduced first is the oxidant in the redox couple with the least negative (or more positive) standard reduction potential Eo. Figure 5.17 depicts the relative situations for inert platinum and gold electrodes immersed in an aqueous solution containing iron and copper ions with dissolved carbon dioxide. The approximate locations of the Fermi levels for platinum and gold are based on the work function values given in Figure 5.8. As the potential of a platinum electrode is lowered to less positive potentials with respect to the hydrogen electrode reference level, the first species reduced will be Fe3+, since the Eo of the Fe3+/Fe2+ couple is the least negative (i.e. most positive), followed by Cu2+ and CO2. When the potential of an electrode is made progressively more positive, the chemical species that will be oxidised first is the reductant in the redox couple of least positive (or more negative) Eo. Thus, for a gold electrode in an aqueous solution containing Cu, Fe2+ and CO2, copper will be the first to be oxidised as its potential is made more positive, followed by Fe2+. The associated series of electrode current peaks produced by these electrochemical reactions are shown schematically in Figure 5.18. The dotted curves in Figure 5.18 represent the currents that would be observed if the potential had been increased slowly in small incremental steps, rather than as a relatively fast potential ramp.
Figure 5.17 The standard reduction potentials for some electron transfer reactions, referenced against the standard hydrogen electrode (SHE). The approximate locations of the Fermi levels (vs. SHE) are shown for a platinum and gold electrode.
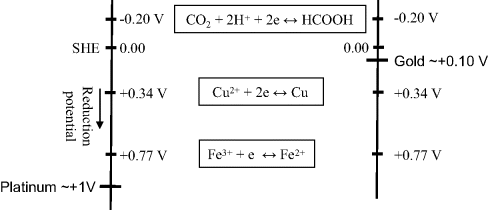
Figure 5.18 Reduction and oxidation currents produced as a function of the potential applied to platinum and gold electrodes, respectively, for the series of redox reactions shown in Figure 5.17 The current peaks are obtained using an applied linear voltage ramp, whilst the dotted curves show the steady-state current.
In the form of amperometry known as one-electrode amperometry, the potential of a working (or indicator) electrode is maintained at a constant value with respect to a reference electrode. The current is measured after the introduction of an analyte to the electrochemical cell. The electrode potential is chosen to be close to the known value of Eo for an electrochemical reaction involving the target analyte. For the case of two-electrode amperometry, a small constant potential difference is maintained between two working electrodes – one of which will sustain an anodic current and the other a cathodic current at the commencement of an electrochemical reaction. At steady state conditions these two currents will be of equal magnitude, but opposite polarity, and the electrode potentials will adjust to accommodate this.
5.4.3 The Ideal Polarised Electrode
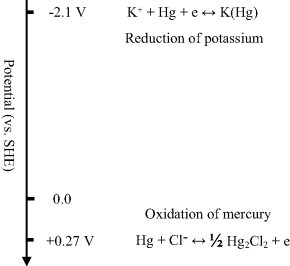
An electrode at which no electron transfer can occur across the interface between the metal and a pure solution, regardless of the potential imposed by an outside source of voltage, is called an Ideal Polarised Electrode. While no real electrode can behave in this way over the whole potential range that can be applied to an electrode-solution system, ideal polarisability can be approached over certain limited potential ranges. For example, consider Figure 5.19 which shows the situation for a mercury electrode in contact with a degassed and clean potassium chloride (KCl) solution. At sufficiently positive potentials the mercury can oxidise, and at a very negative potential of −2.1 V the potassium ion (K+) can be reduced. However, in the potential range between these processes, no electron transfer reactions occur. The reduction of water is thermodynamically possible in this region between +0.25 V and −2.1 V, but occurs at a very slow rate at a mercury surface unless quite negative potentials are reached. The only other faradaic currents that could occur in this potential range would arise from electron transfer reactions involving trace impurities, such as metal ions, oxygen, and organic chemical species. With a clean and degassed KCl solution, such currents would be quite small.
Figure 5.19 A mercury electrode in contact with a degassed potassium chloride solution containing no trace impurities behaves as an ideal polarised electrode. Over the 2.35 V range, between the oxidation of mercury and the reduction of potassium, no electron transfer reactions can take place.
5.4.4 Three-Electrode System
The overall chemical reaction taking place in an electrochemical cell consists of the net effect of two half-cell reactions. Most electrochemical experiments or devices (e.g. sensors) are concerned with electron transfer reactions that occur at only one of the electrode – namely the working electrode. An example of this is cyclic voltammetry described in Section 5.4.1. An experimental cell could therefore consist of the working electrode (also termed the indicator or sensing electrode) coupled with a counter electrode that also functions as the reference electrode. The working electrode's potential would be monitored or controlled with respect to this reference electrode, and the current response monitored. However, it is preferable to use a three-electrode system, the basic form of which is shown in Figure 5.20.
Figure 5.20 A three-electrode electrochemical cell, consisting of the working electrode (WE), a reference electrode (RE) and the counter electrode (CE). The operational amplifier drives the current between the working and counter electrode, but negligible current passes through the reference electrode.
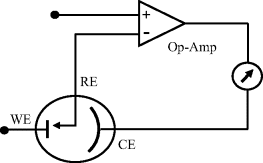
In Figure 5.20 the working electrode (WE) defines the electrode-solution interface under study. It should behave as a chemically inert and ideal polarised electrode. The reference electrode (RE) maintains a constant reference potential by operating as a nonpolarised electrode, a situation obtained by ensuring that no, or minimal, current flows through it. The purpose of the counter electrode (CE) is to supply the current required by the working electrode without in any way limiting or influencing the measured response of the electrode reaction. To achieve this it should have a much greater surface area than the working electrode. The feedback circuit with the operational amplifier drives the current between the working and counter electrode, while ensuring that none passes through the reference electrode circuit. This circuit maintains stability of the reference potential, and is referred to as a potentiostat. Further discussion of the three-electrode system and instrumentation for electrochemistry can be found in Chapter 7.
5.5 Reference Electrodes
The role of a reference electrode is to provide a fixed potential, which does not vary, during a potentiometric experiment or whilst an ion selective electrode is being used as a sensor. In all experiments it will be necessary to relate the potential of the reference electrode to other voltage scales, for example to the standard hydrogen electrode – the agreed standard for thermodynamic calculations. However, a hydrogen electrode is not a particularly convenient electrode to make or operate for routine use – and is potentially hazardous because it uses flowing hydrogen. Therefore, in practice, other secondary reference electrodes are used.
The concept of a reference electrode can be understood in terms of a complete electrochemical cell being composed of two ½-cells, as described in Section 5.3. The net cell potential is the difference of the electrode potentials of these two ½-cells. If one of the electrode potentials can be arranged to be of a fixed and unchanging value, then the net potential of the cell will only depend on the electrode reaction occurring at the other electrode (often referred to as the working or indicator electrode).
An essential feature, therefore, of a reference electrode is that it should provide a stable and reproducible electrode potential, and be relatively insensitive to changes in temperature. Compared to the hydrogen electrode it must also be easy to make and safe to use. In amperometric experiments the potential between the indicator (working) electrode and the reference electrode is controlled by a potentiostat, and as the reference half cells maintains a fixed potential, any change in applied potential to the cell appears directly across the working electrode-solution interface. The reference electrode serves the dual purpose of providing a thermodynamic reference and also isolates the working electrode to be the electrode-solution interface under electrochemical examination. In practice, however, any measuring device must draw current to perform the measurement. A good reference electrode should therefore be able to maintain a constant potential even if a few microamperes are passed through it. We say that the reference electrode should not be substantially polarised during the experiment or sensing operation. Ideally, it should be nonpolarisable.
A satisfactory reference electrode must also exhibit reversibility. This means that there should be negligible departure from a dynamic equilibrium state, with minimal susceptibility to outside electrochemical disturbances. Dynamic equilibrium will consist of a continuous flow of forward and reverse electron transfer reactions (i.e. cathodic and anodic) at the electrode surface. These exchange currents, which overall are self-cancelling, should be as high as possible. When the electrode is in use, either in measurement or as a sensor, the net current associated with this use should be much smaller than the exchange current, otherwise there will be a displacement of the electrode potential from its equilibrium value.
Most reference electrodes take the form of a three-phase electrode that is reversible to anions in solution. Their potentials are determined by the activity of these anions according to the Nernst equation. The three phases are in contact and in equilibrium with each other, and consist of a metal, a sparingly soluble solid salt formed by the cation of the metal with the anion to which the electrode is reversible, and a solution containing this same anion. The most common and simplest example of this is the silver-silver chloride reference electrode.
5.5.1 The Silver-Silver Chloride Reference Electrode
This electrode is normally represented as:

and consists of metallic silver, solid silver chloride, and an electrolyte solution containing a soluble chloride anion. The potential of this electrode is determined by the reactions shown schematically in Figure 5.21 and given in equation form below:
Figure 5.21 A schematic of the reactions that determine the equilibrium potential of the silver-silver chloride electrode.
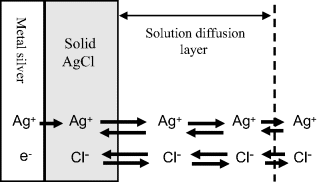

and

with a standard reduction potential of +0.22233 V (vs. SHE).
The potential of the electrode is determined at equilibrium by the Nernst equation (5.4):

This corresponds to the equilibrium potential of a silver, silver ion electrode. If the activity solubility product Ks (= a(Ag+). a(Cl−)) in the solid silver chloride phase is assumed to be constant, then from Equation (5.4) the potential for the silver-silver chloride electrode is given as:

or

This expression shows how the potential of the silver-silver chloride electrode varies with the activity of chloride ions in the surrounding solution. The standard reduction potential value of +0.22233 V given in Table 5.3 corresponds to the recommendation by Bates and MacAskill [3] that silver-silver chloride electrodes should be standardised with 0.01 M Cl− ion concentration (corresponding to an activity a(Cl−) of 0.00904 at 25 °C).
Commercially available silver-silver chloride electrodes commonly consist of a cylindrical glass tube containing a 4 M solution of KCl saturated with AgCl. The lower end of the tube is sealed with a porous ceramic frit. A ‘chloridised’ silver wire coated with a layer of silver chloride is immersed into the filling solution, which connects to the measuring system via a low-noise cable. A schematic of this system is shown in Figure 5.22.
Figure 5.22 Schematic of the silver-silver chloride reference electrode.
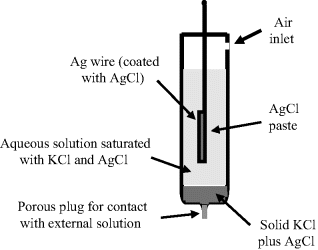
A solid deposit of sodium chloride, with a smaller proportion of silver chloride, is included to ensure that the concentration of the chloride ions remains constant in the aqueous solution.
5.5.2 The Saturated-Calomel Electrode
Calomel is an old name for mercurous chloride (Hg2Cl2). As shown in Figure 5.23, this electrode consists of a mercury pool in contact with a paste made by mixing mercurous chloride powder and saturated potassium chloride solution. A constant chloride ion concentration is maintained in the paste through contact with a saturated potassium chloride solution. The half-cell reaction equation is:
Figure 5.23 Schematic of the saturated-calomel reference electrode.
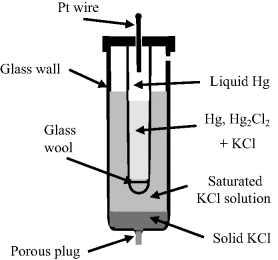

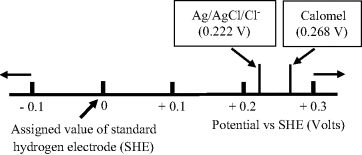
and as given in Table 5.3 has a standard reduction potential of +0.26808 V (vs. SHE). The reduction potentials of the calomel electrode for various concentrations of the chemical components are given in Table 5.4.
Table 5.4 Standard reduction potential values of the saturated-calomel electrode for various concentrations of its chemical components. (P. Vanysek, CRC Handbook of Chemistry and Physics, 87th edn, pp. 8–21, Boca Raton, 2007).
| Composition | Standard potential Eo (Volts) |
| Saturated NaCl (SSCE) | +0.2360 |
| Saturated KCl | +0.2412 |
| 1 Molal KCl | +0.2800 |
| 1 Molar KCl (NCE) | +0.2801 |
| 0.1 Molar KCl | +0.3337 |
A reference scale to convert between the standard hydrogen electrode, the silver-silver chloride and the calomel electrode is given in Figure 5.24.
Figure 5.24 A scale indicating the relative potentials of the silver-silver chloride and the saturated-calomel electrode with respect to the standard hydrogen electrode.
5.5.3 Liquid Junction Potentials
The standard voltage given by a reference electrode is only correct if there is no additional voltage supplied by a liquid junction potential formed at the porous plug between the filling solution and the external test solution. Liquid junction potentials can appear whenever two dissimilar electrolytes come into contact. At this junction, a potential difference will develop as a result of the tendency of the smaller and faster ions to move across the boundary more quickly than those of lower mobility. From Table 10.4 of Chapter 10 we can see that the chloride ion has a larger diffusion coefficient in water than the sodium ion, whereas potassium and chloride ions have roughly similar diffusion coefficients. Formation of a junction potential between two NaCl solutions of different concentrations is shown in Figure 5.25.
Figure 5.25 An example of a junction potential forming at the interface between two electrolytes, as a result of a charge separation due to the difference in diffusion mobility of sodium and chloride ions.

These potentials are difficult to reproduce, tend to be unstable, and are seldom known with any accuracy. Steps should therefore be taken to minimise them. Using 4 Molar KCl as the inner filling solution in the silver-silver chloride electrode, for example, has the advantage that the K+ and Cl− ions have nearly equal mobilities and form what is known as an equi-transferrent solution. Also, the electrolyte concentration is much higher than that of the test sample solution – thus ensuring that the major portion of the current is carried by these ions. A third factor in minimising the junction potential is the fact that there is a small but constant flow of electrolyte out from the reference electrode thus inhibiting any back-diffusion of sample ions – although this is less important with modern gel electrolytes.
Representative examples of liquid junction potentials are given in Table 5.5. Although of relatively small magnitude, liquid junction potentials have to be algebraically added to the E0 factor in the Nernst Equation (5.3). Any variations in their values during analyses can be a major source of potential drift and error in measurements.
Table 5.5 Liquid junction potentials for some electrolyte interfaces. The polarity given is with respect to the side of the junction containing the solution on the left of the two cited solutions.
| Junction | Potential (mV) |
| 0.1 M NaCl | 0.1 M KCl | −6.4 |
| 0.1 M NaCl | 3.5 M KCl | −0.2 |
| 1 M NaCl | 3.5 M KCl | −1.9 |
| 0.1 M HCl | 0.1 M KCl | +27.0 |
| 0.1 M HCl | 3.5 M KCl | +3.1 |
5.6 Electrochemical Impedance Spectroscopy (EIS)
As described in Chapter 4, impedance spectroscopy can be used to analyse electrical processes occurring in a system. The technique is particularly sensitive to changes in both surface and bulk effects, and as such is a valuable technique to apply for electrochemical research and sensor applications.
A good example to consider is a simple reversible reaction at a working electrode of the form

where both the oxidised and reduced species, O and R, are soluble in the aqueous solution at the electrode. A complex impedance plot can be obtained by applying an AC voltage to the electrochemical cell. The resulting current-potential response is given by Equation (5.9). Expansion of the exponential functions in this equation into their series forms gives

For small perturbations of the working electrode's potential ([E − Eo]  [RT/αnF]) the quadratic and higher terms can be ignored, and for αC = αA = 0.5, we have
(5.11) 
with

or

depending on whether the potential is perturbed to a value above or below Eo, respectively. Thus, if the potential of the working electrode is perturbed by just a few millivolts (≤5 mV) about the value of the equilibrium potential Eo, we can assume that the current-potential response is approximately linear. The ratio (E − Eo)/I has dimensions of resistance, and the concept of a charge-transfer resistance Rct can be introduced and defined as
(5.12) 
This resistance component is small when the exchange current Io is large. As shown in Figure 5.16, apart from the impedance to current flow related to charge transfer at the electrode-solution interface, there is also effective impedance related to diffusion-controlled mass transfer. For example, the situation where O is reduced to R can be considered as three steps:
The overall impedances related to these processes can be represented as a linear combination of a resistor Rs and capacitor Cs. The charge transfer resistance Rct can be separated from the mass transport processes to give [1, ch. 9] the angular frequency (ω = 2πf) dependencies for Rs and Cs as:

For a planar diffusion front over an electrode of surface area A, σ is given by:

where DO and DR are the diffusion coefficients for the electroactive species of bulk fluid concentration [O]b and [R]b, respectively. The impedance Z of the linear combination of Rs and Cs is

which takes the form of a conventional resistance element Rs in series with a frequency-dependent element known as the Warburg impedance Zw:

The Warburg impedance possesses equal real and imaginary components, and so takes the form of a constant phase element, characterised by a constant phase angle of 45°. The magnitude of Zw is:
(5.13) 
The relative values of Zw and Rct provide an indication of the balance between mass transport control and charge transfer kinetics of an electrode reaction. Unless the charge transfer process exhibits very slow kinetics, at high frequencies the Warburg impedance will be negligible compared with the charge transfer resistance, whereas at very low frequencies it will have the dominating influence on an electrode reaction.
The total impedance of an electrochemical cell will include contributions from the counter electrode as well as the working electrode. In order to be able to focus on the reaction occurring at the working electrode, the impedance of the counter electrode is reduced to insignificance by making its surface area as large as possible. The impedance of the working electrode should also include the effective capacitance Cdl of the electrical double layer at its surface, which will appear as an element in parallel with the charge transfer resistance and Warburg impedance. The bulk electrolyte between the two electrodes will appear as a series resistance Rb, and this should also be considered. The geometrical capacitance shown in Figure 4.20 of Chapter 4 will be negligibly small, and the reactance it presents will be short-circuited by the bulk electrolyte resistance. The overall equivalent circuit for a simple reversible reaction at a working electrode system can therefore take the form shown in Figure 5.26.
Figure 5.26 Equivalent circuit that includes a charge transfer resistance Rct that controls the kinetics of a simple reversible electrode reaction, together with the Warburg impedance Zw that controls the mass transport. The resistance Rb of the bulk electrolyte and the capacitance Cdl of the electrical double layer at the electrode are also included.

At low frequencies, the real and imaginary impedance components of this equivalent circuit approach the limiting values:


Eliminating the factor σ/ω1/2 gives the relationship:
(5.14) 
A plot of −Im(Z) versus Re(Z) should thus take the form of a straight line of unit slope, intercepting the Re(Z) axis at  . At very high frequencies, where the Warburg impedance becomes negligible, the real and imaginary impedance components of the equivalent circuit shown in Figure 5.25 approach the limiting values:


Eliminating the frequency ω from these two equations, and proceeding in the same way as described in Chapter 4 (Equations 4.13–4.17) gives the result:
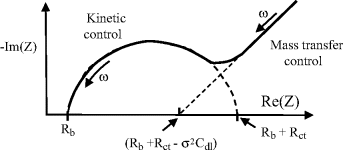
In the high-frequency range, a plot of −Im(Z) versus Re(Z) should thus take the form of a semicircle of radius Rct/2, centred on the Re(Z) axis at (Rb + Rct/2). A complex impedance plane plot that incorporates equations (5.14) and (5.15) to describe the frequency variation of the impedance of the equivalent circuit of Figure 5.26 is shown in Figure 5.26.
In Figure 5.27 the frequency range of measurement of Re(Z) and Im(Z) would typically extend from 10−3 Hz to 1 MHz, to show the kinetically controlled region of the electrode reaction (the semicircle) and the mass transport (diffusion) controlled region represented by the straight line of unit slope. It should be noted, however, that not all electrode reactions involve simple, homogeneous and reversible, reactions of the form O + ne− ↔ R. For example, the chemical species formed by electron transfer at the electrode surface may not be stable in the bulk electrolyte. It may simply be an intermediate which undergoes another chemical change to form a final product. A heterogeneous reaction might also occur, whilst the oxidised or reduced species is absorbed on the electrode, involving further chemical reactions such as the formation of dimers that might involve further charge transfer, for example. The equivalent circuit shown in Figure 5.26 would not be sufficient to describe such deviations from a homogeneous and reversible reaction. Extra components to accommodate more than one charge transfer resistance or mass transfer impedance would have to be added. The corresponding impedance plots would be more complicated than the ideal form depicted in Figure 5.27.
Figure 5.27 Complex impedance plot for the equivalent circuit of an electrode reaction shown in Figure 5.26. Mass transfer control operates at low frequencies, and kinetic control occurs at high frequencies.
5.1 Some sensors operate by monitoring changes of an electrochemical reaction at an electrode surface. An important relationship between the electrode potential E and the equilibrium concentrations of the redox couple involved in the electrochemical reaction is provided by the Nernst Equation:

 has a numerical value of 0.0592 (for n = 1).
5.2 Identify which of the following equations correctly interpret the Nernst Equation for the reaction:


5.3 Write the Nernst Equation to describe the potentials and concentrations that pertain to the following reaction:

5.4
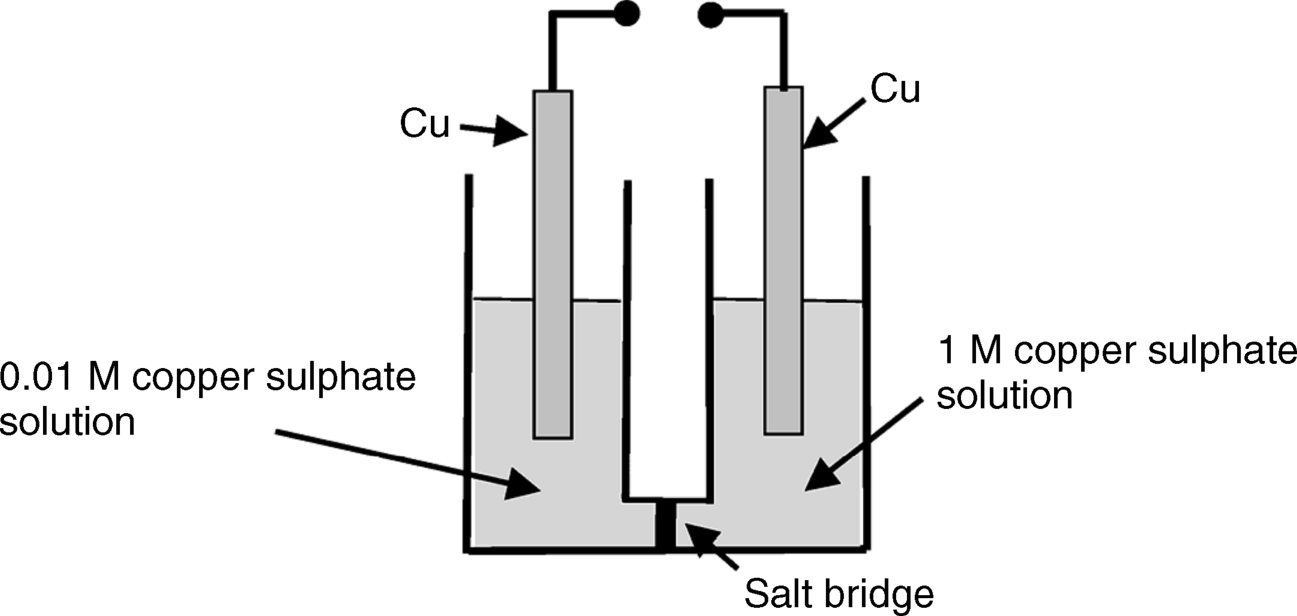
5.5 A reference electrode is often incorporated into an electrochemical sensor. What are the characteristics required of a reference electrode, and what function does it perform?
5.6 An electrochemical process at an electrode can be characterised by a charge transfer resistance of value given by the following expression:

5.7 The complex impedance plane plots obtained for two different electrode reactions are shown below, for the frequency range 10−4–104 Hz. 
1. Bard, A.J. and Faulkner, L.F. (2001) Electrochemical Methods: Fundamentals and Applications, 2nd edn, John Wiley & Sons, New York.
3. Tafel, Julius (1905) Über die Polarisation bei Kathodischer Wasserstoffentwicklung. Zeitschrift Fur Physikalische Chemie-Frankfurt, 50, 641–712.
2. Bates, R.G. and MacAskill, J.B. (1978) Standard potential of the silver-silver chloride electrode. Pure and Applied Chemistry, 50, 1701–1706.
Janz, G.J. and Ives, D.J.G. (1968) Silver, silver chloride electrodes. Annals of the New York Academy of Sciences, 148 (1), 210–221.
Thomas, F.G. and Henze, G. (2001) Introduction to Voltammetric Analysis, CSIRO Publishing, Collingwood, Australia.
Wang, J. (2006) Analytical Electrochemistry, 3rd edn, John Wiley & Sons, Hoboken, New Jersey.


