We have collected data on a limited number of demographic characteristics of our participants from the very beginning of our study. However, it was not until 1974 that we began to engage systematically in an exploration of what we then termed our participants’ microenvironment as a possible source of influences that would help us understand individual differences in cognitive aging (DeFrias, 1998; Gribbin, Schaie, & Parham, 1980; Nguyen, 2000; Schaie, 1996b; Schaie & Gribbin, 1975; Schaie & O’Hanlon, 1990; Schooler & Schaie, 1987; Yu, Ryan, Schaie, Willis, & Kolanowski, 2009).
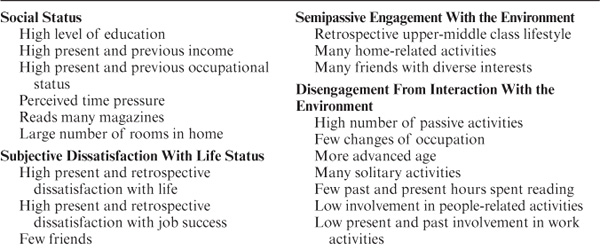
We constructed a survey instrument named the Life Complexity Inventory (LCI) that was designed to measure various aspects of our participants’ immediate environment. This questionnaire was originally administered in the spring of 1974 as a structured interview in home visits to 140 of the participants who had taken part in the first three study cycles. The data from this interview were then clustered, and eight distinct dimensions were identified (Gribbin et al., 1980). Variables comprising these item clusters are shown in table 12.1. Subsequent to the analyses described next, we made minor changes in the interview scheme and converted it to a survey instrument that has been used systematically beginning with the 1977 data collection.
The term disengagement used in the following discussion refers to the tendency of many older persons to reduce environmental stress and perhaps compensate for perceived losses in competence by reducing their interaction with other persons as well as reducing their active participation in community and their social participation (see Cumming & Henry, 1961; Havighurst, Neugarten, & Tobin, 1968).
In the initial analysis of the LCI, significant gender differences were found for two clusters. As expected, women had higher scores on the homemaker role cluster, and surprisingly, they also scored higher on the disengagement cluster than the men. With respect to age differences, we found that the younger participants scored higher on social status, whereas older participants were more disengaged and were more likely to score high on the family dissolution cluster.
TABLE 12.1. Variables Comprising LCI Item Clusters

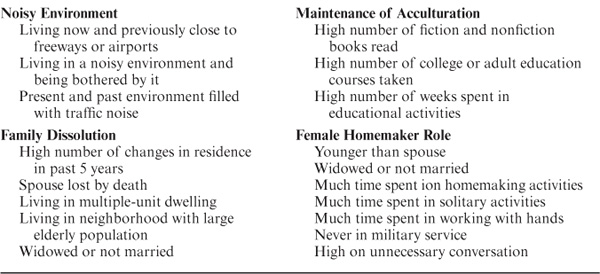
We examined the relationship between lifestyle characteristics and maintenance of cognitive function in a number of different ways. We began by clustering individuals in terms of their cluster scores on the LCI variables and were able to identify four types of individuals with distinct lifestyle characteristics who also differed markedly in maintaining high levels of cognitive performance (Gribbin et al., 1980; Schaie, 1984b).
Over both 7- and 14-year periods, we found that there was least decline for those persons who had high socioeconomic status and who were fully engaged in interaction with their environment. Next were those fully engaged persons who had average socioeconomic status. But substantial decline was found for those persons who were relatively passive in their interaction with their microenvironment (those whom we described to be semiengaged). Finally, it was the widowed women who had never had a career of their own and who showed a disengaged lifestyle who were most likely to show excess decline.
These differences in maintenance of cognitive ability level of the lifestyle types were statistically significant for all abilities except Number; they were also significant for the factor measures of cognitive style. In particular, high social status has positive predictive value, whereas disengagement has negative predictive value for the abilities. Maintenance of acculturation is a positive predictor of Word Fluency, Attitudinal Flexibility, and Psychomotor Speed, and family dissolution negatively predicts future performance on most variables. Finally, centrality of the homemaker role predicts positively to Psychomotor Speed but negatively to Spatial Orientation.
The relationship between environmental factors and cognitive functioning was examined in three doctoral dissertations and one master’s thesis conducted in my laboratory. The first dissertation (Stone, 1980) was concerned primarily with the structural relations among environmental factors, health, and cognition (see chapter 10). The second (O’Hanlon, 1993) is of particular interest as it focused primarily on the environmental factors. The third (Nguyen, 2001) was concerned with family similarities in lifestyles. I begin by describing O’Hanlon’s analysis, which included data for 1376 participants who completed the LCI as part of the 1977 data collection. It also included a subset of 779 persons for whom LCI data were available in both 1977 and 1984. Findings from this work are summarized next.
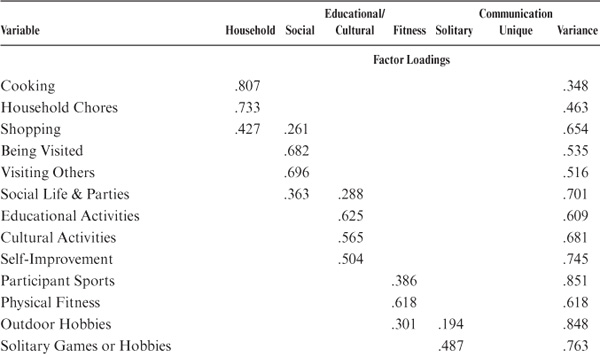
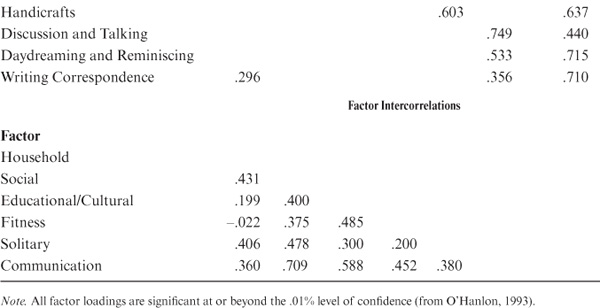
In the O’Hanlon study (1993), initial analyses focused on developing empirical dimensions for the 30 leisure activities included in the LCI (see also Maitland, O’Hanlon, & Schaie, 1990). An initial series of exploratory and confirmatory factor analyses determined that 17 of these activities had sufficient commonalities to permit the development of a six-factor model. The resulting factors were Household Activities, Social Activities, Educational-Cultural Activities, Fitness Activities, Solitary Activities, and Communicative Activities. The model was estimated on a random half of the 1,977 participants and confirmed on the other random half, maintaining excellent fit [χ2(df = 100) = 155.56, p < .001; goodness-of-fit index (GFI) = .974; AGFI = .965; RMSR = .03]. Maximum likelihood factor loading estimates and factor intercorrelations for the accepted model are given in table 12.2.
Factor scores were then calculated and a 2 (gender) × 9 (cohort) multivariate analysis of variance (MANOVA) was run to determine whether there were significant differences by age/cohort and gender. Women had significantly higher means on the Social, Solitary, and Household Activities factors; men had higher scores on the Fitness factor. No significant gender differences occurred for the Social and Communicative Activities factors. Age differences were significant between the most extreme age groups for all factors except Solitary Activities. The youngest cohorts had generally higher mean levels of participation in leisure activities than did the oldest cohorts.
TABLE 12.2. Measurement Model for the LCI Activities
Correlations between the activity factors and the Primary Mental Abilities (PMA) core variables were low to modest. The highest significant correlations were those of Verbal Meaning with Educational-Cultural (r = .37) and Communications (r = .25), Spatial Orientation with Communications (r = .19), Reasoning with Educational-Cultural (r = .26) and Communications (r = .27), and Word Fluency with Educational-Cultural (r = .27) and Communications (r = .24).
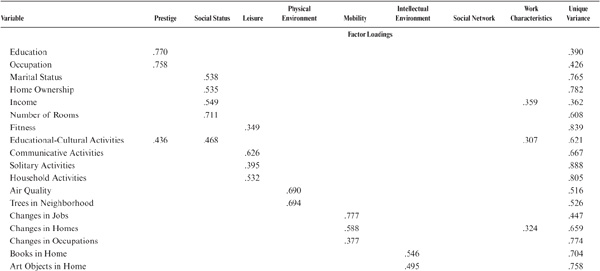
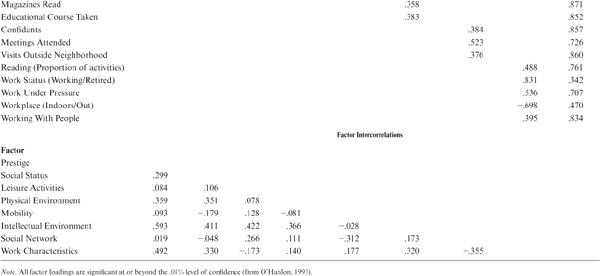
Another series of factor analyses was conducted to determine the latent dimensions of the LCI. The variables included a broad spectrum of environmental dimensions as well as the factor scores derived from the leisure activity analyses described in the preceding section. Again, the basic analyses were run on a random half of the 1977 samples, with verification of the best-fitting factor model on the remaining half. The model that was finally accepted includes 30 variables and eight factors [χ2(df = 373) = 986.09, p < .001; GFI = .912; AGFI = .890; RMSR = .05]. The environmental factors identified were Prestige, Social Status, Leisure Activities, Physical Environment, Mobility, Intellectual Environment, Social Network, and Work Characteristics. Maximum likelihood factor loading estimates and factor intercor-relations for the accepted model are given in table 12.3.
Factor scores were calculated for the eight latent lifestyle dimensions; again, a 2 (gender) × 9 (cohort) MANOVA was run to determine gender and age/cohort differences. It was found that men had significantly higher scores than women on the Prestige, Social Status, and Work factors. Women had significantly higher scores on the Leisure Activities factor, but no significant sex differences were found for Physical Environment, Mobility, Intellectual Environment, and Social Network. Age/cohort differences were significant for all factors except for Physical Environment.
In general, age differences were in favor of the younger cohorts. For the Social Status factor, there was a significant difference between the youngest cohort (mean age 25 years) and the three oldest cohorts (mean ages 67 years and older); none of the other cohorts differed significantly. With respect to the Leisure Activities factor, all other cohorts were significantly above the level of the oldest cohort (mean age 81 years). On the Intellectual Environment factor, the middle-aged cohorts (mean ages 39 to 53 years) were significantly above the two oldest cohorts. The youngest cohort was also above the level of the oldest cohort. With respect to the Mobility factor, the youngest cohort (mean age 25 years) was significantly above all other cohorts. Those in early middle age (cohorts with mean ages 32 and 39 years) were also significantly more mobile than all cohorts above a mean age of 60 years.
Considering the Prestige factor, it is interesting to note that the cohort in early middle age (mean age 32 years) exceeded the level of persons who were in their 60s or older. In addition, the middle-aged exceeded the oldest cohorts. Not surprisingly, all cohorts exceeded the two oldest cohorts on the Work factor. The Social Status factor, however, showed a rather different pattern. Here, the cohort with a mean age of 46 years was significantly higher than all but the two adjacent cohorts.
Finally, we observed a significant Gender × Cohort interaction for the Mobility factor. Women had lower means for all cohorts except one of the middle-aged cohorts (mean age 46 years). For this cohort, women exceeded men in Mobility level.
Again the lifestyle factor scores were correlated with the core mental abilities. Three factors showed strong ability correlates: Prestige, Social Status, and Work Characteristics. These three were positively correlated with the ability scores, with correlations ranging from .27 to .51. Lower, but still significant, correlations were found for the Leisure, Intellectual Environment, and Physical Environment factors. There were no significant correlations with the extent of the participants’ Social Network.
TABLE 12.3. Measurement Model for the LCI Lifestyle Dimensions
As an alternative approach, O’Hanlon (1993) also investigated the characterization of our participants in terms of their lifestyle profiles. Using cluster analysis, she identified 11 clusters of persons who had similar profiles but differed from other cluster types in certain salient characteristics. Participant type was then entered as an independent variable in the MANOVA of cognitive abilities.
This analysis identified three clusters with members who performed significantly worse on the mental abilities than did member of other clusters. Individuals in these same cluster types also scored lower than those in other clusters on various permutations of environmental factors. The adverse factors typically represented low scores on the Prestige, Social Status, and Work Characteristics or on the Intellectual and Physical Environment factors. By contrast, the participant cluster characterized by above-average scores on the Prestige, Social Status, Intellectual Environment, and Work Characteristics factors also performed significantly better than other cluster types on Verbal Meaning, Space, Reasoning, and Word Fluency. In addition, the cluster that exhibited moderately high Mobility and Intellectual Environment scores scored significantly above average on Verbal Meaning, Space, and Reasoning abilities.
A series of confirmatory factor analyses determined whether the LCI dimensions developed on the basis of the 1977 sample would be maintained longitudinally over a 7-year period. Confirmatory models constraining factor loading across time, for the participants still available in 1984, were tested for both the leisure activities data and for the lifestyle factors described above. The structure of the leisure activities remained invariant by the most stringent criteria (invariance of patterns, loadings, and error variances across time). The lifestyle latent variable structure was somewhat less stable. However, it was possible to accept the equivalence of factor patterns across times (configural invariance).
A 2 (gender) × 9 (cohort) repeated measurement MANOVA was next run to determine whether there was longitudinal stability in mean levels. No statistically significant changes in mean level were found over the 7-year period for any of the leisure activities factors for any of the gender or age/cohort groupings.
When a similar analysis was conducted for the eight LCI lifestyle factors, however, several significant findings emerged. A significant Gender × Time effect was found only for the Work Characteristics factor, with women showing an increase at the second time of measurement. Significant Time × Age/Cohort interactions were found for Social Status, with the two youngest cohorts gaining significantly on this factor over the 7 years; all other cohorts remained stable. With respect to the Mobility factor, there was a significant increase in mobility over time for the four youngest cohorts and reduced mobility for all other cohorts. The youngest four cohorts also showed a significant increase on the Work factor, whereas the cohort with a mean age of 53 years at base measurement decreased significantly over the 7 years.
A final series of analyses examined the question of whether stability in the lifestyle variables might be influenced by the marked lifestyle changes brought about by retirement. The longitudinal sample was divided into three groups: those who reported that they were working in both 1977 and 1984; those who were working in 1977, but were retired in 1984; and those who had retired prior to 1977. Repeated measurement MANOVAs were then run crossing gender, work status, and time of measurement.
The effects of greatest interest with respect to the leisure activities are those concerned with the question of whether retirement significantly affects participation in leisure activities. The Retirement Status × Time interaction was indeed significant. For those recently retired, there was a significant increase in Social Activities, Solitary Activities, and Household Activities. On the other hand, both the long-term retired and working groups showed decline over time in Social Activities, and the working group declined in Household Activities.
Similar analyses were conducted for the LCI lifestyle factors. There was an overall increase over time for the Work factor, as well as several significant Retirement Status × Time interactions. On the Prestige factor, the working group showed an increase over time, and the retired groups showed a decrease. Consistent with the analyses of the leisure activities, the Leisure factor showed a significant increase for the recently retired, but decreases for those working and for the long-term retirees. With respect to Mobility, those working showed an increase, those recently retired remained stable, and the long-term retirees decreased. Finally, on the Work factor, as expected, the recently retired showed a significant decrease, whereas those still working showed an increase.
In an effort to explore the structure of intergenerational cohesion, Nguyen (2000) confirmed the structural invariance of the lifestyle dimensions identified by O’Hanlon (1993) and then examined similarities and differences between parents and their adult offspring and between adult siblings.
The subset from the SLS included in the following analysis included participants of the 1989 and 1996 family studies who were matched against members of the longitudinal panel who participated in either 1984 or 1996 waves. A total of 1,012 parent–offspring pairs were matched. These included 216 father–son, 268 father–daughter, 206 mother–son, and 412 mother–daughter pairings. The following ages applied to this sample: parents, M = 67.6, SD = 10.0, range = 41 to 92 years; offspring, M = 43.4, SD = 10.3, range 22 to 72 years. The mean age difference between parents and offspring was 24.2 years. The sample was divided into two age groups consisting of those with parents who were younger or older than 65 years.
In a similar manner, 655 sibling pairs were identified. Of these, 121 were brother–brother pairs, 239 sister–sister pairs, and 295 brother–sister pairs. Average ages for the siblings were as follows: longitudinal study members, M = 57.2, SD = 14.9 years; relatives, M = 59.8, SD = 14.8 years. The average age difference within sibling pairs was 2.6 years. This sample was also divided into two age groups according to whether the older sibling was either younger or older than 65 years.
Six of the dimensions from the LCI determined by O’Hanlon (see above) were included in this analysis: Prestige, Social Status, Physical Environment, Intellectual Environment, Social Network, and Work Complexity.
Multiple group restricted factor analyses (LISREL 8.14; Jöreskog & Sörbom, 1993) were used to test factorial invariance (see chapter 2). Tests of invariance were conducted for the total samples as well as the various specific relationship subsets. Family similarity was then examined by comparing the within-dyad concordance of the lifestyle factors.
An initial analysis within the parent–offspring dyads specified a configural invariance baseline model for which a reasonable fit was obtained (χ2 = 1514.56, df = 580, root-mean-square error of approximation [RMSEA] = .04, GFI = .93). The test of weak invariance, the constraining factor loading across groups, resulted in a significant decrease in fit (Δχ2 = 68.69, df = 13, p < .01). Hence, configural invariance was accepted as the best fit. Lifestyle characteristics for which loadings could not be constrained across generations included marital status, home ownership, living characteristics, social network, and work characteristics.
Configural invariance was also the accepted model for the father–son, father–daughter, mother–son, and mother–daughter subsets, as well as for the subgroups of older and younger parent–offspring dyad sets.
Next examined was the structural similarity between sibling dyads. The accepted baseline model had a reasonable fit (χ2 1036.20, df = 580, RMSEA = .04, GFI = .93). Again, a test of weak factorial invariance resulted in a significant decrease in fit (ΔX2 = 39.24, df = 13, p < .01) and therefore had to be rejected. Lifestyle characteristics that could not be fit across sibling dyads included home ownership neighborhood, social network, and work characteristics.
In contrast to the parent–offspring results, it was possible, however, to accept weak factorial invariance for the sister–sister and brother–brother, but not for the brother–sister, dyads. Weak factorial within-dyad invariance could also be accepted for the older, but not for the younger, sibling dyads.
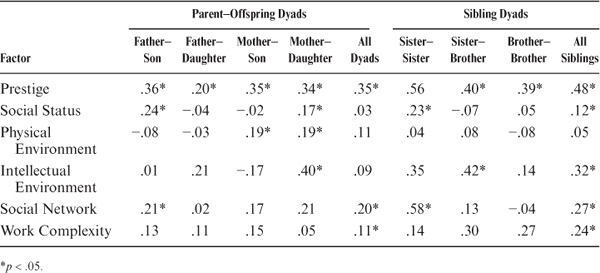
Intergenerational and within-generation lifestyle similarity was next examined by considering the magnitudes of factor correlations across dyads. These concordance coefficients are reported in table 12.4. The parent–offspring correlations were quite modest, ranging from 0.11 to 0.35. The highest subgroup correlations occurred for mother–daughter dyads and the lowest for father–daughter dyads. Little difference was found between age groups.
Somewhat greater similarity, ranging from 0.12 to 0.48, was found within sibling dyads. Concordance within sibling dyads was highest for sister–sister and lowest for brother–brother pairs. Slightly higher concordance was found for older as compared with younger sibling pairs.
Structural invariance of lifestyle factors was limited to the configural invariance level between parent–offspring pairs, but weak invariance could be accepted for sister–sister and brother–brother dyads. Family similarity as measured by concordance of factor correlations was quite modest, but again greater within sibling than parent–offspring pairs.
Several analyses of the effects of work and retirement on cognitive functioning have been conducted by DeFrias (1998). This work was informed by Schooler’s (1987, 1990) environmental complexity hypothesis. Schooler argued that environmental complexity is determined by the stimulus variability and intensity of demands of an individual’s environment. Deleterious cognitive effects may arise by overexposure to routine or nonstimulating settings. On the other hand, immersion in environments that demand continued use and practice of intellectual skills may favorably affect cognitive maintenance into old age. Some empirical support for the disuse perspective suggests that involvement in intellectually stimulating activities may buffer against decline in cognitive functioning (Hultsch, Hertzog, Dixon, & Small, 1999; Kohn et al., 1983; Schooler, Mulatu, & Oates, 1999). A potential moderating role of the timing of retirement on the above relationship has been suggested by other studies (Avolio & Waldman, 1990, 1994; Avolio, Waldman, & McDaniel, 1990; DeFrias & Schaie, 2001; Dutta, Schulenberg, & Lair, 1986).
TABLE 12.4. Concordance of Lifestyle Factors Within Family Dyads
In the following sections, I first report the effects of work characteristics on change in cognitive abilities over a 7-year period; second, I examine the potentially moderating role of the timing of retirement on this relationship; and third, I ask whether there are gender differences in the environment–cognition relationship.
The subsample included in these analysis met the following criteria: In 1984, participants were between the ages of 55 and 70 years, so that by 1991 they had reached the minimum eligibility age for Social Security pensions; all participants were working in 1984. Based on these criteria, these analyses included 164 participants (93 men and 71 women) who in 1984 had a mean age of 60.17 years (SD = 3.92; range 55–70 years). Their mean educational level in 1984 was 15.1 years (SD = 2.8; range 8–20). The median income in 1984 was $36,324. In 1984, the participants worked in a number of different occupations, ranging from blue collar to professional (Mdn = 3.0; range 1–5). By 1991, 60% of the participants were retired.
Cognitive abilities include the five measures from our basic ability battery (Verbal Meaning, Spatial Orientation, Inductive Reasoning, Number, and Word Fluency) as well as the measure of Immediate Recall. Four global indicators of work characteristics include number of hours spent reading and writing, working with one’s hands, and dealing with other people. More specific indicators measure number of persons interacted with, speed at which work is controlled, doing the same or different tasks, and length of time required to complete an average task (see discussion of LCI above and chapter 3 for further details).
Two analytic techniques were utilized. First, a confirmatory factor analysis using LISREL 8.3 (Jöreskog & Sörbom, 1993) was performed on the LCI work variables using a larger SLS sample. The factors extracted from the analyses represent the three work constructs (Complexity, Control, and Routine) used in further analyses; and second, a 2 (gender) × 2 (retirement status) × 2 (work level) × 2 (occasion) repeated measures multivariate analysis of covariance (MANCOVA) with age and education as the covariates was performed on the six cognitive measures.
The fit of a three-factor model was tested to create summary work-related variables for use in further analyses. To obtain more stable parameter estimates, we tested the expected three-factor model in a larger SLS sample (n = 1567). The three factors were labeled Complexity, Control, and Routine. Variables marking the Complexity factor were reading/writing, dealing with people, and number of employees. Variables marking the Control factor were speed control and working under time pressure. Variables marking the Routine factor were working with hands, routinization of tasks, and task duration.
The three-factor model was estimated by maximum likelihood methods using the correlation matrix presented in table A-12.1 in the appendix. In addition to the chi-square statistic, which is sensitive to sample size, other fit indices include the comparative fit index (CFI; Bentler, 1990), GFI (Jöreskog & Sörbom, 1993), and RMSEA (Steiger, 1990). Based on these indices, the model fits the data reasonably well: χ2 = 80.97, df = 17, CFI = .92, GFI = .99, RMSEA = .05. All LCI items loaded significantly onto their expected factors (see table 12.5).
Composite factor scores were next created by summing across the indicator variables and calculating an average score. These composite scores were then used in further MANCOVA analyses.
A four-way (2 Gender × 2 Retirement Statuses × 2 Work Levels × 2 Occasions) repeated measures MANCOVA examined change over 7 years in cognitive abilities. Three separate models were examined, one for each work factor (i.e., Complexity, Control, and Routine). The covariates used for these analyses were age and education to partial out the variance explained by these variables before analyzing the influence of retirement status and work level on change in cognitive abilities.
TABLE 12.5. Standardized Factor Loadings for the LCI Work Factors

The combined cognitive scores were significantly affected by a retirement status by Job Complexity interaction, an occasion by Job Complexity interaction, an occasion by gender by retirement status by Job Complexity interaction, and a gender by Routine interaction.
Univariate tests revealed significant main effects for retirement status on Immediate Recall and Job Complexity on Immediate Recall. The group not retired scored higher on Immediate Recall than the retired group. The group with high Job Complexity scored higher than the group with low Job Complexity.
The low Routine group declined on Spatial Orientation over the 7-year period; the group with high Job Complexity experienced no reliable change over the same time period. The group with low Job Complexity also declined in Word Fluency.
Among the group already retired, those who had been involved in relatively low Control jobs experienced decline in Number performance); those in jobs with relatively high Control remained stable. Among the not-retired group, women scored lower than men on Spatial Orientation.
These analyses provide evidence for the beneficial impact of Job Complexity and Control over aspects of work for the maintenance of cognitive performance. Interestingly, in select relations those workers in relatively routine jobs outperformed workers in jobs involving changing task demands. Perhaps there is a balance between level of task demand and the maintenance of cognitive functioning, especially in the presence of decline in cognitive resources with aging.
However, some of our findings support the notion that occupational self-direction and delayed retirement are conducive to slowing the process of cognitive decline evident in the sixth and seventh decades of the life span. Low occupational self-direction was associated with cognitive decline, perhaps because of a lack of full use of one’s abilities. Given the increase in individual differences in late adulthood, training programs might perhaps help older adults prolong their competency levels in the workforce until later ages. Successful aging in the domain of work (cf. Abraham & Hansson, 1995; Schaie & Schooler, 1998), as with other contexts (cf. Freund & Baltes, 1998), depends on an optimal match between the changing demands of the work contexts and the skills available to the worker. Some combinations of work contexts and individual capabilities may well be uniquely synergistic.
A recent study has examined the association of four modifiable factors (leisure time physical activities, self-directed work, and hypertension) with two aspects of fluid intelligence (Verbal Meaning and Inductive Reasoning) by means of multilevel modeling (MLM; Yu et al., 2009).
Participants included in this secondary analysis had completed three waves of SLS data collections (in 1984, 1991, and 1998) and who had complete data for the independent variables of leisure time physical activity, leisure time cognitive activity, and self-directed work. This resulted in a sample of 626 participants. The average age of the sample at T1 in 1984 was 53.2 years (SD = 12.76, range = 23–82).
A repeated measures MLM was conducted including the following four steps: First, unconditional means models estimating the effects of random intercepts on each dependent variable were specified to compute intraclass correlations. Second, unconditioned growth curve models testing fixed and random effects of age and time-in-study for each dependent variable were specified. Third, conditioned growth curve models adding tests of fixed effects of the independent variables were specified. Fourth, conditioned growth curve models including other covariates (income, education, and sex) were specified. All models were estimated using SAS procedure mixed to examine the patterns of intra- and interindividual differences in the dependent variables across three waves.
The unconditional means models had an intraclass correlation of .72, indicating that about three quarters of the variance in verbal memory across the three waves was between persons. Unconditional growth models testing fixed effects of age and time-in-study indicated significant cohort effects; hence, both age and time-in-study effects were retained. Time-in-study changed in concert with age. A small but significant interaction between age and time-in-study was found and included in the unconditional growth curve model (see figure 12.1). A significant fixed effect for time-in-study (p < .001) indicated an average gain verbal memory with increasing years in study. However, the fixed effect of age was negative (p < .001), confirming a decline in verbal memory with increasing age.
In the conditioned growth curve model, relative to a 60-year-old, every added year of age was associated with a 0.21 T-score point decline in verbal memory (see table 12.6). Work control was associated with memory gains, as were having more years of education and higher income.
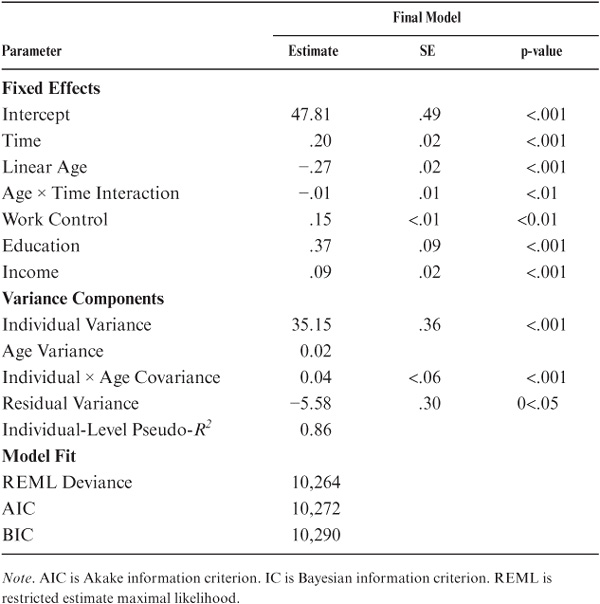
The unconditioned means model showed an intraclass correlation of .87. In this model fixed effects of both age (negative) and time-in-study (positive) were significant, as was the interaction between age and time-in-study (see Figure 12.2). Finally, after testing random slopes of both age and time, a significant age effect was found. Independent variables affecting the grown curve models include work control, higher income, and higher education (see Table 12.7).
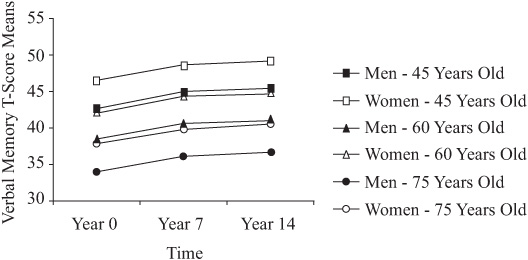
FIGURE 12.1. Predicted Verbal Memory by age and gender over time.
The LCI has been used since 1974 to characterize the microenvironment of participants in the SLS. Early analyses of this instrument identified eight lifestyle factors that were related to our measures of intellectual abilities. Four participant types were identified: the affluent fully engaged, those of average socioeconomic status who were fully engaged, the semiengaged, and widowed homemakers. The first two groups maintained their levels of intellectual functioning or even showed modest improvement over 7 and 14 years; the other two groups showed significant decline— substantial for the widowed homemakers.
TABLE 12.6. Final Multivariate Model for Verbal Memory (N = 652)
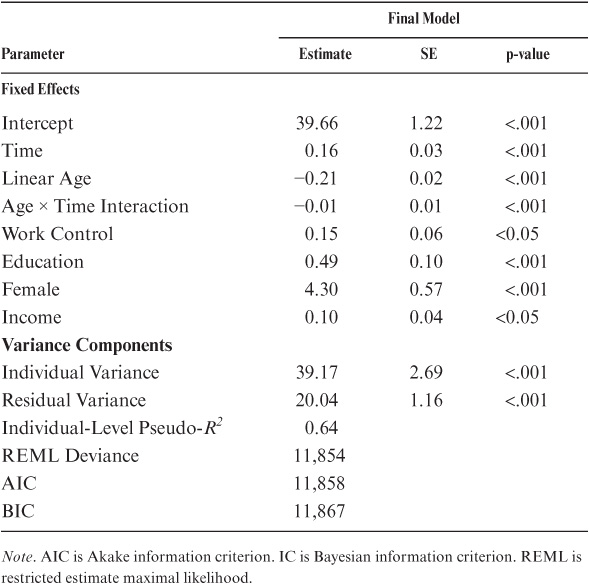
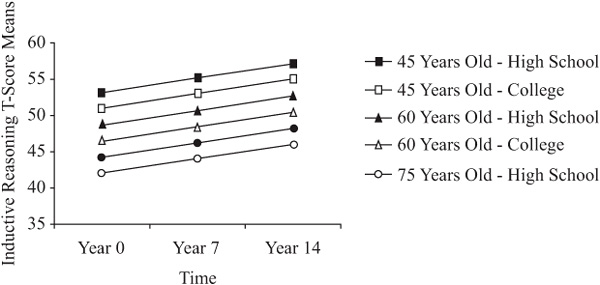
FIGURE 12.2. Predicted Inductive Reasoning by age and education.
More recent analyses utilized larger samples to establish six dimensions of the leisure activities contained in the LCI: Household Activities, Social Activities, Educational-Cultural Activities, Fitness Activities, Solitary Activities, and Communicative Activities. Factor scores for these dimensions were included in the analysis of the remaining LCI variables, with an eight-factor lifestyle dimensions structure emerging: Prestige, Social Status, Leisure Activities, Physical Environment, Mobility, Intellectual Environment, Social Network, and Work Characteristics. Women exceeded men on the Social, Solitary, and Household Activities factors; men scored higher on the Fitness factor. The youngest age group exceeded the oldest group on all factors except Solitary Activities. The younger cohorts scored higher in Leisure Activities. Men exceeded women on the Prestige, Social Status, and Work lifestyle factors; women scored higher on Leisure Activities.
TABLE 12.7. Final Multivariate Model for Inductive Reasoning (N = 626)
Low-to-modest positive correlations were found between amount of leisure activity and levels of cognitive functioning. Positive lifestyle characteristics were also correlated with high levels of cognitive functioning, with the dimensions of Prestige, Social Status, and Work Characteristics showing the highest correlations. Longitudinal stability was demonstrated at the metric invariance level for the leisure activities factors and at the configural invariance level for the lifestyle dimensions.
Family similarity in lifestyles was examined for parent–offspring and sibling dyads. Factorial invariance was observed at the configural level for the parent–offspring dyads and at the weak factorial invariance level for the siblings. Family similarity was greater within than across generations and greatest for mother–daughter and sister–sister pairs.
Finally, we examined the effects of work characteristics and retirement on cognitive functions. Complex work situations and low routinization of the workplace support maintenance of cognitive functions; retirement is enhancing for those in routine jobs, but less favorable for those who have experienced challenging and complex job situations. No significant level changes occurred over 7 years for the Leisure Activities. However, there was an increase over time for women on Work Characteristics. The two youngest cohorts gained significantly on Prestige, and there was an increase in Mobility and Work Characteristics for the four youngest cohorts, with reduced Mobility for all others. Retirement increased Leisure Activities for the recently retired, with a reduction of activities for those working or retired for a substantial time. As expected, the retired showed a decrease in Work and Prestige; the opposite pattern prevailed for those still working after 7 years. Work control was also positively related to the maintenance of Verbal Memory and Inductive Reasoning.