Although the study of personality has not been the central focus of the Seattle Longitudinal Study (SLS), a large body of data on a limited number of personality traits and attitudes was acquired almost incidentally. These data come primarily from the Test of Behavioral Rigidity (TBR; Schaie, 1955, 1960; Schaie & Parham, 1975). As mentioned in chapter 3, when I constructed the TBR questionnaire that provided the base for our latent construct of Attitudinal Flexibility, I included as masking items a set of 44 items from the Social Responsibility scale of the California Psychological Inventory (Gough, 1957; Gough, McCloskey, & Meehl, 1952). The sequential data (cross-sectional and longitudinal) on this scale are, of course, of interest in their own right in chronicling stability and change on this trait over the adult age range and time period covered by our study.
I soon realized, moreover, that personality and/or attitudinal true-and-false questionnaire items are likely to carry information on other personality characteristics than the particular traits for which they were originally selected. Hence, we began to engage in item factor analyses of the entire set of 75 items contained in the TBR questionnaire (see Maitland, Dutta, Schaie, & Willis, 1992; Schaie, 1996b, 2005a; Schaie & Parham, 1976).
In this chapter, I first report findings with respect to the directly observed trait of social responsibility. I then describe the work on personality traits derived from the 75 TBR questionnaire items. Next I provide data relating the TBR-derived personality factors to the NEO. Finally, I describe new work on the Center for Epidemiologic Studies–Depression Scale (CES-D) questionnaire used as a subjective measure of depression in our study participants older than 60 years.
Initial cross-sectional findings for the Social Responsibility scale were reported on the base-level study (Schaie, 1959b), and sequential models have been applied to this scale on data from the first three cycles (Schaie & Parham, 1974). In the following sections, I report data over all seven study-occasions and use the format employed for the cognitive data.
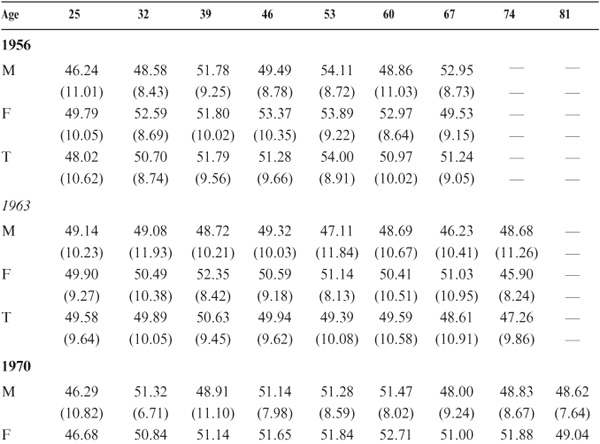
Means and standard deviations by gender for the total sample are reported by test occasion in table 13.1. As can be seen from figure 13.1, there is a tendency for the cross-sectional data to suggest relatively lower responsibility levels until early mid-life and from then on what seem to be occasion-specific age differences. That is, for the early cohorts, lower levels are shown into old age, whereas for the more recent cohorts, there seem to be favorable trends for the oldest groups.
TABLE 13.1. Means and Standard Deviations for the Social Responsibility Scale, by Sample and Gender

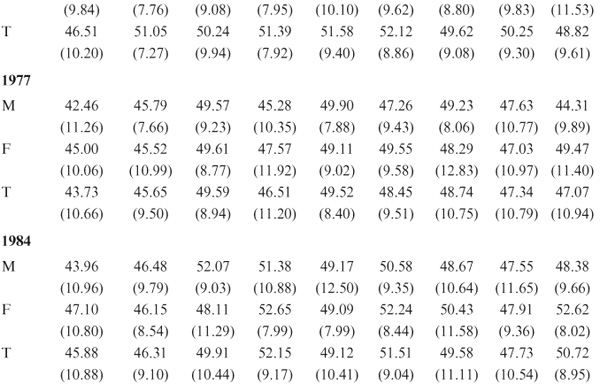
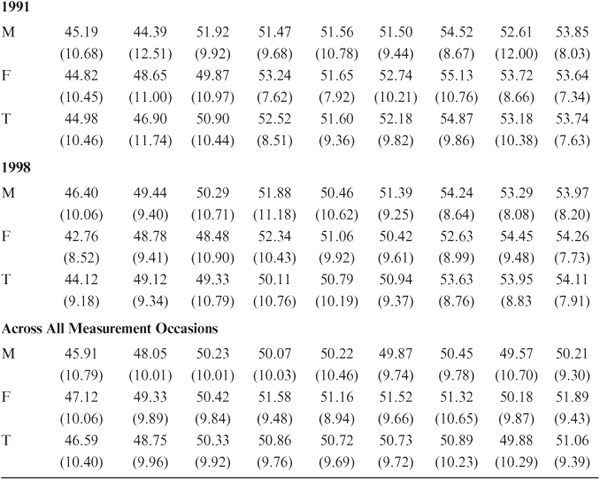
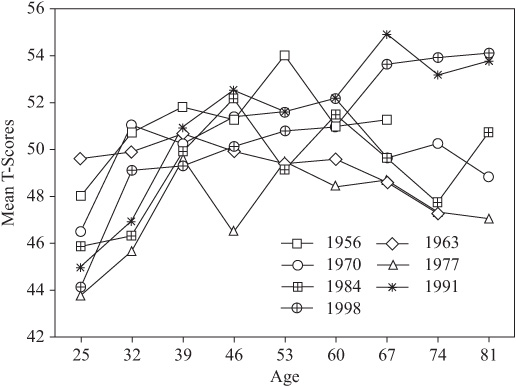
FIGURE 13.1. Age difference patterns for the Social Responsibility scale for the total sample by test occasion.
The longitudinal data reported here were averaged across all participants within each 7-year age segment over all periods for which appropriate 7-year data are available. By contrast to the cross-sectional data, the longitudinal estimates provided in table 13.2 and graphed in figure 13.2 separately by gender suggest that there is a modest gain in Social Responsibility until age 74 years, followed by a minimal decline thereafter. A gender difference in favor of women occurs until age 46 years.
When examined over all seven waves, cohort effects for the Social Responsibility scale are not very pronounced. There is a modest concave pattern, but it is only the 1952 cohort that has a significantly lower level of Social Responsibility than some of the other cohorts (see table 13.3). With respect to secular trends, it appears that Social Responsibility was at a nadir at the 1977 measurement occasion. Significant overall decline in reported Social Responsibility was found from 1956 to 1977, whereas a significant increase occurred from 1977 through 1998 (see table 13.4).
An item factor analysis of the 75 TBR questionnaire items using all available data from the 1963 and 1970 data collections resulted in the acceptance of a 19-factor structure. The resultant factors were matched by content to Cattell’s (1957) personality taxonomy. Of the factors, 13 appeared to me to be substantively similar to one of the trait ends of the Cattell taxonomy; the remaining factors appeared to be primarily attitudinal in nature (see table 13.5). The factor scores estimated for these factors were then subjected to analyses of variance utilizing sequential strategies. Given the availability of only two points in time, these analyses had to be limited to the cross-sequential and time-sequential strategies. By comparing results from these alternative analyses, it was possible to identify three types of developmental pattern for the personality traits: biostable, acculturated, and biocultural (see Schaie & Parham, 1976).
TABLE 13.2. Cumulative Age Changes for the Scale of Social Responsibility in T-Score Points (N = 6143)
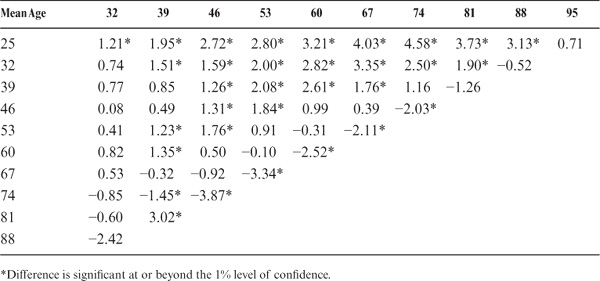
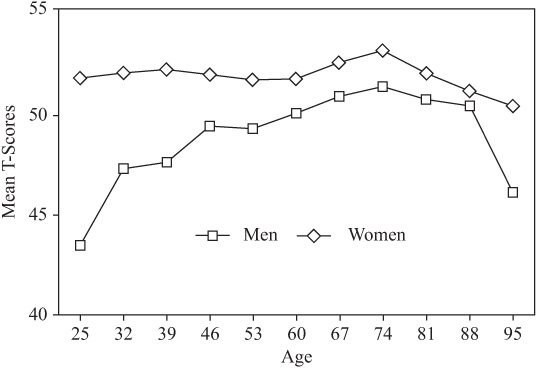
FIGURE 13.2. Estimated age changes from 7-year data by gender for the Social Responsibility scale.
TABLE 13.3. Mean Advantage of Later-Born Cohorts Over Earlier-Born Cohorts on the Social Responsibility Scale in T-Score Points
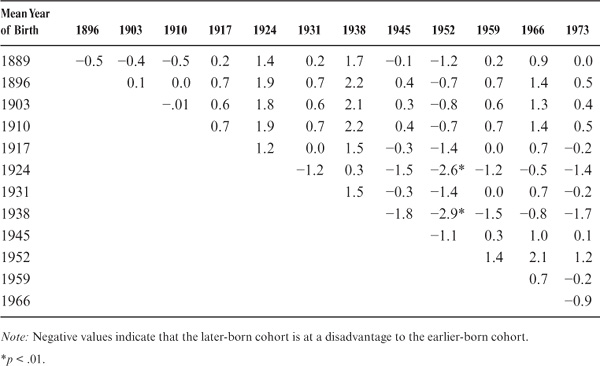
TABLE 13.4. Period (Time-of-Measurement) Effects for the Scale of Social Responsibility in T-Score Points
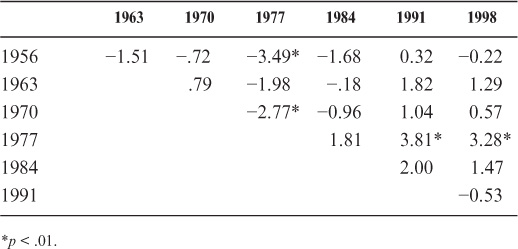
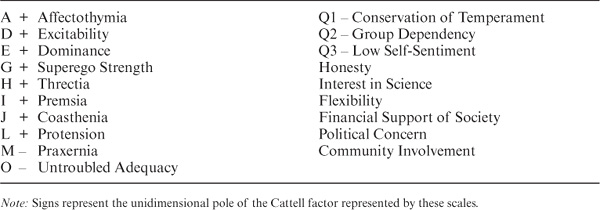
TABLE 13.5. List of 19 Personality Traits from the TBR Questionnaire
Three types of personality traits were distinguished that are thought to have differential developmental patterns: biostable, acculturated, and biocultural traits.
Biostable traits represent a class of behaviors that may be genetically determined or constrained by environmental influences that occur early in life, perhaps during a critical imprinting period. These traits typically show systematic gender differences at all age levels but are rather stable across age, whether examined in cross-sectional or longitudinal data. Acculturated traits, conversely, appear to be overdetermined by environmental events occurring at different life stages and tend to be prone to rather rapid modification in response to sociocultural change. These traits usually do not display systematic gender differences. Their age differences rarely form systematic patterns and can usually be resolved into generational shifts and/or secular trend components on sequential analysis. Biocultural traits display ontogenetic trends with expression that is modified either by generational shifts or by sociocultural events that affect all age levels in a similar fashion. Cross-sectional data for such traits would typically show Age × Gender interactions.
Four subtypes are possible for the biostable traits:
1. Gender differences only. Such traits would seem to be overdetermined by genetic variance, probably located on the sex chromosome. The only trait that fit this paradigm in our study was Premsia (tender-mindedness, which was higher for women), but even that gender difference was barely significant and must be treated with caution. We suggest that it is probably unreasonable to expect to find personality traits that fit the purely inherited category without ambiguity.
2. Period differences only. Such traits also appear to be overdetermined by genetic variance, but they are modified in their expression by secular sociocultural trends. In our analysis, this type of trait was represented by Untroubled Adequacy, which showed a decrease over the 7 years monitored.
3. Cohort differences only. These traits are not subject to transient environmental influences but seem to reflect generation-specific patterns in early training or socialization procedures. This would seem to be the modal pattern for those traits that are indeed determined by early socialization. The traits matching this category observed in our study were Threat Reactivity, Coasthenia, expressed Honesty, Interest in Science, and Community Involvement.
4. Period and cohort differences. A final subtype involves development of a trait in response to early socialization as well as to transient sociocultural impact. Both Praxernia and Group Dependence followed that pattern in our study.
It is the acculturated traits that display no gender difference but may show a variety of combinations of age changes and/or period and cohort differences. Six possible subtypes can be identified:
1. Age changes only. This type of trait reflects social roles that are determined by universals that underlie stage models of human development (see Piaget, 1972; Schaie, 1977–1978; Schaie & Willis, 2000b) and that are rather impermeable to cohort differences or secular trends. The only trait that met these criteria was Humanitarian Concern, which showed increase with age.
2. Age changes and cohort differences. Such traits are mediated by life stage changes in universally determined life roles, which in turn are modified by generational shifts in early socialization practices. Identification of traits of this type was not possible in this data set because a cohort-sequential data matrix would have been required for their identification.
3. Age changes and period differences. Such traits are determined by universally prescribed life roles that are impermeable to early socialization practices but are subject to transient secular impacts for persons of all ages. It is difficult to imagine that a trait could have such attributes, and none of those included in our study fit this pattern.
4. Cohort differences only. Such traits are not subject to ontogenetic change, but instead their development is mediated by generation-specific patterns of early socialization practices. This pattern prevailed for Affectothymia, Superego Strength, Protension, and Low Self-Sentiment. Except for Superego Strength, it is conceivable, however, that these traits could also have fit Subtype 2 above if we had the appropriate data to test for the presence of both age and cohort differences.
5. Period differences only. Such traits are not age related and are independent of shifts in early socialization practices. However, they are affected by sociocultural impact for all age levels. Dominance and Financial Support of Society fit this pattern.
6. Cohort and period differences. Non-age-related traits may be modified both by specific patterns of early socialization and by transient sociocultural changes that affect individuals at all ages. In our study, it was the Flexibility factor that showed these characteristics, displaying a general pattern toward greater flexibility across cohorts, accompanied by additional increase in flexibility across the periods monitored.
Biocultural traits are overdetermined by genetic variance and consequently show significant gender differences, but also are modified in their expression because of universally experienced life stage expectancies or the effects of early socialization experiences. Three subtypes were identified:
1. Age changes only. Such traits are characterized by clear ontogenetic “programs” that seem to be impermeable to cohort differences or sociocultural change. Our only example of this type was Excitability, which systematically increased with age.
2. Age changes and cohort differences. Such traits, in addition to systematic ontogenetic shifts, are modified in level by generation-specific socialization practices. Again, our data set did not permit clear identification of such traits; it is probably unlikely that they exist.
3. Age changes and period differences. Such traits have clear ontogenetic programs but are amenable to modification because of specific environmental interventions that affect persons at all ages. The only trait that fit this criterion in our study was Premsia.
Our principal conclusion from this analysis was that age-related change in personality traits was quite rare, but that cohort and period differences were common and would lead to the spurious reporting of lack of stability for personality traits when reliance is primarily on cross-sectional data.
Although we continued to collect the personality item data at all subsequent test occasions, if only to be able to measure the cognitive style of Attitudinal Flexibility, we did not go beyond the work summarized above until the late 1980s.
The original work on the personality items had been conducted by then state-of-the-art methods of exploratory factor analysis that did not allow adequate tests of the number of nonrandom factors represented in the item pool or allow formal tests confirming the invariance of factor structures over time.
Results of more recent item factor analyses are now summarized. Then, cross-sectional and longitudinal findings on the developmental patterns of factor scores for the resultant latent constructs are considered, followed by analyses focusing on the relationship of the derived scales to other constructs investigated in the SLS (see Maitland et al., 1992; Maitland & Schaie, 1991; Maitland, Willis, & Schaie, 1993; Schaie & Willis, 1991; Schaie, Willis, & Caskie, 2004; Willis, Schaie, & Maitland, 1992).
Contemporary analysis techniques (using linear structural relations [LISREL] 7) were used to confirm the factor structure identified in the earlier work (Schaie & Parham, 1976). The database for this analysis included the 2,515 test records used in the original study as well as an additional 2,811 tests accumulated in the 1977 and 1984 cycles. When confirmatory factor analysis was used to assess the fit for the 19-factor model determined in the exploratory analyses, it was determined that the data had been overfitted, resulting in several factors with extremely high factor inter-correlations. Further consideration of the number of factors unambiguously represented in the data resulted in an acceptable 13-factor model with good fit [χ2(df = 1191) = 3548.16, p < .001; goodness-of-fit index (GFI) = .945; RMSR = .007]. The 13-factor model was then tested on the participants assessed in 1977 and 1984, and it continued to show an acceptable fit [χ2(df = 1191) = 4302.98, p < .001; GFI = .941; RMSR = .007]. A two-group analysis further investigated factorial invariance across time by constraining factor loadings and factor variance–covariance matrices to be equal across the two data sets. This analysis also yielded an acceptable fit [χ2(df = 2512) = 6910.00, p < .001; GFI = .945; RMSR = .007].
The 13-factor model includes eight factors that can be mapped on the Cattell (1957; Cattell, Eber, & Tatsuoka, 1970) taxonomy of personality dimensions: Affectothymia, Superego Strength, Threctia, Premsia, Untroubled Adequacy, Conservatism of Temperament, Group Dependency, and Low Self-Sentiment. The remaining five factors are best described as attitudinal traits and were labeled Honesty, Interest in Science, Inflexibility, Political Concern, and Community Involvement.
The factors that were mapped on one end of the trait continuum described by Cattell have been described as follows (Cattell et al., 1970):
Affectothymia—Outgoing, warmhearted, easygoing, participating tendencies
Superego Strength—Conscientious, persistent, moralistic, staid
Threctia—Shy, timid, restrained, threat sensitive
Premsia—Tender-minded, sensitive, clinging, overprotected
Untroubled Adequacy—Self-assured, placid, secure, complacent, serene
Conservatism of Temperament—Respecting traditional ideas, tolerant of traditional difficulties
Group Dependency—A “joiner” and sound follower, group adherence
Low Self-Sentiment—Uncontrolled, lax, follows own urges, careless of social rules
The additional five attitudinal traits may be described as follows:
Honesty—Endorsement of items that reflect personal beliefs of honesty
Interest in Science—Endorsement of an item couplet that reflects interest in science
Inflexibility—Endorsement of items that reflect lack of tolerance for disruption of routines
Political Concern—Reflects attitudes toward other countries
Community Involvement—Endorsement of positive attitudes about citizenship and civic responsibilities
Intercorrelations among the 13 personality factors are reported for the total sample and by age group in the appendix (see table A-13.1).
Cross-sectional data were available across the age range from mean age 25 to mean age 81 years from 4,200 participants at first test in Study Cycles 1 through 7. The overall multivariate analysis of variance yielded overall gender [Rao’s R(13, 4170) = 62.19, p < .001] and age [Rao’s R(104, 28,726) = 10.14, p < .001] effects. The interaction between age and gender was not significant. Overall means by age group are given in table 13.6.
Univariate follow-up tests found gender differences significant at or beyond the .01 level of confidence, with higher overall scores for women on Group Dependency, Interest in Science, Inflexibility, and Political Concern. Overall means for men were higher on Interest in Science, Premsia, and Superego Strength.
All univariate follow-up tests found significant age differences at or beyond the .001 level of confidence. The cross-sectional age differences are shown in figure 13.3. Because of the absence of an overall Age × Gender interaction, they are shown only for the total group without regard to gender. Seven of the factors show increases with age, which are most pronounced for Inflexibility and Untroubled Adequacy and smallest for group Superego Strength and Interest in Science. Six factors show decreases with age differences, most pronounced for Group Dependency and Honesty and smallest for Premsia (tender-mindedness).
When we aggregate within-participant age changes over each 7-year period in our study, we can obtain direct estimates of average age changes. For the personality data, we were able to base our estimates on all participants entering the study in 1963, 1970, 1977, 1984, 1991, and 1998 who were followed up at least once. This resulted in 4,193 observations covering the age range from 25 to 88 years. Given the large number of observations, we did obtain overall within-participant change over 7 years on all variables except for Low Self-Esteem and Interest in Science. T-score means for the 13 personality factors are reported in table 13.7.
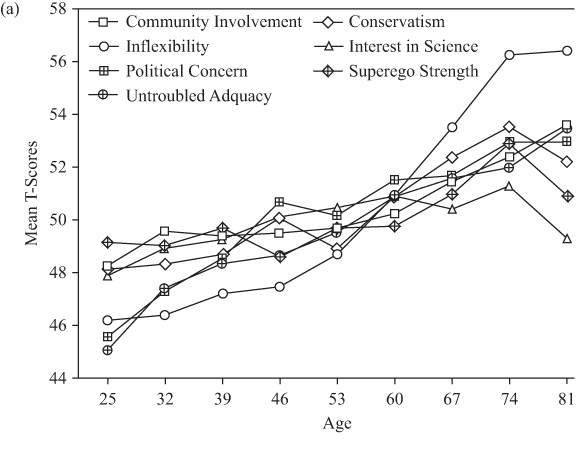
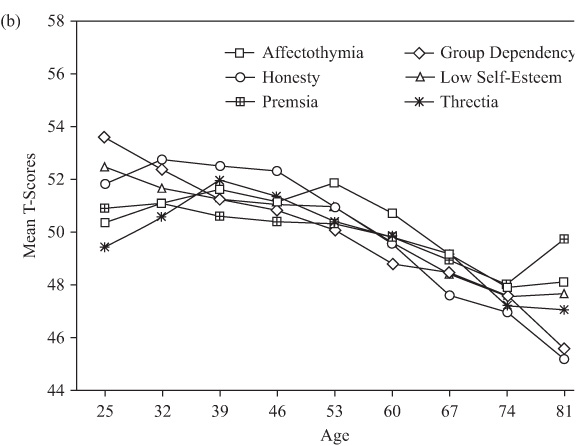
FIGURE 13.3. Age difference patterns on the 13 personality factor scores.
Longitudinal age patterns on the personality variables are, of course, generally quite stable. However, there were significant occasion effects for four of the personality traits and two of the attitudinal measures. In addition, there were significant Occasion × Age group interactions for four of the personality traits and for three of the attitudinal measures. Figure 13.4 charts the estimates of longitudinal changes in personality traits obtained from these data, anchoring all age gradients on the observed values at age 53. For ease of inspection, I have grouped separately the traits that show increment over age and time in the top part of the figure and those that show a decremental trend in the bottom part.
TABLE 13.6. Means and Standard Deviations for the 13 Personality Factors by Age, Averaged Across All Measurement Occasions
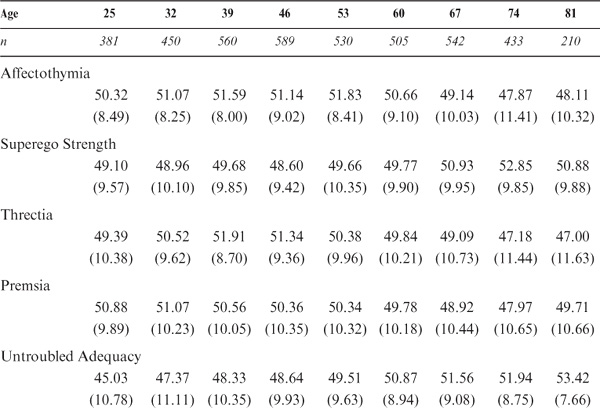
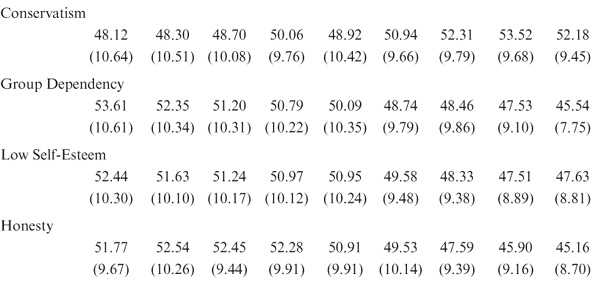
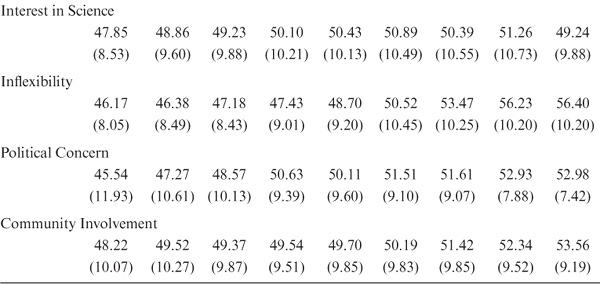
TABLE 13.7. Longitudinal Estimates of T-Score Means for the 13 Personality Factorsa
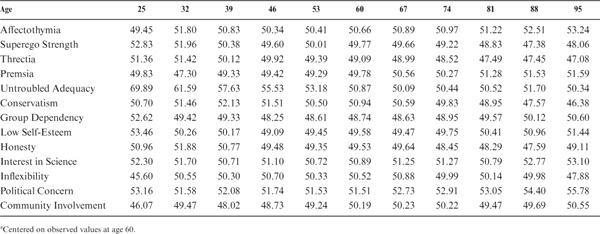
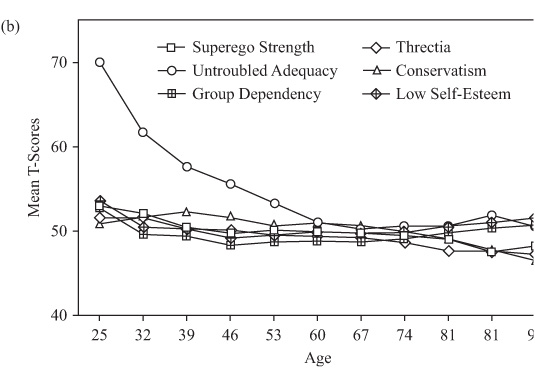
FIGURE 13.4. Estimated age changes from 7-year data for the 13 personality factor scores.
Most noteworthy are modest within-participant increases with age in Superego Strength, Untroubled Adequacy, and Honesty. Smaller increases with age were also noted for Threctia and Conservatism. Equally interesting is the decline in Affectothymia in advanced old age. Premsia and Group Dependency show small systematic declines across the entire adult age range; Political Concern begins to show systematic decline from midlife on. Age trends for Low Self-Sentiment, Interest in Science, Inflexibility, and Community Involvement were not statistically significant.
As for our ability measures, these age differences confound cohort and maturational changes. We therefore computed cohort differences in the manner described in chapter 6 (see table 13.8), and charted the resulting cohort gradients in figure 13.5. Figure 13.5a shows the six traits characterized by positive cohort differences or by convex patterns that remain negative until the turn of the century, followed by a positive trend. Group Dependency reaches a peak for the 1938 cohort and declines somewhat thereafter. Low Self-Sentiment is highest in the 1952 cohort. Honesty declines until the 1910 cohort and then rises linearly. Premsia increases to an asymptote for the 1952 cohort, with slight decline thereafter. Affectothymia reaches an asymptote for the 1938 cohort, with some decline thereafter. Threctia remains virtually flat.
TABLE 13.8. Cohort Differences for the 13 Personality Factors in T-Score Points
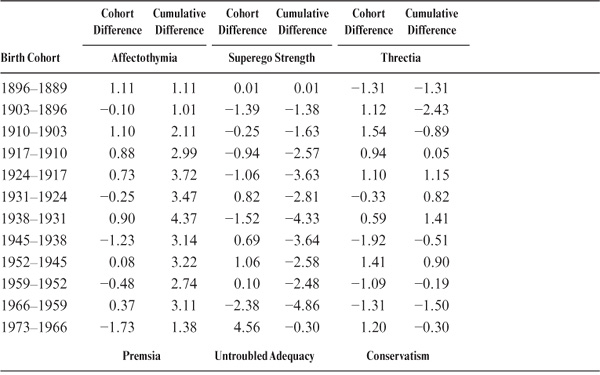
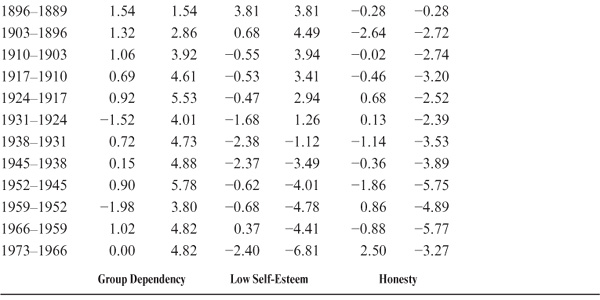
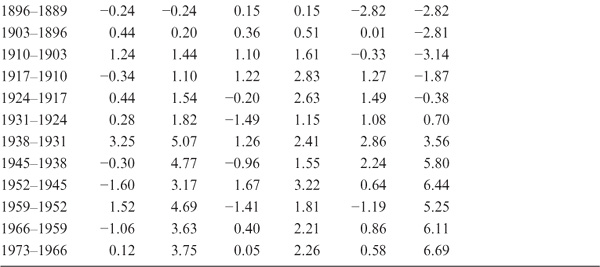
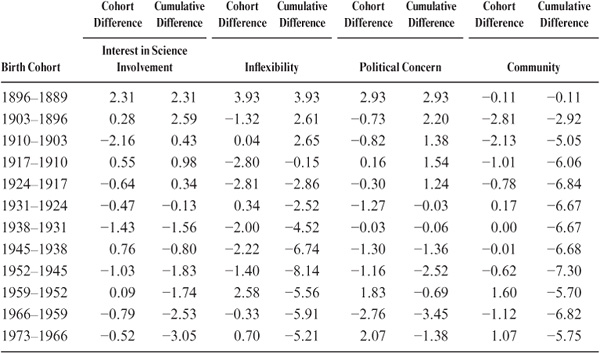
Figure 13.5b shows the seven traits that show systematic decreases or show concave patterns with increments for the early cohorts, followed by substantial decline. These include Superego Strength and Conservatism, with the lowest point reached by the 1966 cohort. Untroubled Adequacy reaches its highest level for the 1903 cohort, with linear decline thereafter. Community Involvement shows steady decline, with a low point for the 1952 cohort, with some decline thereafter. Political Concern and Interest in Science reached a peak before the turn of the century, with decline peaking for the 1966 cohort. Finally, Inflexibility after an early peak also declined steadily with the low point for the 1952 cohort.
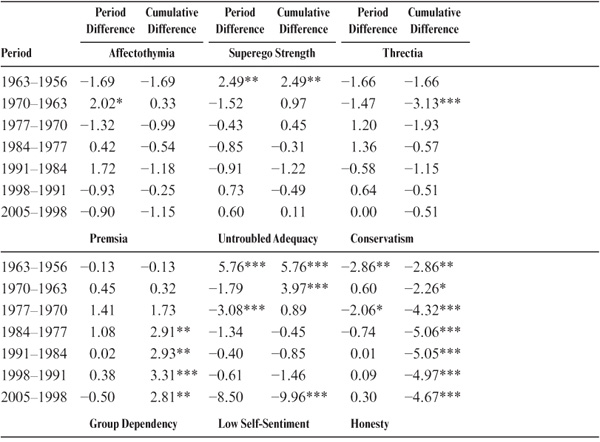
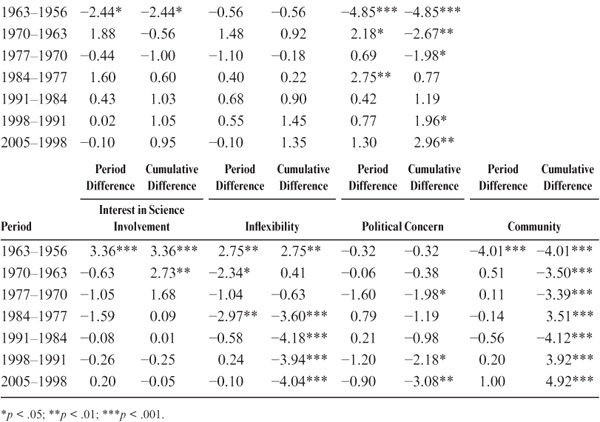
We next examine whether the 13 personality factors are affected by secular trends (period effects). Cumulative period effects were computed using the same approached illustrated for the cognitive variables in chapter 6. These period effects are listed in table 13.9. Positive period effects were found for Premsia, Untroubled Adequacy, Superego Strength, and Interest in Science (the last three only from 1956 to 1963). Inflexibility increased from 1956 to 1963 but then decreased with a low point in 1991. Negative period effects occurred for Threctia (from 1956 to 1970), Conservatism (1956 to 1984), Community Involvement and Group Dependency (from 1956 to 1963), Political Concern (from 1970 to 1977, and from 1991 to 1998). No significant period effects were found for Affectothymia and Low Self-Sentiment.
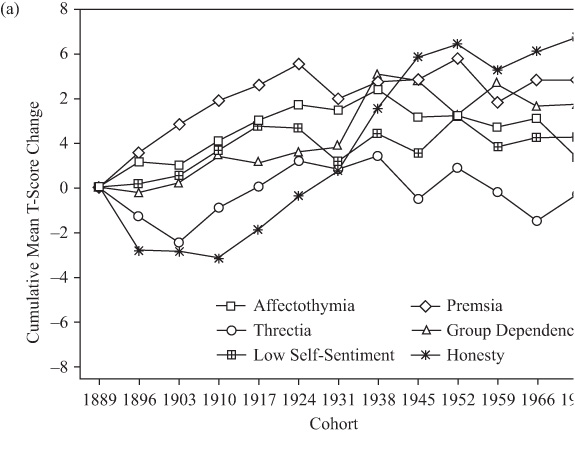
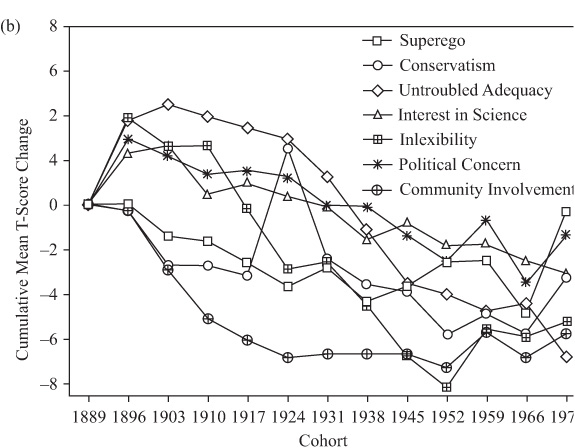
FIGURE 13.5. Cohort gradients for the 13 personality factor scores.
To extend the range of personality data in the SLS and to have a direct measure of the Big Five personality traits, a mail administration of the NEO-PI-R (Costa & McCrae, 1992) was conducted in 2001. The questionnaire was sent to the 1,796 participants of the 1998 SLS wave for whom current addresses were available. Completed questionnaires were returned by 1,501 participants (83.6% return rate).
TABLE 13.9. Period Differences for the 13 Personality Factors in T-Score Points
The scales in this inventory (Costa & McCrae, 1992) are described as follows:
Neuroticism (N). This scale contrasts adjustment or emotional stability with maladjustment or neuroticism
Extraversion (E). Extraverts are not only sociable, but also assertive, active, and talkative. Introverts are reserved and independent, and they prefer to be alone.
Openness (O). Open individuals are curious and willing to entertain novel ideas and unconventional values. They experience positive and negative emotions more intensely than do closed individuals.
Agreeableness (A). Agreeable persons are altruistic, sympathetic to others, and eager to help, expecting others to be equally helpful in return. Disagreeable persons are egocentric, skeptical of others’ intentions, and competitive rather than cooperative.
Conscientiousness (C). High scorers are scrupulous, punctual, and reliable. Low scorers do not necessarily lack moral principles but are less exacting in applying them, more hedonistic, and more lackadaisical in working toward their goals.
Significant age differences were found for all five factors (p < .01), and there were significant gender differences (p < .001) for all factors except Conscientiousness. Women scored higher than men on all four factors. Neuroticism declines to age 60 and then remains level. Extraversion shows an early peak at age 32 years and then declines steadily. Openness declines linearly from 39 years of age. Agreeableness increases linearly with age; Conscientiousness increases slightly to age 60 years and then declines moderately. Means and standard deviations for the five NEO factors (standardized to a mean of 50 and SD of 10) are reported in table 13.10 and graphed in figure 13.6. Intercorrelations among the five NEO scales for the total sample and by age group are reported in the appendix (see table A-13.2).
TABLE 13.10. Means and Standard Deviations for the NEO Personality Questionnaire, by Age and Gender, Administered in 2001
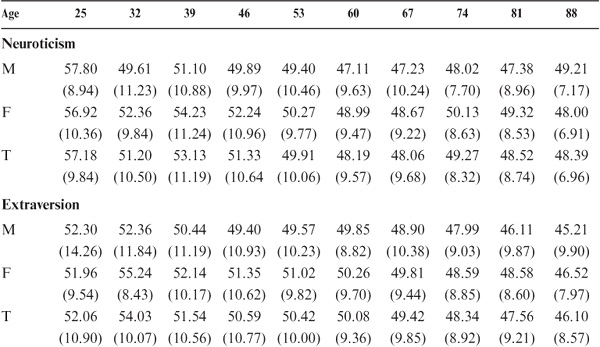
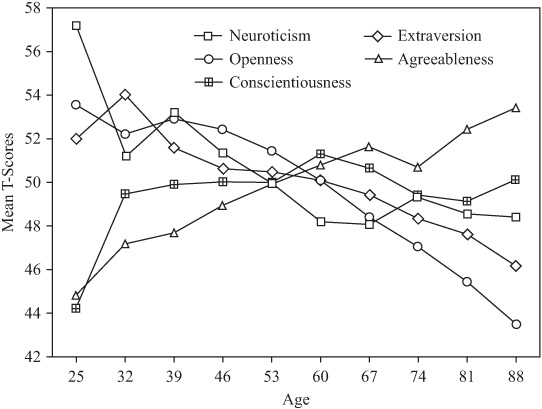
FIGURE 13.6. Age difference patterns for the NEO scales.
Although observed longitudinal findings are not yet available, we were able to employ extension analysis (described in chapter 2) to postdict scores on the NEO for 1991 by projecting the observed NEO into the 13-factor personality space for 1998 (also see Schaie, Willis, & Caskie, 2004). This analysis was based on the 1,171 participants who had data on the NEO and the 1998 personality factor scores. Factor loadings of the NEO scales on the 13 personality factors are reported in table 13.11.
Estimation procedures involved computing NEO scores by multiplying the 13 factor scores by weights obtained from the orthonormalized factor loadings in table 13.11 and restandardizing resulting scores to a mean of 50 and standard deviation of 10. Within-participant changes over 7 years were then computed and aggregated across successive 7-year age cohorts. The resulting longitudinal age gradients were then centered on average scores at age 53 years and are depicted in figure 13.7. Considerable caution is in order in interpreting the findings using these NEO proxy estimates. However, they do represent within-participant change data across much of the adult life span.
Although cross-sectional data usually depict few personality differences across adulthood, these data suggest much more dramatic developmental trends. For neuroticism, we see a sharp increase until midlife, with virtual stability thereafter. Openness shows a modest increase until age 46 years, a plateau until the late 60s, and a decline thereafter. Extraversion shows a steady decline from the 40s. Agreeableness shows a steep increment with age. Finally, Conscientiousness declines until the 50s, followed by a virtual plateau.
TABLE 13.11. Standardized Factor Loadings for the NEO on the 13 Personality Factors
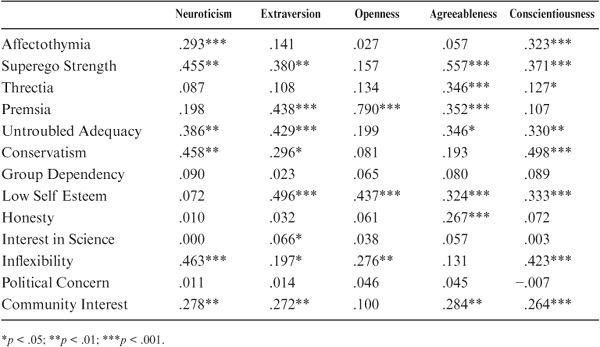
FIGURE 13.7. Estimated longitudinal changes for the NEO scales.
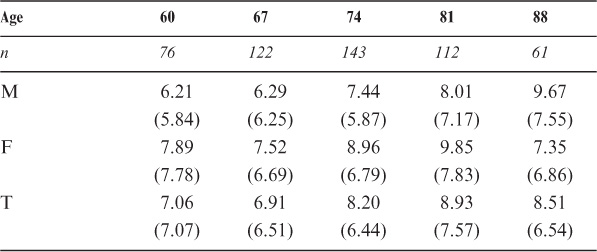
As part of our neuropsychology studies of our older participants, we have collected data on the CES-D (Radloff, 1977; Radloff & Teri, 1986). The scale was developed as a short inventory for measuring depressive symptoms in the general population, although most clinicians would argue that it measures psychological distress rather than clinical depression. We report here cross-sectional data on a set of 494 study participants who ranged in age from 57 to 95 years. For comparison with our other data, this sample was divided into five age groups with mean ages of 60, 67, 74, 81, and 88 years. Table 13.12 provides means and standard deviations by age and gender. Although we did not find any significant gender differences or Age × Gender interaction, there were significant age differences (p < .05) suggesting higher depression scores with advancing age.
A 3-year follow-up study of 286 participants of the neuropsychology study yielded a stability coefficient of .582 for the depression scale. However, change in level of the depression score over the 3-year interval was not statistically significant.
Although the primary objectives of the SLS did not originally address the study of personality per se, we have collected a substantial corpus of data on the adult development of personality and attitudinal traits. We have explicitly studied the attitudinal trait of Social Responsibility, have derived other personality traits and attitudes from the TBR questionnaire, and have recently added the NEO as a measure of the Big Five personality factors and the CES-D as a measure of depression.
Cross-sectional data on the measure of Social Responsibility suggested the presence of an Age × Cohort interaction, with lower Social Responsibility in old age in the earlier cohorts, but a reversal in the more recent cohorts. When aggregate longitudinal data are examined, however, we conclude that there is modest gain in Social Responsibility until age 74 years. Women show greater Social Responsibility than men until age 46 years, but the age gradients for both genders coincide thereafter. Only modest cohort differences were found, with the lowest Social Responsibility level shown by the 1952 cohort. However, there were significant secular trends displaying an overall decline in Social Responsibility from 1956 to 1977 and a significant rise thereafter.
TABLE 13.12. Means and Standard Deviations for the CES-D Depression Questionnaire, by Age and Gender (in Raw Scores)
Item factor analyses of the 75-item TBR questionnaire originally resulted in the identification of 19 personality factors (based on data from the first three cycles) that were assigned to a personality trait taxonomy of biostable, biocultural, and acculturated traits. A more recent confirmatory factor analysis of our entire data set found that a 13-factor solution was more parsimonious. The factors identified were Affectothymia, Superego Strength, Threctia, Premsia, Untroubled Adequacy, Conservatism of Temperament, Group Dependency, Low Self-Sentiment, Honesty, Interest in Science, Inflexibility, Political Concern, and Community Involvement.
Significant cross-sectional age differences were found for all 13 personality factors. However, these differences can largely be explained by a pattern of positive and negative cohort differences. Far fewer significant within-participant age changes were found. Most noteworthy were modest within-participant increases with age in Superego Strength, Untroubled Adequacy, Honesty, Threctia, and Conservatism. Age-related declines were found for Affectothymia, Premsia, and Political Concern. No age trends were found for Low Self-Sentiment, Interest in Science, Inflexibility, and Community Involvement.
On the NEO, negative age differences are found for Neuroticism, Extraversion, and Openness, and positive age differences for Agreeableness and Conscientiousness did not differ significantly by age group. Estimated longitudinal age changes suggest rather different life course patterns. Here, Neuroticism and Openness show increases until midlife, with stability thereafter; Extraversion has a concave pattern of increment until midlife, with a decrease in old age; Agreeableness shows steep age-related increments; and Conscientiousness declines until midlife, with stability thereafter.
Finally, the CES-D data for our older participants showed a trend toward modest increase in psychological distress with increasing age.