Here we give an overview of the main types of operations that a debugger offers.
You saw earlier that to run a program in GDB, you use the run command, and that in DDD you click Run. In details to be presented later, you will see that Eclipse handles things similarly.
You can also arrange for execution of the program to pause at certain points, so that you can inspect the values of variables in order to get clues about where your bug is. Here are some of the methods you can use to do this:
- Breakpoints
As mentioned earlier, a debugging tool will pause execution of your program at specified breakpoints. This is done in GDB via the
breakcommand, together with the line number; in DDD you right-click anywhere in white space in the relevant line and choose Set Breakpoint; in Eclipse you double-click in the margin to the left of the line.- Single-stepping
GDB's
nextcommand, which was also mentioned earlier, tells GDB to execute the next line and then pause. Thestepcommand is similar, except that at function calls it will enter the function, whereasnextwill result in the next pause in execution occurring at the line following the function call. DDD has corresponding Next and Step menu choices, while Eclipse has Step Over and Step Into icons to do the same thing.- Resume operation
In GDB, the
continuecommand tells the debugger to resume execution and continue until a breakpoint is hit. There is a corresponding menu item in DDD, and Eclipse has a Resume icon for it.- Temporary breakpoints
In GDB the
tbreakcommand is similar tobreak, but it sets a breakpoint that only stays in effect until the first time the specified line is reached. In DDD this is accomplished by right-clicking anywhere in the white space in the desired line in the Source Text window, and then selecting Set Temporary Breakpoint. In Eclipse, highlight the desired line in the source window, then right-click and select Run to Line.GDB also has
untilandfinishcommands, which create special kinds of one-time breakpoints. DDD has corresponding Until and Finish menu items in its Command window, and Eclipse has Step Return. These are discussed in Chapter 2.
A typical debugging pattern for program execution is as follows (using GDB as an example): After you hit a breakpoint, you move through the code one line at a time or single-step for a while, via GDB's next and step commands. This allows you to carefully examine the program's state and behavior near the breakpoint. When you are done with this, you can tell the debugger to continue to execute the program without pausing until the next breakpoint is reached, by using the continue command.
After the debugger pauses execution of our program, you can issue commands to display the values of program variables. These could be local variables, globals, elements of arrays and C structs, member variables in C++ classes, and so on. If a variable is found to have an unexpected value, that typically is a big clue to the location and nature of a bug. DDD can even graph arrays, which may reveal, at a glance, suspicious values or trends occurring within an array.
The most basic type of variable display is simply printing the current value. For example, suppose you have set a breakpoint at line 37 of the function insert() in ins.c. (Again, the full source code is given in Introductory Debugging Session, but the details needn't concern you for now.) When you reach that line, you can check the value of the local variable j in that function. In GDB you would use the print command:
(gdb) print j
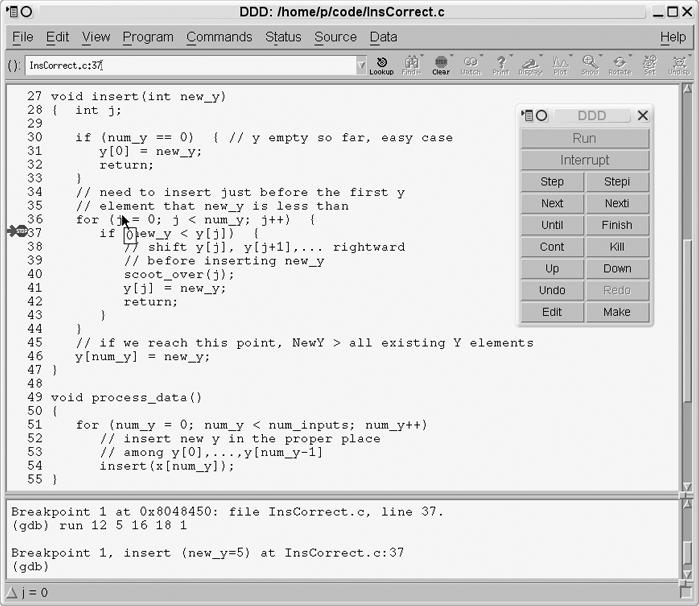
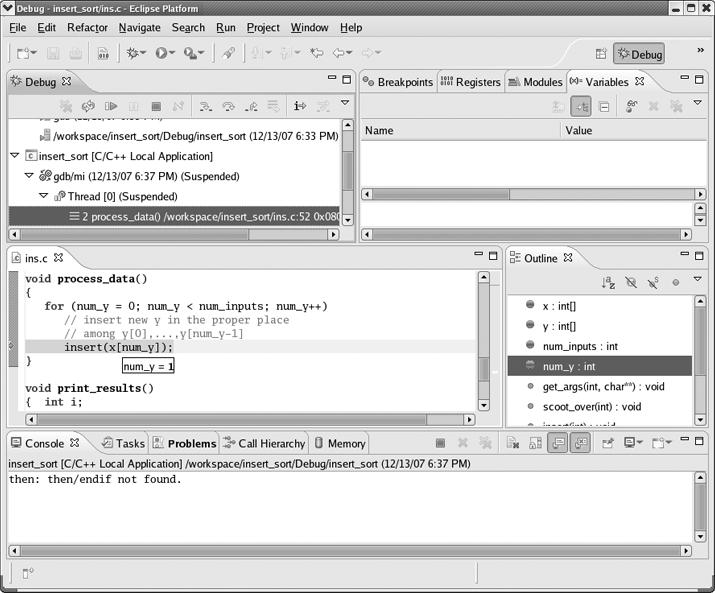
In DDD it is even easier: You simply move the mouse pointer over any instance of j in the Source Text window, and then the value of j will be displayed, for a second or two, in a little yellow box—called a value tip—near the mouse pointer. See Figure 1-5, where the value of the variable new_y is being examined. Things work the same way with Eclipse, as seen in Figure 1-6, where we are querying the value of num_y.
As you will see in Chapter 2, in GDB or DDD you can also arrange to continuously display a variable so that you don't have to repeatedly ask to see the value. DDD has an especially nice feature for displaying linked lists, trees, and other data structures containing pointers: You can click an outgoing link of any node in such a structure to find the next node.
A watchpoint combines the notions of breakpoint and variable inspection. The most basic form instructs the debugger to pause execution of the program whenever the value of a specified variable changes.
For example, suppose that you wish to examine a program's state during the points in the course of its execution at which the variable z changes value. In GDB, you can issue the command
(gdb) watch z
When you run the program, GDB will pause execution whenever the value of z changes. In DDD, you would set the watchpoint by clicking any instance of z in the Source Text window and then clicking the Watch icon at the top of the DDD window.
Even better, you can set watchpoints based on conditional expressions. Say, for example, that you wish to find the first point in the execution of the program at which the value of z exceeds 28. You can accomplish this by setting a watchpoint based on the expression (z > 28). In GDB, you would type
(gdb) watch (z > 28)
In DDD, you would issue this command in DDD's Console. Recall that in C the expression (z > 28) is of Boolean type and evaluates to either true or false, where false is represented by 0 and true is represented by any nonzero integer, usually 1. When z first takes on a value larger than 28, the value of the expression (z > 28) will change from 0 to 1, and GDB will pause execution of the program.
You can set a watchpoint in Eclipse by right-clicking in the source window, selecting Add a Watch Expression, and then filling in the desired expression in the dialog.
Watchpoints are usually not as useful for local variables as they are for variables with wider scope, because a watchpoint set on a local variable is canceled as soon as the variable goes out of scope, that is, when the function in which the variable is defined terminates. However, local variables in main() are an obvious exception, as such variables are not deallocated until the program finishes execution.
During a function call, runtime information associated with the call is stored in a region of memory known as a stack frame. The frame contains the values of the function's local variables and its parameters and a record of the location from which the function was called. Each time a function call occurs, a new frame is created and pushed onto a stack maintained by the system; the frame at the top of the stack represents the currently executing function, and it is popped off the stack and deallocated when the function exits.
For example, suppose that you pause execution of your sample program, insert_sort, while in the insert() function. The data in the current stack frame will state that you got there via a function call at a specific location that turns out to be within the process_data() function (which invokes insert()). The frame will also store the current value of insert()'s only local variable, which you will see later is j.
The stack frames for the other active function invocations will contain similar information, and you can also examine these if you wish. For instance, even though execution currently resides in insert(), you may wish to take a look at the previous frame in the call stack, that is, at process_data()'s frame. You can do so in GDB with the command
(gdb) frame 1
When issuing GDB's frame command, the frame of the currently executing function is numbered 0, its parent frame (that is, the stack frame of the function's caller) is numbered 1, the parent's parent is numbered 2, and so on. GDB's up command takes you to the next parent in the call stack (for example, to frame 1 from frame 0), and down takes you in the other direction. Such operations are very useful, because the values of the local variables in some of the earlier stack frames may give you a clue as to what caused a bug.
Traversing the call stack does not change the execution path—in this example, the next line of insert_sort to be executed will still be the current one in insert()—but it does allow you to take a look at the ancestor frames and so examine the values of the local variables for the function invocations leading up to the current one. Again, this may give you hints about where to find a bug.
GDB's backtrace command will show you the entire stack, that is, the entire collection of frames currently in existence.
The analogous operation in DDD is invoked by clicking Status | Backtrace; a window will pop up showing all the frames, and you can then click whichever one you wish to inspect. The DDD interface also has Up and Down buttons that can be clicked to invoke GDB's up and down commands.
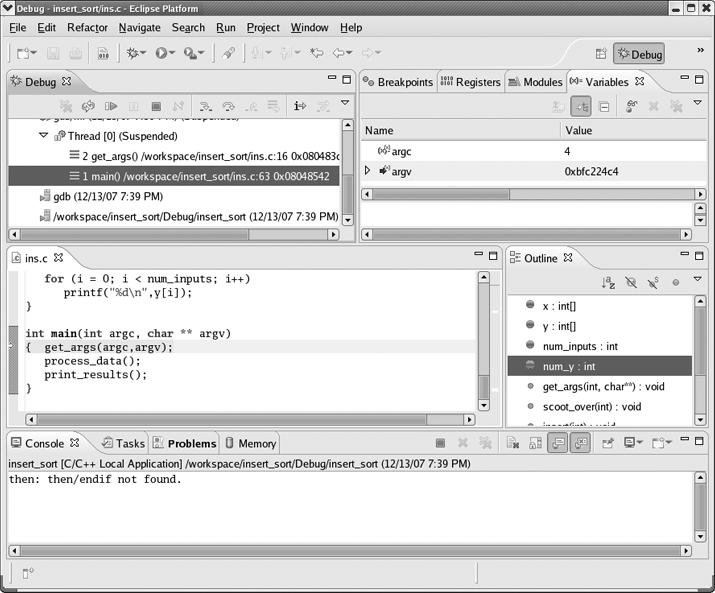
In Eclipse, the stack is continuously visible in the Debug perspective itself. In Figure 1-7, look at the Debug tab in the upper-left corner. You'll see that we are currently in frame 2, in the function get_args(), which we called from frame 1 in main(). Whichever frame is highlighted is the one displayed in the source window, so you can display any frame by clicking it in the call stack.


