Now we will present a complete debugging session. As mentioned, the sample program is in the source file ins.c and does an insertion sort. This is not an efficient sorting method, of course, but the simplicity of the code makes it good for illustrating the debugging operations. Here is the code:
//
// insertion sort, several errors
//
// usage:  insert_sort num1 num2 num3 ..., where the numi are the numbers to
// be sorted

int x[10],  // input array
    y[10],  // workspace array
    num_inputs,  // length of input array
    num_y = 0;  // current number of elements in y

void get_args(int ac, char **av)
{  int i;

   num_inputs = ac - 1;
   for (i = 0; i < num_inputs; i++)
      x[i] = atoi(av[i+1]);
}

void scoot_over(int jj)
{  int k;

   for (k = num_y-1; k > jj; k++)
      y[k] = y[k-1];
}

void insert(int new_y)
{  int j;

   if (num_y = 0)  { // y empty so far, easy case
      y[0] = new_y;
      return;
   }
   // need to insert just before the first y
   // element that new_y is less than
   for (j = 0; j < num_y; j++)  {
      if (new_y < y[j])  {
         // shift y[j], y[j+1],... rightward
         // before inserting new_y
         scoot_over(j);
         y[j] = new_y;
         return;
      }
   }
}

void process_data()
{
   for (num_y = 0; num_y < num_inputs; num_y++)
      // insert new y in the proper place
      // among y[0],...,y[num_y-1]
      insert(x[num_y]);
}

void print_results()
{  int i;

   for (i = 0; i < num_inputs; i++)
      printf("%d\n",y[i]);
}

int main(int argc, char ** argv)
{  get_args(argc,argv);
   process_data();
   print_results();
}
Below is a pseudocode description of the program. The function calls are indicated by call statements, and the pseudocode for each function is shown indented under the calls:
call main():
   set y array to empty
   call get_args():
      get num_inputs numbers x[i] from command line
   call process_data():
      for i = 1 to num_inputs
         call insert(x[i]):
            new_y = x[i]
            find first y[j] for which new_y < y[j]
            call scoot_over(j):
               shift y[j], y[j+1], ... to right,
                  to make room for new_y
         set y[j] = new_y
Let's compile and run the code:
$ gcc -g -Wall -o insert_sort ins.c
Important: You can use the -g option to GCC to tell the compiler tosave the symbol table—that is, the list of memory addresses corresponding to your program's variables and lines of code—within the generated executable file, which here is insert_sort. This is an absolutely essential step that allows you to refer to the variable names and line numbers in the source code during a debugging session. Without this step (and something similar would have to be done if you were to use a compiler other than GCC), you could not ask the debugger to "stop at line 30" or "print the value of x," for example.
Now let's run the program. Following the Start Small Principle from Other Debugging Principles, first try sorting a list of just two numbers:
$ insert_sort 12 5
(execution halted by user hitting ctrl-C)
The program did not terminate or print any output. It apparently went into an infinite loop, and we had to kill it by hitting CTRL-C. There is no doubt about it: Something is wrong.
In the following sections, we will first present a debugging session for this buggy program using GDB, and then discuss how the same operations are done using DDD and Eclipse.
To track down the first bug, execute the program in GDB and let it run for a while before suspending it with CTRL-C. Then see where you are. In this manner, you can determine the location of the infinite loop.
First, start the GDB debugger on insert_sort:
$ gdb insert_sort -tui
Your screen will now look like this:
    63      {  get_args(argc,argv);
    64         process_data();
    65         print_results();
    66      }
    67
    68
    69
 File: ins.c    Procedure: ??    Line: ??      pc: ??
--------------------------------------------------------------------------
(gdb)
The top subwindow displays part of your source code, and in the bottom subwindow you see the GDB prompt, ready for your commands. There is also a GDB welcome message, which we have omitted for the sake of brevity.
If you do not request TUI mode when invoking GDB, you would receive only the welcome message and the GDB prompt, without the upper subwindow for your program's source code. You could then enter TUI mode using the GDB command CTRL-X-A. This command toggles you in and out of TUI mode and is useful if you wish, for example, to temporarily leave TUI mode so that you can read GDB's online help more conveniently, or so that you can see more of your GDB command history together on one screen.
Now run the program from within GDB by issuing the run command together with your program's command-line arguments, and then hit CTRL-C to suspend it. The screen now looks like this:
    46
    47 void process_data()
    48 {
    49 for (num_y = 0; num_y < num_inputs; num_y++)
    50 // insert new y in the proper place
    51 // among y[0],...,y[num_y-1]
 >  52 insert(x[num_y]);
    53 }
    54
    55 void print_results()
    56 {  int i;
    57
    58 for (i = 0; i < num_inputs; i++)
    59 printf("%d\n",y[i]);
    60 } .
 File: ins.c    Procedure: process_data  Line: 52 pc: 0x8048483
--------------------------------------------------------------------------
(gdb) run 12 5
Starting program: /debug/insert_sort 12 5

Program received signal SIGINT, Interrupt.
0x08048483 in process_data () at ins.c:52
(gdb)
This tells you that when you stopped the program, insert_sort was in the function process_data() and line 52 in the source file ins.c was about to be executed.
We hit CTRL-C at a random time and stopped at a random place in the code. Sometimes it's good to suspend and restart aprogram that has stopped responding two or three times by issuing continue between CTRL-Cs, in order to see where you stopeach time.
Now, line 52 is part of the loop that begins on line 49. Is this loop the infinite one? The loop doesn't look like it should run indefinitely, but the Principle of Confirmation says you should verify this, not just assume it. If the loop is not terminating because somehow you haven't set the upper bound for the variable num_y correctly, then after the program has run for a while the value of num_y will be huge. Is it? (Again, it looks like it shouldn't be, but you need to confirm that.) Let's check what the current value of num_y is by asking GDB to print it out.
(gdb) print num_y
$1 = 1
The output of this query to GDB shows that the value of num_y is 1. The $1 label means that this is the first value you've asked GDB to print out. (The values designated by $1, $2, $3, and so on are collectively called the value history of the debugging session. They can be very useful, as you will see in later chapters.) So we seem to be on only the second iteration of the loop on line 49. If this loop were the infinite one, it would be way past its second iteration by now.
So let's take a closer look at what occurs when num_y is 1. Tell GDB to stop in insert() during the second iteration of the loop on line 49 so that you can take a look around and try to find out what's going wrong at that place and time in the program:
(gdb) break 30
Breakpoint 1 at 0x80483fc: file ins.c, line 30.
(gdb) condition 1 num_y==1
The first command places a breakpoint at line 30, that is, at the beginning of insert(). Alternatively, you could have specified this breakpoint via the command break insert, meaning to break at the first line of insert() (which here is line 30). This latter form has an advantage: If you modify the program code so that the function insert() no longer begins at line 30 of ins.c, your breakpoint would remain valid if specified using the function name, but not if specified using the line number.
Ordinarily a break command makes execution pause every time the program hits the specified line. However, the second command here, condition 1 num_y==1, makes that breakpoint conditional : GDB will pause execution of the program at breakpoint 1 only when the condition num_y==1 holds.
Note that unlike the break command, which accepts line numbers (or function names), condition accepts a breakpoint number. You can always use the command info break to look up the number of the desired breakpoint. (That command gives you other useful information too, such as the number of times each breakpoint has been hit so far.)
We could have combined the break and condition commands into a single step by using break if as follows:
(gdb) break 30 if num_y==1
Then run the program again, using the run command. You do not have to restate the command-line arguments if you just wish to reuse the old ones. This is the case here, and so you can simply type run. Since the program is already running, GDB asks us if you wish to restart from the beginning, and you answer "yes."
The screen will now look like this:
    24            y[k] = y[k-1];
    25      }
    26
    27      void insert(int new_y)
    28      {  int j;
    29
 *> 30         if (num_y = 0)  { // y empty so far, easy case
    31            y[0] = new_y;
    32            return;
    33         }
    34         // need to insert just before the first y
    35         // element that new_y is less than
    36         for (j = 0; j < num_y; j++)  {
    37            if (new_y < y[j])  {
    38               // shift y[j], y[j+1],... rightward
 File: ins.c    Procedure: insert    Line: 30      pc: 0x80483fc
--------------------------------------------------------------------------
(gdb) condition 1 num_y==1
(gdb) run
The program being debugged has been started already.
Start it from the beginning? (y or n)
Starting program: /debug/insert_sort 12 5

Breakpoint 1, insert (new_y=5) at ins.c:30
(gdb)
We apply the Principle of Confirmation again: Since num_y is 1, line 31 should be skipped over and execution should go to line 36. But we need to confirm this, so we issue the next command to go on to the next line:
    24            y[k] = y[k-1];
    25      }
    26
    27      void insert(int new_y)
    28      {  int j;
    29
 *  30         if (num_y = 0)  { // y empty so far, easy case
    31            y[0] = new_y;
    32            return;
    33         }
    34         // need to insert just before the first y
    35         // element that new_y is less than
  > 36         for (j = 0; j < num_y; j++)  {
    37            if (new_y < y[j])  {
    38               // shift y[j], y[j+1],... rightward
 File: ins.c    Procedure: insert    Line: 36      pc: 0x8048406
--------------------------------------------------------------------------
(gdb) run
The program being debugged has been started already.
Start it from the beginning? (y or n)
Starting program: /debug/insert_sort 12 5

Breakpoint 1, insert (new_y=5) at ins.c:30
(gdb) next
(gdb)
The arrow in the upper subwindow is now at line 36, so our expectation is confirmed; we did indeed skip line 31. Now let's continue to single-step through the program, confirming assumptions about the code along the way. You are now at the beginning of a loop, so issue the next command again a few times and see how the loop progresses, line by line:
    39               // before inserting new_y
    40               scoot_over(j);
    41               y[j] = new_y;
    42               return;
    43            }
    44         }
  > 45      }
    46
    47      void process_data()
    48      {
    49         for (num_y = 0; num_y < num_inputs; num_y++)
    50            // insert new y in the proper place
    51            // among y[0],...,y[num_y-1]
    52            insert(x[num_y]);
    53      }
 File: ins.c    Procedure: insert    Line: 45      pc: 0x804844d
--------------------------------------------------------------------------
The program being debugged has been started already.
Start it from the beginning? (y or n)
Starting program: /debug/insert_sort 12 5

Breakpoint 1, insert (new_y=5) at ins.c:30
(gdb) next
(gdb) next
(gdb)
Look at where the arrow is now in the upper subwindow—we went directly from line 37 to line 45! This is quite a surprise. We did not execute even one iteration of the loop. Remember, though, that surprises are good, because they give you clues as to where bugs are.
The only way that the loop at line 36 could have executed no iterations at all is if the condition j < num_y in line 36 did not hold even when j was 0. Yet you know that num_y is 1, because you are in this function now after having imposed the condition num_y==1 on the breakpoint. Or at least you think you know this. Again, you haven't confirmed it. Check this now:
(gdb) print num_y
$2 = 0
Sure enough, the condition num_y==1 did hold when you enteredinsert(), but apparently num_y has changed since then. Somehow num_y became 0 after you entered this function. But how?
As mentioned earlier, the Principle of Confirmation doesn't tell youwhat the bug is, but it does give us clues to where the bug likely resides. In this case, you have now discovered that the location is somewhere between lines 30 and 36. And you can narrow down that range further, because you saw that lines 31 through 33 were skipped, and lines 34 through 35 are comments. In other words, the mysterious change of value in num_y occurred either at line 30 or at line 36.
After taking a short break—often the best debugging strategy!—wesuddenly realize that the fault is a classic error, often made by beginning (and, embarrassingly, by experienced) C programmers: In line 30 we used = instead of ==, turning a test for equality into an assignment.
Do you see how the infinite loop thus arises? The error on line 30 sets up a perpetual seesaw situation, in which the num_y++ portion of line 49 repeatedly increments num_y from 0 to 1, while the error in line 30 repeatedly sets that variable's value back to 0.
So we fix that humiliating bug (which ones aren't humiliating?), recompile, and try running the program again:
$ insert_sort 12 5
5
0
We don't have an infinite loop anymore, but we don't have the correct output either.
Recall from the pseudocode what your program is supposed to do here: Initially the array y is empty. The first iteration of the loop at line 49 is supposed to put the 12 into y[0]. Then in the second iteration, the 12 is supposed to be shifted by one array position, to make room for insertion of the 5. Instead, the 5 appears to have replaced the 12.
The trouble arises with the second number (5), so you should again focus on the second iteration. Because we wisely chose to stay in the GDB session, rather than exiting GDB after discovering and fixing the first bug, the breakpoint and its condition, which we set earlier, are still in effect now. Thus we simply run the program again, and stop when the program begins to process the second input:
    24            y[k] = y[k-1];
    25      }
    26
    27      void insert(int new_y)
    28      {  int j;
    29
 *> 30         if (num_y == 0)  { // y empty so far, easy case
    31            y[0] = new_y;
    32            return;
    33         }
    34         // need to insert just before the first y
    35         // element that new_y is less than
    36         for (j = 0; j < num_y; j++)  {
    37            if (new_y < y[j])  {
    38               // shift y[j], y[j+1],... rightward                  .
 File: ins.c    Procedure: insert    Line: 30      pc: 0x80483fc
--------------------------------------------------------------------------
The program being debugged has been started already.
Start it from the beginning? (y or n)

`/debug/insert_sort' has changed; re-reading symbols.
Starting program: /debug/insert_sort 12 5

Breakpoint 1, insert (new_y=5) at ins.c:30
(gdb)
Notice the line that announces
`/debug/insert_sort' has changed; re-reading symbols.
This shows that GDB saw that we recompiled the program and automatically reloaded the new binary and the new symbol table before running the program.
Again, the fact that we did not have to exit GDB before recompiling our program is a major convenience, for a few reasons. First, you do not need to restate your command-line arguments; you just type run to re-run the program. Second, GDB retains the breakpoint that you had set, so that you don't need to type it again. Here you only have one breakpoint, but typically you would have several, and then this becomes a real issue. These conveniences save you typing, and more importantly they relieve you of practical distractions and allow you to focus better on the actual debugging.
Likewise, you should not keep exiting and restarting your text editor during your debugging session, which would also be a distraction and a waste of time. Just keep your text editor open in one window and GDB (or DDD) in another, and use a third window for trying out your program.
Now let's try stepping through the code again. As before, the program should skip line 31, but hopefully this time it will reach line 37, as opposed to the situation earlier. Let's check this by issuing the next command twice:
    31            y[0] = new_y;
    32            return;
    33         }
    34         // need to insert just before the first y
    35         // element that new_y is less than
    36         for (j = 0; j < num_y; j++)  {
  > 37            if (new_y < y[j])  {
    38               // shift y[j], y[j+1],... rightward
    39               // before inserting new_y
    40               scoot_over(j);
    41               y[j] = new_y;
    42               return;
    43            }
    44         }
    45      }
 File: ins.c    Procedure: insert    Line: 37      pc: 0x8048423
--------------------------------------------------------------------------
`/debug/insert_sort' has changed; re-reading symbols.
Starting program: /debug/insert_sort 12 5

Breakpoint 1, insert (new_y=5) at ins.c:30
(gdb) next
(gdb) next
(gdb)
We have indeed reached line 37.
At this point, we believe the condition in the if in line 37 should hold, because new_y should be 5, and y[0] should be 12 from the first iteration. The GDB output confirms the former assumption. Let's check the latter:
(gdb) print y[0]
$3 = 12
Now that this assumption is also confirmed, issue the next command, which brings you to line 40. The function scoot_over() is supposed to shift the 12 to the next array position, to make room for the 5. You should check to see whether or not it does. Here you face an important choice. You could issue the next command again, which would cause GDB to stop at line 41; the function scoot_over() would be executed, but GDB would not stop within that function. However, if you were to issue the step command instead, GDB would stop at line 23, and this would allow you to single-step within scoot_over().
Following the Top-Down Approach to Debugging described in Other Debugging Principles, we opt for the next command instead of step at line 40. When GDB stops at line 41, you can take a look at y to see if the function did its job correctly. If that hypothesis is confirmed, you will have avoided a time-consuming inspection of the detailed operation of the function scoot_over() that would have contributed nothing to fixing the current bug. If you fail to confirm that the function worked correctly, you can run the program in the debugger again and enter the function using step in order to inspect the function's detailed operation and hopefully determine where it goes awry.
So, when you reach line 40, type next, yielding
    31            y[0] = new_y;
    32            return;
    33         }
    34         // need to insert just before the first y
    35         // element that new_y is less than
    36         for (j = 0; j < num_y; j++)  {
    37            if (new_y < y[j])  {
    38               // shift y[j], y[j+1],... rightward
    39               // before inserting new_y
    40               scoot_over(j);
  > 41               y[j] = new_y;
    42               return;
    43            }
    44         }
    45      }
 File: ins.c    Procedure: insert    Line: 41      pc: 0x8048440
--------------------------------------------------------------------------
(gdb) next
(gdb) next
(gdb)
Did scoot_over() shift the 12 correctly? Let's check:
(gdb) print y
$4 = {12, 0, 0, 0, 0, 0, 0, 0, 0, 0}
Apparently not. The problem indeed lies in scoot_over(). Let's delete the breakpoint at the beginning of insert() and place one in scoot_over(), again with a condition that we stop there during the second iteration of line 49:
(gdb) clear 30
Deleted breakpoint 1
(gdb) break 23
Breakpoint 2 at 0x80483c3: file ins.c, line 23.
(gdb) condition 2 num_y==1
Now run the program again:
    15         num_inputs = ac - 1;
    16         for (i = 0; i < num_inputs; i++)
    17         x[i] = atoi(av[i+1]);
    18      }
    19
    20      void scoot_over(int jj)
    21      {  int k;
    22
 *> 23         for (k = num_y-1; k > jj; k++)
    24            y[k] = y[k-1];
    25      }
    26
    27      void insert(int new_y)
    28      {  int j;
    29
 File: ins.c    Procedure: scoot_over    Line: 23      pc: 0x80483c3
--------------------------------------------------------------------------
(gdb) condition 2 num_y==1
(gdb) run
The program being debugged has been started already.
Start it from the beginning? (y or n)
Starting program: /debug/insert_sort 12 5

Breakpoint 2, scoot_over (jj=0) at ins.c:23
(gdb)
Once again, follow the Principle of Confirmation: Think about what you expect to occur, and then try to confirm that it does occur. In this case, the function is supposed to shift the 12 over to the next position in the array y, which means that the loop at line 23 should go through exactly one iteration. Let's step through the program by repeatedly issuing the next command, in order toverify this expectation:
    15         num_inputs = ac - 1;
    16         for (i = 0; i < num_inputs; i++)
    17         x[i] = atoi(av[i+1]);
    18      }
    19
    20      void scoot_over(int jj)
    21      {  int k;
    22
 *  23         for (k = num_y-1; k > jj; k++)
    24            y[k] = y[k-1];
  > 25      }
    26
    27      void insert(int new_y)
    28      {  int j;
    29
 File: ins.c    Procedure: scoot_over    Line: 25      pc: 0x80483f1
--------------------------------------------------------------------------
The program being debugged has been started already.
Start it from the beginning? (y or n)
Starting program: /debug/insert_sort 12 5

Breakpoint 2, scoot_over (jj=0) at ins.c:23
(gdb) next
(gdb) next
(gdb)
Here we again get a surprise: We are now on line 25, without ever touching line 24—the loop executed no iterations, not the single iteration that we had expected it to execute. Apparently there is a bug in line 23.
As with the earlier loop that unexpectedly executed no iterations of its body, it must be that the loop condition was not satisfied at the very beginning of the loop. Is this the case here? The loop condition on line 23 is k > jj. We also know from this line that k's initial value is num_y-1, and we know from our breakpoint condition that the latter quantity is 0. Finally, the GDB screen tells us that jj is 0. So the condition k > jj was not satisfied when the the loop began.
Thus, we misspecified either the loop condition k > jj or the initialization k = num_y-1. Considering that the 12 should have moved from y[0] to y[1] in the first and only iteration of the loop—that is, line 24 should have executed withk = 1—we realize that the loop initialization is wrong. It should have been k = num_y.
Fix the error, recompile the program, and run the program again (outside GDB):
$ insert_sort 12 5
Segmentation fault
Segmentation faults, discussed in detail in Chapter 4, occur when a running program attempts to access memory that it does not have permission to access. Typically the cause is an out-of-bounds array index or an errant pointer value. Seg faults can also arise from memory references that do not explicitly involve pointer or array variables. One example of this can be seen in another classic C programmer's error, forgetting the ampersand in a function parameter that is passed using call-by-reference, for example, writing
scanf("%d",x);instead of
scanf("%d",&x);In general, the main value of a debugging tool such as GDB or DDD is to facilitate the process of verifying one's coding assumptions, but in the case of seg faults a debugging tool gives extra, tangible, immediate help: It tells you where in your program the fault occurred.
To take advantage of this, you need to run insert_sort in GDB and recreate the seg fault. First, remove your breakpoint. As seen earlier, to do this you need to give the line number of the breakpoint. You might already remember this, but it is easy to look for it: Either scroll through the TUI window (using the up and down arrow keys), looking for lines marked with asterisks, or use GDB's info break command. Then delete the breakpoint using the clear command:
(gdb) clear 30
Now run the program again, in GDB:
    19
    20      void scoot_over(int jj)
    21      {  int k;
    22
    23         for (k = num_y; k > jj; k++)
  > 24            y[k] = y[k-1];
    25      }
    26
    27      void insert(int new_y)
    28      {  int j;
    29
    30         if (num_y == 0)  { // y empty so far, easy case
    31            y[0] = new_y;
 File: ins.c    Procedure: scoot_over    Line: 24      pc: 0x8048538
--------------------------------------------------------------------------
Start it from the beginning? (y or n)

`/debug/insert_sort' has changed; re-reading symbols.
Starting program: /debug/insert_sort 12 5

Program received signal SIGSEGV, Segmentation fault.
0x08048538 in scoot_over (jj=0) at ins.c:24
(gdb)
As promised, GDB tells us exactly where the seg fault occurred, at line 24, and sure enough, an array index is apparently involved, namely k. Either k was large enough to exceed the number of elements in y, or k-1 was negative. Clearly the first order of business is to determine the value of k:
(gdb) print k
$4 = 584
Whoa! The code had dimensioned y to have only 10 elements, so this value of k is indeed far out of range. We must now track down the cause.
First of all, determine the iteration of the grand loop at line 49 during which this seg fault occurred.
(gdb) print num_y
$5 = 1
So it was during the second iteration, which is the first time the function scoot_over() is executed. In other words, it is not the case that line 23 worked fine in the first few calls to scoot_over() but failed later on. There is still something fundamentally wrong with this line of code. And since the only remaining candidate is the statement
k++
(recall that you checked the other two portions of this line earlier), it must be the culprit. After taking another break to clear our heads, we realize with some embarrassment that this should have been k--.
Fix that line and once again recompile and run the program:
$ insert_sort 12 5
5
12
Now, that's progress! But does the program work for a larger data set? Let's try one:
$ insert_sort 12 5 19 22 6 1
1
5
6
12
0
0
Now you can begin to see the light at the end of the tunnel. Most of the array is being sorted correctly. The first number in the list that does not get sorted correctly is 19, so set a breakpoint at line 36, this time with the condition new_y == 19:[1]
(gdb) b 36
Breakpoint 3 at 0x804840d: file ins.c, line 36.
(gdb) cond 3 new_y==19
Then run the program in GDB (making sure to use the same arguments, 12 5 19 22 6 1). When you hit the breakpoint, you then confirm that the array y has been sorted correctly up to this point:
    31            y[0] = new_y;
    32            return;
    33         }
    34         // need to insert just before the first y
    35         // element that new_y is less than
 *> 36         for (j = 0; j < num_y; j++)  {
    37            if (new_y < y[j])  {
    38               // shift y[j], y[j+1],... rightward
    39               // before inserting new_y
    40               scoot_over(j);
    41               y[j] = new_y;
    42               return;
    43            }                                                       .
 File: ins.c    Procedure: insert    Line: 36      pc: 0x8048564
--------------------------------------------------------------------------
Start it from the beginning? (y or n)

Starting program: /debug/insert_sort 12 5 19 22 6 1

Breakpoint 2, insert (new_y=19) at ins.c:36
   (gdb) p y
   $1 = {5, 12, 0, 0, 0, 0, 0, 0, 0, 0}
   (gdb)
So far, so good. Now let's try to determine how the program swallows up the 19. We will step through the code one line at a time. Note that because 19 is not less than 5 or 12, we do not expect the condition in the if statement in line 37 to hold. After hitting n a few times, we find ourselves on line 45:
    35         // element that new_y is less than
 *  36         for (j = 0; j < num_y; j++)  {
    37            if (new_y < y[j])  {
    38               // shift y[j], y[j+1],... rightward
    39               // before inserting new_y
    40               scoot_over(j);
    41               y[j] = new_y;
    42               return;
    43            }
    44         }
  > 45      }
    46
    47      void process_data()                                           .
 File: ins.c    Procedure: insert    Line: 45      pc: 0x80485c4
--------------------------------------------------------------------------
   (gdb) n
   (gdb) n
   (gdb) n
   (gdb) n
   (gdb) n
   (gdb)
We are on line 45, about to leave the loop, without having done anything with the 19 at all! Some inspection shows that our code was not written to cover an important case, namely that in which new_y is larger than any element we've processed so far—an oversight also revealed by the comments on lines 34 and 35:
// need to insert just before the first y
// element that new_y is less than
To handle this case, add the following code just after line 44:
// one more case:  new_y > all existing y elements
y[num_y] = new_y;
Then recompile and try it again:
$ insert_sort 12 5 19 22 6 1
1
5
6
12
19
22
This is the correct output, and subsequent testing gives correct results as well.
Let's see how the above GDB session would have been carried out in DDD. There is of course no need to repeat all the steps; simply focus on the differences from GDB.
Starting DDD is similar to starting GDB. Compile your source using GCC with the -g option, and then type
$ ddd insert_sort
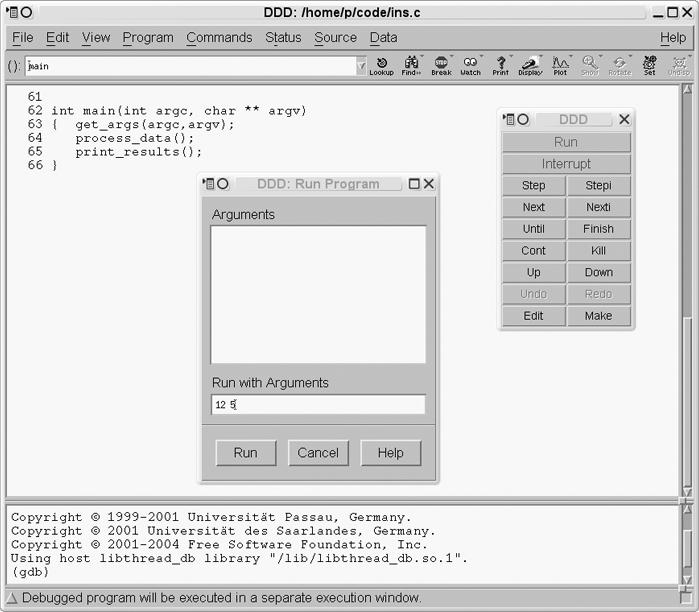
to invoke DDD. In GDB, you started execution of the program via the run command, including arguments if any. In DDD, you click Program | Run, after which you will see the screen shown in Figure 1-8
A Run window has popped up, presenting you with a history of previous sets of command-line arguments you've used. There are no previous sets yet, but if there were, you could choose one of them by clicking it, or you can type a new set of arguments, as shown here. Then click Run.
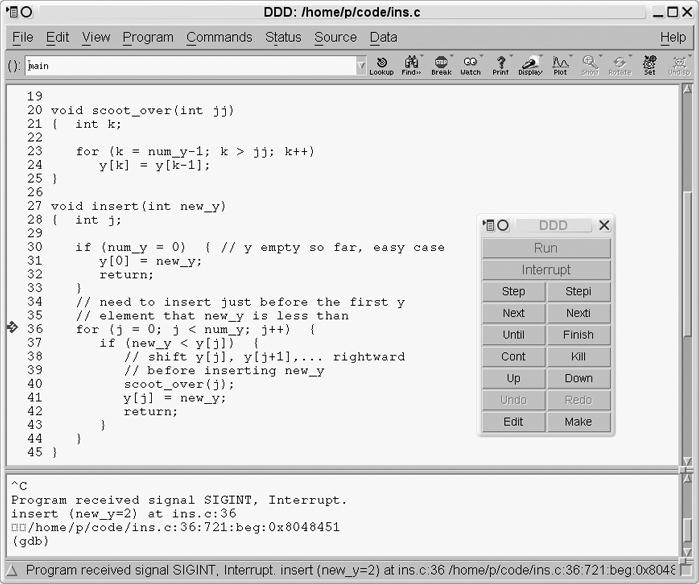
In the GDB debugging session, we ran our program for a while in the debugger and then suspended it using CTRL-C, in order to investigate an apparently infinite loop. In DDD, we suspend the program by clicking Interrupt in the Command Tool. The DDD screen now looks like the one in Figure 1-9. Because DDD acts as a front end to GDB, this mouse click is translated to a CTRL-C operation in GDB, which can be seen in the Console.
The next step in the GDB session above was to inspect the variable num_y. As shown earlier in Main Debugger Operations, you do this in DDD by moving the mouse pointer over any instance of num_y in the Source Window.
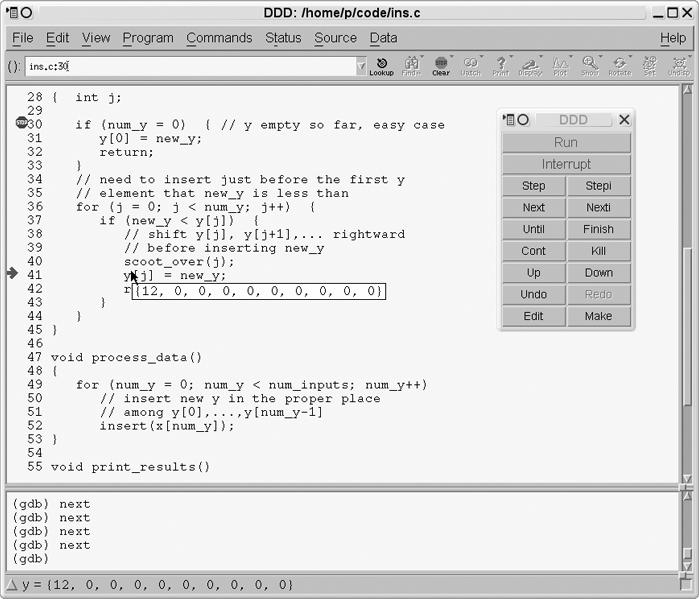
You can also inspect entire arrays in the same way. For example, at one point in the GDB session, you printed out the entire array y. In DDD, you would simply move the mouse pointer to any instance of y in the Source window. If you move the cursor over the y in the expression y[j] on line 30, the screen will appear as shown in Figure 1-10. A value tip box has appeared near that line, showing the contents of y.
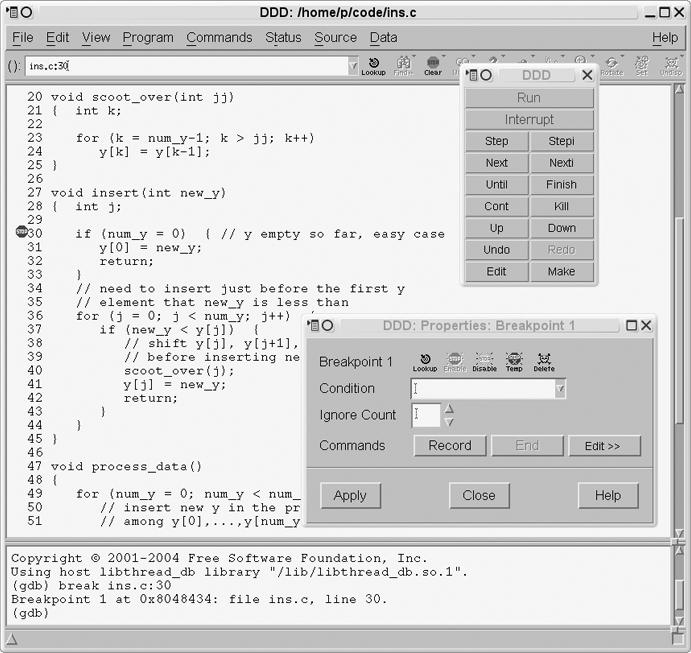
Your next action in the GDB session was to set a breakpoint at line 30. We have already explained how to set breakpoints in DDD, but what about putting a condition on the breakpoint, as was needed in this case? You can set a condition by right-clicking the stop sign icon in the breakpoint line and then choosing Properties. A pop-up window will appear, as seen in Figure 1-11. Then type your condition, num_y==1.
To then re-run the program, you would click Run in the Command Tool. As with GDB's run command with no arguments, this button runs the program with the last set of arguments that was provided.
DDD's analogs of GDB's n and s commands are the Next and Step buttons in the Command Tool. The analog of GDB's c is the Cont button.
This overview is enough to get you started with DDD. In later chapters we will explore some of DDD's advanced options, such as its highly useful capability of visually displaying complex data structures such as linked lists and binary trees.
Now let's see how the above GDB session would have been carried out in Eclipse. As in our presentation on DDD, there is no need to repeat all the steps; we'll simply focus on the differences from GDB.
Note that Eclipse can be rather finicky. Though it offers many ways to accomplish a certain task, if you do not strictly follow the necessary sequence of steps, you may find yourself in a bind with no intuitive solution other than to restart part of your debugging process.
We assume here that you have already created your C/C++ project.[2]
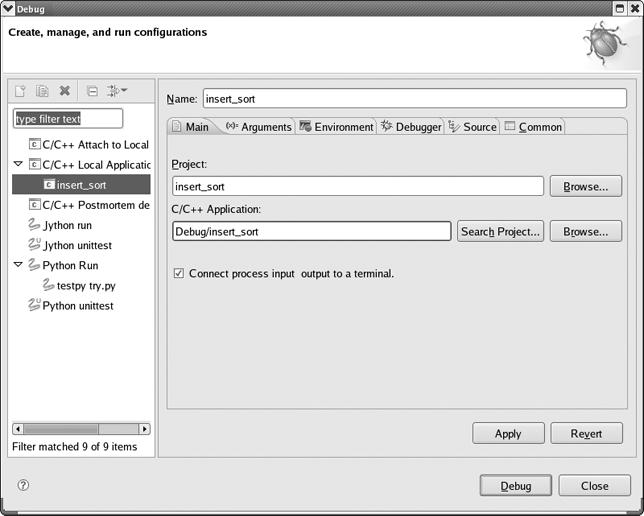
The first time you run/debug your program, you will need run and debug configurations. These specify the name of your executable (and what project it belongs to), its command-line arguments (if any), its special shell variable environment (if any), your debugger of choice, and so on. A run configuration is used to run your program outside the debugger, while a debug configuration is used within the debugger. Make sure to create both configurations, in that order, as follows:
Select Run | Open Run Dialog.
Right-click C/C++ Local Applications and select New.
Select the Main tab, and fill in your run configuration, project and executable file names (Eclipse will probably suggest them for you), and check the Connect process input and output to a terminal box if you have terminal I/O.
If you have command-line arguments or special environment variables, click the Arguments or Environment tab, and fill in the desired settings.
Select the Debugger tab to see which debugger is being used. You probably will not have to touch this, but it's good to understand that there is an underlying debugger, probably GDB.
Hit Apply (if asked) and Close to complete creation of your run configuration.
Start creating your debug configuration by selecting Run | Open Debug Dialog. Eclipse will probably reuse the information you supplied in your run configuration, as shown in Figure 1-12, or you can change it if you wish. Again, hit Apply (if asked) and Close to complete creation of your debug configuration.
One can create several run/debug configurations, typically with different sets of command-line arguments.
To start your debugging session, you must move to the Debug perspective by selecting Window | Open Perspective | Debug. (There are various shortcuts, which we'll leave to you to discover.)
The first time you actually execute a run or debug action, you do so via Run | Open Run Dialog or Run | Open Debug Dialog again, as the case may be, in order to state which configuration to use. After that, though, simply select Run | Run or Run | Debug, either of which will rerun the last debug configuration.
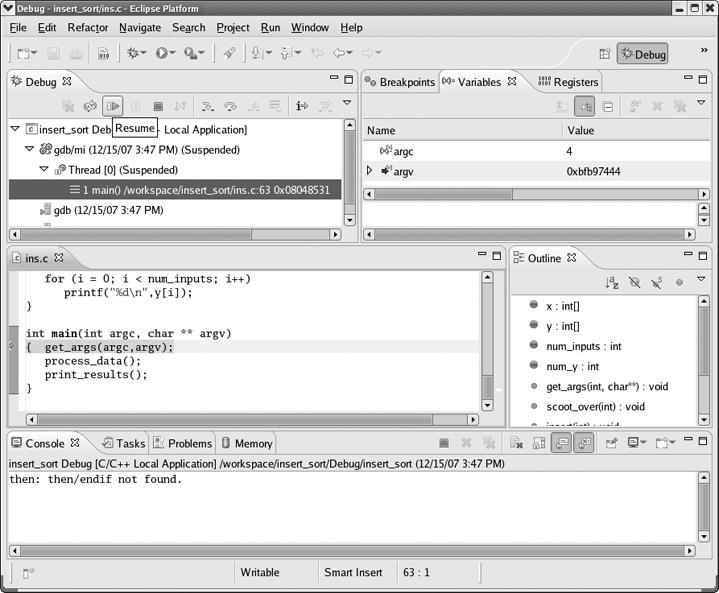
In fact, in the debug case, there is a quicker why to launch a debug run, which is to click the Debug icon right under Navigate (see Figure 1-13). Note carefully, though, that whenever you start a new debug run, you need to kill existing ones by clicking a red Terminate square; one is in the toolbar of the Debug view, and another is in the Console view. The Debug view also has a double-X icon, Remove All Terminated Launches.
Figure 1-13 shows the screen as it appears after you have launched your debug. One can set the starting line in Eclipse debug dialogs, but they typically default to placing an automatic breakpoint at the first executable line of code. In the figure, you can see this from the breakpoint symbol in the left margin of the line
{ get_args(argc,argv);That line is also highlighted, as it is the line you are about to execute. Go ahead and execute it by clicking the Resume icon in the Debug view toolbar (above a box that popped up in the window because you moved the mouse pointer to that icon).
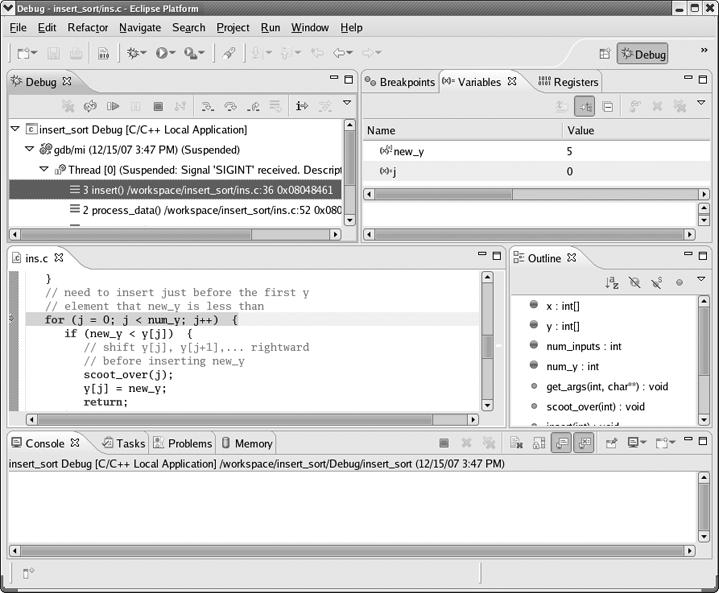
Recall that in the sample GDB session, the first version of the program had an infinite loop, and the program was hanging. Here of course you will see the same symptom, with no output in the Console view. You need to kill the program. However, you do not want to do so by clicking one of the red Terminate squares, because this would also kill your underlying GDB session. You want to stay in GDB in order to take a look at where you were in the code—i.e., the location of the infinite loop—examine the values of variables, and so on. So, instead of a Terminate operation, choose Suspend, clicking the icon to the right of Resume in the Debug view toolbar. (In Eclipse literature, this button is sometimes called Pause, as its symbol is similar to that for pause operations in media players.)
After clicking Suspend, your screen looks like Figure 1-14. You'll see that just before that operation, Eclipse was about to execute the line
for (j = 0; j < num_y; j++) {You can now examine the value of num_y by moving the mouse pointer to any instance of that variable in the source window (you find that the value is 0), and so on.
Recall again our GDB session above. After fixing a couple of bugs, your program then had a segmentation fault. Figure 1-15 shows your Eclipse screen at that point.
What had happened was that we had clicked Resume, so our program was running, but it suddenly halted, at the line
y[k] = y[k-1];
due to the seg fault. Oddly, Eclipse does not announce this in the Problems tab, but it does do so in the Debug tab, with the error message
(Suspended'SIGSEGV' received. Description: Segmentation fault.)
again visible in Figure 1-15.
You see in that tab that the fault occurred in the function scoot_over(), which had been called from insert(). Again you can query the values of the variables and find, for instance, that k = 544—way out of range, as in the GDB example.
In the GDB example you also set conditional breakpoints. Recall that in Eclipse you set a breakpoint by double-clicking in the left margin of the desired line. To make that breakpoint conditional, then right-click the breakpoint symbol for that line, and select Breakpoint Properties… | New | Common, and fill in the condition in the dialog. The dialog is depicted in Figure 1-16.
Recall too that in your GDB session you occasionally executed your program outside GDB, in a separate terminal window. You can easily do that in Eclipse too, by selecting Run | Run. The results will be in the Console view, as usual.
[1] It's about time to start using the common abbreviations for the commands. These include b for break, i b for info break, cond for condition, r for run, n for next, s for step, c for continue, p for print, and bt for backtrace.
[2] Since this is a book about debugging, not project management, we will not say much here about creating and building projects in Eclipse. A quick summary, though, would be that you create a project as follows: Select File | New | Project; choose C (or C++) Project; fill in a project name; select Executable | Finish. A makefile is created automatically. You build (i.e., compile and link) your project by selecting Project | Build Project.
