Chapter 8 Abilities, Motivation, and Achievement
Outline
“Which man, which woman?”
Samuel Johnson, when asked whether man or woman is more intelligent
In 2005, then-president of Harvard University Lawrence Summers speculated, at a professional meeting, that women were underrepresented at the highest levels of achievement in mathematics and science because they lack the necessary mathematical ability (Dillon, 2005). Is there any scientific evidence that women are less intellectually competent than men? In this chapter we will explore empirical evidence regarding the abilities and achievements of women and whether they differ from those of men. Of course, it is important to remember that the finding of a gender difference does not say anything about what causes it—that is, whether biological or environmental factors are responsible. After a consideration of gender differences and similarities in abilities, we will examine motivation, framed by expectancy-value theory. Next we will look at data on girls’ and women’s achievements in school and occupations. And finally, we will consider the gender gap in STEM (science, technology, engineering, and mathematics), what causes it, and what might be done about it.
Abilities
General Intelligence
There is no evidence to support the hypothesis that girls and women are less intelligent than boys and men. In fact, research has consistently shown that there are no gender differences in general intelligence (Maccoby & Jacklin, 1974).
These results need to be interpreted carefully, though, because of the nature of IQ test construction. It became clear to the early test constructors that boys would do better on some kinds of items, whereas girls would do better on others. They decided to balance these subtests so that there would be no gender differences in overall measured intelligence. Therefore, saying that there are no gender differences in tested intelligence essentially means that the test constructors succeeded in their goal of eliminating gender differences. Rather than looking at global assessments, it is more informative to analyze patterns of specific abilities by gender, such as mathematical ability or verbal ability.
For years, psychology textbooks have told students that there were gender differences in three basic abilities: verbal ability, spatial ability, and mathematical ability, with female test takers scoring higher on verbal tests and male test takers scoring higher on spatial and mathematical tests. However, we now have meta-analyses to give us a more accurate and detailed understanding of whether there are gender differences in these abilities and, if so, how large the differences are.
Verbal Ability
Although the stereotype is that girls and women show better verbal ability than boys and men, a meta-analysis found that the gender difference in verbal ability is so small as to be trivial (Hyde & Linn, 1988). Overall, d = –0.11, indicating a slight female superiority, but one that is so small that it can be called zero. The analysis also looked at different types of verbal ability, such as vocabulary, analogies, reading comprehension, and essay writing. The gender difference was small for all types of verbal performance.
Another interesting finding emerged: The evidence indicated that gender differences had grown smaller over time. For studies published earlier than 1973, d = –0.23, whereas for studies published after 1973, d = –0.10. That is, the gender difference was cut approximately in half. We can’t be certain what caused this narrowing of the gender gap. One possibility is that gender role socialization practices became more flexible over those decades, and a result is a reduction in the size of gender differences. Another possibility is that those who produce standardized tests have become more sensitive about gender equity issues, resulting in tests that show reduced gender differences.
Spatial Ability
Several major meta-analyses of gender differences in spatial performance are available. An early meta-analysis found that there are actually at least three types of spatial ability, each showing a different pattern of gender differences (Linn & Petersen, 1985). The first type, spatial visualization, involves finding a figure in a more complex one, like the hidden figures games you may have played as a child. This type of spatial ability shows only a slight gender difference favoring boys and men, d = 0.13 (Linn & Peterson, 1985). The second type of spatial ability, spatial perception, requires a person to identify a true vertical or true horizontal line when there is distracting or misleading information around it. This type of spatial ability showed a somewhat larger gender difference favoring boys and men. The third type of spatial ability, mental rotation, requires the test taker to mentally rotate an object in three dimensions in order to obtain the correct answer. A sample of one of these items is shown in Figure 8.1. In the most recent meta-analysis, male participants outperformed female participants in 3-D mental rotation by a moderate amount, d = 0.57 (Maeda & Yoon, 2013).
An important point is that 3-D mental rotation skills are not just something that you’re born with, something that is hardwired in the brain. In fact, spatial skills improve with training and practice, just like mathematical knowledge is learned. For example, in one experiment, college students were given 10 hours of training on an action video game, Medal of Honor: Pacific Assault; controls played a puzzle game (Feng et al., 2007). Both women and men in the experimental group improved their performance on a mental rotation test. The women improved more than the men, and experimental group women performed as well as control group men.
A meta-analysis of spatial skills training studies found that, on average, training improved scores by d = 0.47 compared with controls (Uttal, Meadow, et al., 2013). The effects of training lasted, too, even when tested weeks later. Notice that the training effect is about as large as the gender gap.
The problem is that, unlike the extensive language arts curriculum and math curriculum in the schools, there is no curriculum to train spatial skills in most schools (Uttal, Miller, et al., 2013). As a matter of gender equity, this skill in which girls are disadvantaged should be part of the school curriculum. Research also indicates that training in spatial skills leads to better performance in STEM courses, so a spatial skills curriculum should have multiple benefits to both girls and boys (Uttal, Miller, et al., 2013).
An intersectional approach is informative here, with a focus on the intersection of gender and social class. In one study, elementary school children were tested in two areas of spatial performance: mental rotation and map reading (Levine et al., 2005). No gender difference was found among the low-income children, but the usual gender difference was found for middle- and upper-income children. The researchers concluded that boys in low-income environments do not have access to the activities (such as computer games, puzzles, and building toys) that give boys in more affluent environments the chance to improve their spatial skills and improve them relative to girls. These findings speak to the importance of environment and experience in creating or erasing gender differences.
Figure 8.1 Sample item and solution from a test of spatial ability.
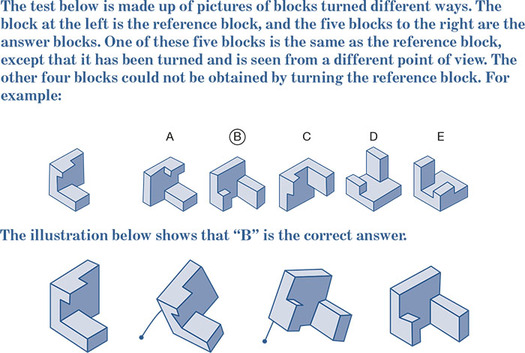
Source: From R. E. Stafford, Identical Blocks, form AA, 1962. Reprinted with the permission of R. E. Stafford and Harold Gulliksen.
Mathematics Performance
The stereotype is that boys and men have the edge over girls and women in math. What do the data say? A major meta-analysis compiled data on the mathematics performance of 7 million U.S. children in Grades 2 through 11, using data from well-sampled state assessments (Hyde et al., 2008). Contrary to the stereotype that boys and men are the smart ones in math, averaged across all ages, d = 0.0065, meaning that there is exactly no gender difference. Gender differences were uniformly close to zero at all grade levels.
Another meta-analysis synthesized data from 242 studies representing the testing of 1.2 million people of all ages (Lindberg et al., 2010). Overall, d = 0.05. Consistent with the first meta-analysis, there was no gender difference in mathematics performance. Stated a different way, female test takers scored as high as male test takers.
Similar results have been found in many other nations. The Trends in International Mathematics and Science Study (TIMSS) involves testing 15-year-olds in 46 countries (Else-Quest et al., 2010). Results for six of these countries are shown in Table 8.1. Notice that the effects fluctuate slightly from one country to another, but all are close to 0.
The odd thing is that, despite all the evidence of gender similarities in actual math performance, stereotypes about male math superiority persist. As we saw in Chapter 3, implicit stereotypes measured by the Implicit Association Test (IAT) link mathematics to males (Nosek et al., 2002). As early as second grade, children show the implicit stereotype that math is for boys (Cvencek et al., 2011).
Why is the gender difference in math performance—or its absence—so important? One reason is that mathematical skills are essential to a number of high-status, lucrative occupations that are male-dominated, such as engineering and the physical sciences. Women’s underrepresentation in these fields has been attributed to their lack of mathematical ability (Ceci & Williams, 2010), but, as we have just seen, that explanation is bogus. Measured in a number of different ways, and based on large meta-analyses, women have as much mathematical ability as men do. The implication is that other factors must explain women’s underrepresentation, a point to which we will return later in this chapter in the section on the gender gap in STEM. It is important that women have equal access to these high-paying, prestigious careers.

Source: Data from Else-Quest, Nicole M., Hyde, Janet S., & Linn, Marcia C. (2010). Cross-national patterns of gender differences in mathematics: A meta-analysis. Psychological Bulletin, 136, 103–127. Table created by Janet Hyde.
Physical Performance and Athletics
Gender differences in physical and athletic performance provide a contrast to the findings for cognitive abilities. For example, d = 2.0 for physical height in humans (Niewenweg et al., 2003), a difference that is about four times greater than the gender difference in spatial ability.
Large gender differences in some kinds of athletic performance tend to emerge in adolescence (Eaton & Enns, 1986). For example, for speed in the 50-yard dash, d = 0.63, when averaged over all ages, but d = 2.5 for adolescence and beyond. For throwing distance, d = 1.98. For some other aspects of athletic performance, though, gender differences are small or zero; for example, on tests of balance, d = 0.09.
Athletic performance is also strongly responsive to training and diet, as we have seen in the past 25 years with the great advances made in these areas. Figure 8.2 shows gold medal performance in the Olympics over the years for men and women in the 100-meter dash. As you can see, the women who win today run faster than the record-breaking men of 1928, and the gender gap has narrowed.
Figure 8.2 Gold medal performances of men and women in the 100-meter dash in the Olympic Games. Women were not permitted to compete in track and field events until 1928.
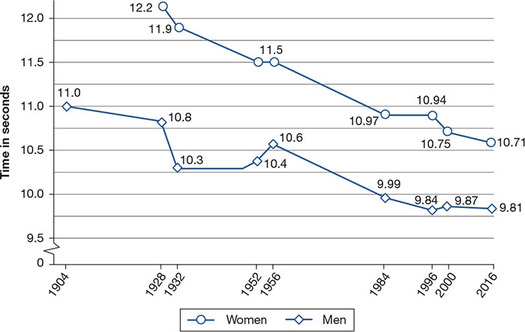
Source: Created by the authors.
Focus 8.1 Gender Diversity and Athletics
Dutee Chand is a woman sprinter from India who grew up in a low-income family (Padawer, 2016). At 5’3’’ tall and 110 pounds she holds the national championship in the 100 meters and qualified for the 2016 Olympics. She found herself at the center of a controversy in 2014, at age 18, when she was about to compete in the Commonwealth Games (for Britain and the former colonies). Pregame biological testing indicated that she has unusually high levels of testosterone for a woman; her level is in the range more typical for men. The condition is known as hyperandrogenism. Officials ruled that she was ineligible to compete. The Indian government appealed the decision and it was eventually reversed, but not until Chand had been the object of intense scrutiny.
In another case, Maria José Martinez-Patiño, from Spain, was a rising star in women’s track and field, but in 1985 sex testing revealed that she had a Y chromosome and she was ruled ineligible to compete as a woman (Sánchez et al., 2013). She has complete androgen-insensitivity syndrome (AIS), so, despite her XY chromosomes, her body does not respond to androgens and she has the body of a woman and the identity of a woman. Eventually she was reinstated, but the incident left long-lasting marks on her.
One thing to notice is that, in both these cases and all others in which athletes’ sex has been called into question, women are the only ones tested and the only ones whose sex is disputed. Sex verification testing of female athletes began in the 1930s and, in the past, included such indignities as appearing naked before judges and even physical exams (Vilain & Sánchez, 2012).
Advocates for sex testing of female athletes say that their goal is to “level the playing field.” Critics point out that this kind of testing mainly has the effect of humiliating the woman who has some atypical gender feature, such as chromosomes or hormone levels. Moreover, many other biological factors contribute to individuals becoming elite athletes. For example, there are actually genes for muscularity (ACTN3 and MSTN; Vilain & Sánchez, 2012). Yet no one claims that people with those genes have an unfair advantage in athletics.
In the end, we realize that athletic competitions are stuck in the concrete of the gender binary. A college has a men’s basketball team and a women’s basketball team. Yet contemporary understandings of gender indicate that the binary is completely inadequate. We have people who are female (based on gender assigned at birth) and who identify as women (cisgender women) yet have high testosterone levels. There are people who are male (based on gender assigned at birth) but who identify as female (transgender women) and may undergo some medical gender reassignment. How will sports organizations deal with these complexities?
Photo 8.1 Dutee Chand (left) and Maria José Martinez-Patiño (right)

Photo of Chand by Athletics Federation of India—Odisha2017.games, CC BY-SA 4.0.
Summary
A number of conclusions emerge from this discussion of gender differences in abilities.
- There are no gender differences in verbal ability.
- There are no gender differences in mathematical performance.
- There are gender differences in one type of spatial ability, mental rotation—an ability that is important in career fields such as engineering. However, spatial skills can be improved by training.
- Gender differences in cognitive abilities are so small as to be irrelevant in practical situations such as job counseling. It would be a great mistake, for example, to urge a high school girl not to pursue an engineering career just because girls on average score lower than boys on tests of mental rotation. There is too much variability from one girl to the next to predict that an individual woman will not have adequate spatial ability for such a career. A far better indicator would be her score on a mental rotation test. And even if her score is mediocre, we could suggest that she take a spatial training program.
- Gender differences in some kinds of athletic performance are large beginning in adolescence.
Motivation: Expectancy-Value Theory
What motivates a person to take physics in high school? To study hard for a math exam? To declare an engineering major in college? In many cases, what we achieve in life is more a matter of motivation than it is of abilities. Psychologists have studied motivation extensively. Here we will focus on one major theory of motivation, Jacquelynne Eccles’s expectancy-value theory (e.g., Eccles, 1994; Meece et al., 1982). Literally hundreds of studies have been based on this theory, and it has much to say about gender.
A diagram of Eccles’s model is shown in Figure 8.3. The final outcome that the model seeks to predict is achievement behavior (such as taking a physics course in high school), and it is shown in box K on the far right of the figure. The multiple factors feeding into the choice of a course are shown in the other boxes in the diagram.
The model is an expectancy-value theory of achievement motivation. That is, any particular achievement behavior is a product of the person’s expectations for success and the person’s values. Several types of values are involved (box J), but we will focus on two of them: utility value (How useful is this course to me, now and in the future?) and interest-enjoyment value (Will I find this course intrinsically interesting or enjoyable?). Marika is a high school junior who is contemplating taking an optional course in physics. The theory says that she will sign up for physics only if she has positive expectations for success in the course (if she thinks she’ll get an F, she won’t sign up) and positive values with respect to the course (if she thinks the course will be valuable to her now and in the future; for example, she might think that having physics on her transcript will help her get into college). The values part of the model is shown in the bottom half of Figure 8.3 (box J) and the expectancies part is show in the top half (box I).
Figure 8.3 Eccles’s model of academic course choice and achievement shows how girls’ expectations and values may be shaped such that they do not take as many science courses in high school as boys do or might not major in engineering in college.
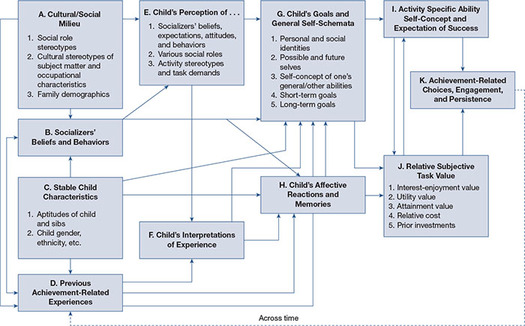
Source: © Jacque Eccles. Reprinted with permission.
According to the theory, many factors shape Marika’s values regarding science courses, including the following:
- Her goals (box G): Marika has some tentative occupation goals. Perhaps she plans to go premed in college and knows that physics is a premed requirement. Therefore, she should take physics in high school to prepare. Alternatively, perhaps she plans on becoming a high school English teacher. She perceives no usefulness or relevance of physics for her future career.
- Her socializers’ beliefs (box B) and her perceptions of those socializers’ beliefs and expectations (box E): These factors shape her goals. Perhaps her mother is a physician and has encouraged or even expects Marika to go that route, too. Perhaps her father loves (is intrinsically interested in) literature and has conveyed that love to Marika so that she wants a career as an English teacher.
Many factors also shape expectancies for success, including the following:
- Her aptitudes and grades (boxes C and D): Marika has a pretty good idea of her aptitudes for math and science from a variety of sources, including her grades in past courses and her scores on standardized tests.
- Her interpretations or attributions (box F): It isn’t always the objective outcomes (grades and test scores) that influence us, but instead our subjective interpretations of them. Marika may have gotten A’s and B’s in all her math and science courses, but she may not attribute the good grades to her own abilities. Instead, she may think that the courses so far have just been easy. As a result, she has low expectations for success in a difficult physics course.
Eccles and others have conducted numerous studies testing various links in the model. Space does not permit us to review all of this research, but, in brief, the evidence supports the model. As one example, research has documented the links between parents’ beliefs and their child’s sense of competence and achievement in math and science. In one remarkable longitudinal study, mothers’ estimates of their sixth-grade child’s likelihood of success in mathematics predicted the child’s actual math career choice at 24 years of age, even after controlling for measures of the child’s ability (Bleeker & Jacobs, 2004). Importantly, mothers’ sixth-grade estimates of their child’s math career success were significantly higher for boys than for girls. Parents’ belief in their children is a powerful force.
Other studies, including experimental research, show that, when students perceive more utility value in their courses, they work harder, develop more interest in the material, and perform better in the course (e.g., Hulleman et al., 2010). These findings support key points in the expectancy-value model.
As an interesting exercise, you might trace through Eccles’s model, thinking of yourself, trying to see how it predicts why you did or did not continue taking math and science courses in high school and college.
What are the practical implications of Eccles’s model? Suppose that our goal was to get more girls enrolled in science courses to expand their career options. How would we do that, according to the theory? We could work on the expectancy side of the model, on the value side, or both. On the expectancy side, we would try to get high school girls to have higher expectancies for success in math and science courses. This could be done in a number of ways: by stressing that no average gender differences exist in math ability, by pointing to a pattern of success in math and science courses for an individual girl, and by encouraging girls to attribute their previous good grades in math and science to their own abilities. On the value side, we would need to increase the utility value that girls attach to math and science courses. Most girls are probably not aware of the wide variety of careers (such as nursing) that require math and science. Individual counseling sessions might examine each girl’s anticipated career and the math and science required for it. We will return to these ideas in the section on the gender gap in STEM later in this chapter.
Achievement
We can think about gender and achievement in many areas. Here we will focus on school achievement and occupational achievement.
School Achievement
In terms of school achievement, girls earn better grades than boys at all grade levels. And they earn better grades in all subjects, including those stereotyped as showing male superiority, such as math and science. A meta-analysis found that, overall, d = –0.23 (Voyer & Voyer, 2014). When broken down by subject, the female advantage was greatest in language arts and smallest (but still an advantage) in math.
The media have proclaimed news of a “boy crisis” in education, implying that boys have recently fallen behind girls to an alarming extent. The findings from a meta-analysis contradict those claims (Voyer & Voyer, 2014). The meta-analysis covered data from 1914 to 2011, and girls have been getting better grades than boys the whole time.
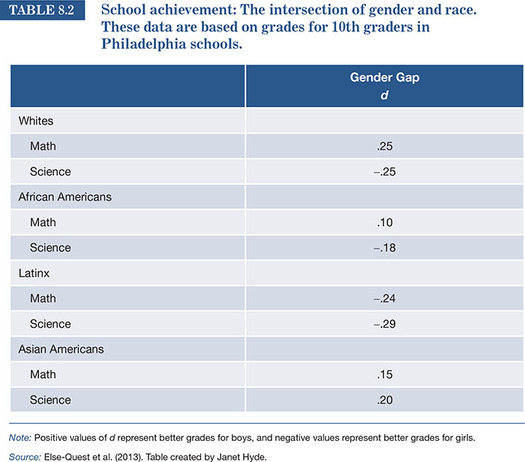
We can also take an intersectional approach to school achievement, examining the intersection of gender and ethnicity. Table 8.2 shows the gender gaps in students’ grades in 10th grade in math and science for four ethnic groups in the United States (Else-Quest et al., 2013). Several results are worth noting. First, all of the gender gaps (d values) are small, pointing to gender similarities. Second, the gaps can be reversed for math compared with science. For example, among Whites, boys had better grades than girls in math, but girls had the better grades in science. Third, the gaps can be reversed from one ethnic group to another. For example, among Latinx, girls had better grades than boys in science, but among Asian Americans, boys had better science grades. All of this cautions against universalizing statements about gender differences. Boys aren’t better than girls at science in all ethnic groups, nor do girls always perform better.
Occupational Achievement
We will take up the topic of women and work in detail in Chapter 9. Here we will briefly summarize a few patterns in women’s occupational achievements.
Over the past several decades, women have moved strongly into a number of high-status, challenging occupations that were formerly dominated by men. The best examples are medicine, veterinary medicine, and law. Other occupations have not seen such an influx of women and remain male-dominated. The best example is engineering. Earlier in the chapter, using expectancy-value theory, we considered some of the motivational factors that might contribute to women choosing to achieve in some occupations and not others. Later in this chapter, we will consider explanations specifically for the gender gap in STEM.
One researcher analyzed data from the National Education Longitudinal Study, which followed a large, representative sample of U.S. students longitudinally into adulthood (Mello, 2008). In high school, boys and girls had similar educational expectations, on average expecting to attend college. Girls actually had higher expectations of a professional occupation than boys did, from high school through age 26. This pattern was the same across all ethnic groups. By age 26, the women had attained more education than the men had. Remarkably, given patterns in the 1950s and earlier, by age 26 women were more likely to be in a professional occupation than men were. Now, of course, professional occupations include female-dominated occupations such as teaching and social work, but they also include doctors, lawyers, and engineers. With these data, we can see the remarkable progress that women have made in entering the professions.
The Gender Gap in STEM
STEM refers to science, technology, engineering, and mathematics. Women tend to be underrepresented in some—but not all—of these fields. We can look at the underrepresentation at multiple levels: undergraduate majors, PhD degrees, and workforce representation. Data on these points are shown in Table 8.3.
As you can see, women are actually not underrepresented in all STEM areas. Women earn roughly half of the undergraduate degrees in biology and in mathematics. If women can’t do math and science, how can this be? Even at the PhD level, women earn half the degrees in biology and a substantial fraction in chemistry. In other areas, though, women are severely underrepresented: computer science, engineering, and physics. That is true whether we look at PhDs awarded to women or women in the workforce in those areas. And those numbers aren’t budging. They have been at that level for more than a decade and are not increasing, despite the efforts of many. What we need to do, then, is explain the underrepresentation of women in computer science, engineering, and physics, not in all of STEM. Once we have the explanation(s), we can devise interventions that will close the gap.
Focus 8.2 Achieving Women: Ellen Ochoa
Dr. Ellen Ochoa is the director of the Johnson Space Center in Houston. And she was an astronaut before that, making her the first Latina in space. How did she get to her prestigious position in a very nontraditional field for women?
Photo 8.2 Ellen Ochoa

By NASA - spacelight.nasa.gov, Public Domain.
Born in 1958, she grew up with her four siblings in La Mesa, California. While she was a child, she displayed great interest in math and science. She went on to earn her BS in physics from San Diego State University, graduating at the top of her class. She was also dedicated to music and, for a time, she considered pursuing a career as a professional flutist. However, she decided in favor of continuing in science, earning her PhD in electrical engineering at Stanford in 1985.
She went to work as a research engineer at the Sandia National Laboratory and later went to NASA’s Ames Research Division. The systems that she developed in these positions made important contributions to aerospace technology, and she was accepted into NASA’s astronaut training program. In 1993, she traveled on the Discovery space shuttle mission.
She has been honored with many awards, too numerous to list, including NASA’s highest award, the Distinguished Service Medal, and the Hispanic Heritage Leadership Award. In addition, four schools have been named for her.
Source: NASA (2015).
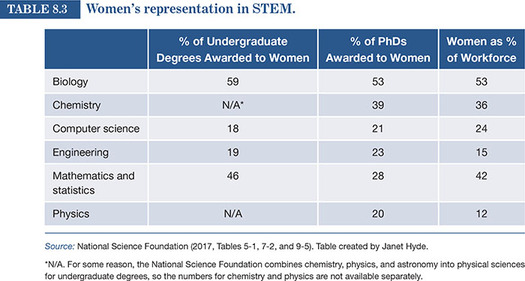
Source: National Science Foundation (2017, Tables 5-1, 7-2, and 9-5). Table created by Janet Hyde.
N/A. For some reason, the National Science Foundation combines chemistry, physics, and astronomy into physical sciences for undergraduate degrees, so the numbers for chemistry and physics are not available separately.
But first, let’s consider this question: Why do we care about the underrepresentation of women in STEM? What would you say? Here are some reasons. First, we want women to have equal opportunities in all areas of life, and the data seem to indicate that they don’t have equal opportunity in some of these fields. Second, these are jobs that pay very well and where there is much demand for workers. They definitely beat unemployment or some of the low-wage jobs that women are stuck in. For many women, STEM jobs represent real opportunities for themselves and their families and, as we will see in Chapter 9, many women are the sole support or the major supporter of their family. These are not just puzzling academic questions; they are important to people’s lives.
Explanations for the Gender Gap in STEM
Numerous explanations have been proposed for the gender gap in STEM—or more accurately, in computer science, engineering, and physics (Cheryan et al., 2017). Let’s call that CEP. We will consider seven of those explanations here.
Women lack interest:
According to this explanation, women simply lack interest in CEP and don’t pursue it. It’s not that they face discrimination or a chilly climate in those fields; it’s just that they don’t find them interesting. It is a matter of free choice.
A meta-analysis of research on gender differences in interests found that, in general, men are more interested in things (robots, computers, race cars) and women are more interested in people (Su et al., 2009). If we look at the specifics, men showed more interest in engineering (d = 1.11), science (d = 0.36) and mathematics (d = 0.34), whereas women were more interested in social (d = –0.68) and artistic (–0.35) areas.
Some of these effect sizes are enormous compared to ones we have seen previously, such as gender differences in math performance. Does that mean that gender differences in interests explain gender gaps in CEP? Not so fast.
First, finding these large gender differences in interests tells us nothing about why the differences are there in the first place. It does not mean that they are biologically determined or hardwired in the brain. It seems likelier that boys are encouraged to be interested in fields like engineering and girls are not. We could change the environment so that girls would find engineering interesting.
Second, people who are in the CEP fields tend to portray them in a certain way that will be more interesting to men than to women. Engineering, for example, is portrayed as designing bridges or a better computer chip. If, instead, engineering advertised itself in the biomechanical engineering area (for example, designing better prostheses for people with damaged limbs), women might well find it more interesting and want to be part of it.
Women can’t do the necessary math:
The areas in which women are underrepresented require a high level of mathematical skills. They are termed math-intensive fields. If women are weak in math, they will not be able to succeed in those fields. However, as we saw earlier in this chapter, today girls are scoring as well as boys on mathematics tests, at least in the United States, and women are earning 46% of the undergraduate degrees in mathematics, so weak math ability cannot be the explanation for women’s underrepresentation in CEP.
Hostile environment and discrimination:
According to this explanation, women continue to be discriminated against in CEP, perhaps not in the crude, obvious ways that occurred in the past (old-fashioned sexism), but in more subtle ways (modern sexism), including implicit attitudes held by those in power. In the face of this discrimination, women would be likely to switch to other fields that they find more hospitable.
What is the evidence of continuing discrimination against women in CEP? First, as noted in Chapter 3, research shows that implicit attitudes link men and science, but not women and science (Carli et al., 2016). In one clever experiment, science faculty from research universities rated the materials of an applicant for a laboratory manager position (Moss-Racusin et al., 2012). All faculty saw the same materials, but half saw them with a male name for the applicant and half saw them with a female name. Faculty rated the male applicant as significantly more hirable and competent than the female applicant (who had identical qualifications to the male). The faculty also offered the male applicant a higher starting salary. Interestingly, both male and female faculty members showed this pattern. This study provides evidence of continuing discrimination against women in science.
Other research has sought to assess women’s own experiences of discrimination in STEM fields. One study surveyed high school girls who wanted STEM careers, women in undergraduate STEM majors, and women in STEM PhD programs (Robnett, 2016). Overall, 61% of the respondents reported having experienced gender bias in the past year alone. Consistent with patterns of women’s underrepresentation, experiences of gender bias were most common for those in math-intensive STEM fields (computer science, physics, engineering), and male peers were a major source of the bias. For example, among those in math-intensive graduate programs, 41% had experienced bias from male peers and 42% had experienced it from a professor. All of these numbers were much lower for women in the biological sciences—that is, they experienced much less bias. So women are underrepresented in areas (CEP) where they experience more bias.
A related idea is that the CEP fields are characterized by a masculine culture (Cheryan et al., 2017). The culture is masculine in several ways: There are few women in the field and stereotypes of people in the field are dominated by nerdy men. Women therefore feel that they don’t belong there. That brings us to the issue of role models.
Role models:
The conventional wisdom is that girls don’t aspire to CEP careers because of the absence of role models, specifically female role models. As shown in Table 8.2, women are only 15% of the engineering workforce, so girls look at people in those jobs—perhaps in TV programs or brochures about engineering careers—and think, “I don’t belong here.” End of story, end of aspirations.
Following from this reasoning, many programs have been launched to expose girls to female role models in the sciences. The programs include presentations to middle school and high school girls, camps for girls, and websites targeted at encouraging girls (Cheryan et al., 2013). Many of the initiatives involve one-time exposure to a female role model. As scientists, we must ask: Are these programs effective? Many are not evaluated rigorously, so it is difficult to tell. But if the interventions were effective, we would have seen an increase in women in CEP majors and jobs over the last 10 to 15 years and we haven’t, so there is reason to suspect that these well-intentioned efforts are not working.
One of the flaws in these interventions may be that they expose girls to stereotypical role models, and girls (and many boys as well) are turned off by those role models, not by the field itself. For example, computer scientists are stereotyped as being socially awkward, lacking in relationship skills, and obsessed with technology (Cheryan et al., 2013). In one study, undergraduate women who were not computer science majors met a role model who they were told was a computer science major. With a 2-by-2 experimental design, the role model was either a man or a woman and was either stereotypical for computer science or not stereotypical. The stereotypical role model reported hobbies such as video games, watching anime, and programming, and favorite magazine as Electronic Gaming Monthly. The nonstereotypical role model reported hobbies such as playing sports, hanging out with friends, and listening to music, and favorite magazine as Rolling Stone. After the participant and role model interacted, the participant completed a number of rating scales; they also completed the scales again 2 weeks later. The results indicated that exposure to the stereotypical role model reduced women’s interest in computer science and their sense of belonging in the field, and the effects lasted for 2 weeks. Interestingly, gender of the role model made no difference—it was the stereotypicality that had the effect.
Overall, then, women may be less interested in CEP fields in part because they do not see women in those fields, but also because of unattractive stereotypes about people who work in the fields, regardless of gender. This research also connects to the lack-of-interest explanation described earlier.
Self-expressive value systems:
This explanation puts the underrepresentation of women in CEP into a cultural, cross-national context. In the United States, we believe that you should work at a job that you love and feel passionate about. This approach is termed a self-expressive value system (Charles & Bradley, 2009). In a global context, that’s a very privileged approach. In many other, less wealthy nations, the goal is to find a job that will support you (and your family). Love for the work would be a remote luxury.
In a study of 44 nations, the results indicated that there was actually more gender segregation in the workforce in the more economically developed nations (Charles & Bradley, 2009). That is, women were in more gender-stereotypical occupations in wealthier nations than in less wealthy nations. For example, women are found more often in engineering in Bulgaria and Colombia than they are in the United States and Canada. Engineering pays well, and in nations such as Bulgaria and Colombia, pay and job security may be far more important than whether you find it interesting or you love it.
Ironically, our American emphasis on individual preferences and finding a job that you love may be a factor in keeping women in traditional, female-dominated jobs and out of CEP jobs.
Stereotypic attribution bias:
How do we explain setbacks that a person may experience in their career? To what do we attribute the setback? When people are told about a situation in which a woman has a setback in a STEM field, they tend to attribute it to internal causes such as her lack of ability; when people hear about a man encountering a setback in a STEM field, they tend to attribute it to external factors such as not getting enough sleep (LaCrosse et al., 2016). The problem is that the internal attributions imply that the woman is probably not going to make it in STEM (she just doesn’t have the ability), whereas the external attributions for men mean that they can make it; they just have to try again. This attribution bias can be held both by women in STEM fields and by powerful others in their environment. If a woman in a STEM field has this bias, she is likely to give up on STEM when she encounters a setback—and everyone encounters setbacks. And if powerful others, such as her graduate school adviser or her boss, have this attribution bias, if she has a setback, they are likely to believe that she won’t be successful in STEM. These attribution biases need to be identified and questioned.
The belief in geniuses:
In some fields, the top people are considered geniuses. We think of math geniuses, for example, but perhaps not biology geniuses. Women are underrepresented in the “brilliance-required” STEM fields: math and physics. There is another field in which women are seriously underrepresented, and it is in the humanities: philosophy. Interestingly, it is also a field in which there is a belief that brilliance or genius is necessary for success. One study found that the belief in field-specific brilliance among people in the field correlated, across 30 fields, with female representation in the fields, and the correlation was substantial and negative, r = –0.60 (Leslie et al., 2015). That is, the more that people in the field believe that brilliance (raw, innate talent) is required in their field, the smaller the number of women. This same study also found a substantial negative correlation between beliefs in brilliance in fields and African Americans’ representation. Just as women are stereotyped as not brilliant, so, too, are African Americans.
Distressingly, these stereotypes about gender and brilliance appear early. At age 6, girls are less likely than boys to believe that members of their gender are “really, really smart” (Bian et al., 2017).
This “brilliance required” effect might reduce the representation of women in those fields in two ways. First, it might discourage women themselves from entering the field, because women are less likely to see themselves as brilliant geniuses than men are. Second, powerful people in the field may not encourage aspiring women students because the powerful people believe that women don’t have the necessary brilliance.
Which explanation is correct? The answer is that probably all of these factors play a role except the belief that women can’t do math, which isn’t supported by the data showing gender similarities in math performance. The cumulative effects of all these factors can produce big effects. And it may be that some women, along their career paths, encounter one or several of these obstacles and other women encounter others.
An Intersectional Approach to the Gender Gap in STEM
Much of the research on gender and STEM has been done with college samples, and therefore with mainly White samples. Let’s consider the intersection of gender and ethnicity. Are the same gender–STEM patterns found with other ethnic groups? In one large study of college students across multiple universities, African American women had a higher rate of participation in STEM majors than European American women did (O’Brien et al., 2015). In another study, implicit stereotypes about gender and STEM were weaker among African American college women than they were among European American college women (O’Brien et al., 2015). We need research of this type with other U.S. ethnic groups, but the study suggests that some of our thinking about gender and STEM could be limited to Whites.
Interventions to Close Gaps in STEM
Based on research and theories, social psychologists have pioneered a number of interventions designed to close gender gaps, as well as race and social class gaps, in STEM fields. Here we will consider two categories of interventions: values affirmation and utility value.
One set of interventions is based in stereotype threat theory (discussed in Chapter 3). These interventions are called values affirmation interventions and are based on the idea that if an underrepresented or at-risk group feels threatened about underperforming in an academic setting, that sense of threat can be offset by having the students affirm their own personal values through writing assignments (Lazowski & Hulleman, 2016). In one study on gender gaps, students in a college physics course were randomly assigned to the affirmation condition or control (Miyake et al., 2010). Those in the affirmation condition selected their most important values from a list provided by the researchers (e.g., relationships with friends and family, gaining knowledge) and wrote an essay about why those values were important to them. They repeated the exercise again 2 weeks later. Those in the control group wrote an essay about their least important value. On exam scores in the physics course, the gender gap in the control condition was substantial, with men performing better (d = 0.93); in the affirmation condition, the gender gap was small (d = 0.18). That is, the intervention was successful in reducing the gender gap in performance in a college physics class. It also suggests that stereotype threat is a major factor in producing the gender gap in physics.
Another approach is based in Eccles’s expectancy-value theory, discussed earlier in this chapter. The interventions, called utility-value interventions, tackle the value part of expectancy-value theory. The idea is that, by writing about the utility value or usefulness of the material they are studying, students will become more motivated (Lazowski & Hulleman, 2016). One study focused on social class and race gaps in performance in a college biology course (Harackiewicz et al., 2016). The social class gap refers to the gap in performance between first-generation college students (FG; neither parent has a college degree) and continuing-generation college students (at least one parent has a college degree). The race gap refers to the gap in performance between White students and those who are from underrepresented minority groups (URM: African American, Latinx, and American Indian). Students in the utility-value condition wrote essays about the relevance or usefulness of course material, whereas those in the control condition wrote essays simply summarizing the material. In the control condition, the gap between FG-URM students and continuing-generation White students was large (d = 0.98). The good news is that the intervention reduced the gap substantially, by 61%. Why didn’t the intervention erase the gap completely? Doubtless there are many other factors that contribute to the gap in performance between FG-URM students and continuing-generation majority students, such as high school quality and preparation. We may not be able to close these gaps completely by the time students reach college, but we can at least reduce the size of the gap and help more students be successful.
Overall, then, researchers can use theories such as stereotype threat (Chapter 3) and expectancy-value (this chapter) to design interventions to close gender gaps in STEM as well as race and social class gaps.
Experience the Research: Gender and Computers
This exercise has two parts:
- Visit a local store that sells computer games. Examine 10 games that are currently being sold. Based on the information on the packages and what you know about the games, classify each game as male oriented, female oriented, or neutral. To do this, you will have to specify your criteria for each of these categories. For example, you might decide that any game that involves violence is male oriented. Or you might say that any game that has only boys on the packaging is male oriented. Specify your criteria clearly and write them down. If there is not enough information on the package to classify a game, ask a salesperson in the store to give you more details about it.
Overall, what were your findings? What percentage of the games were male oriented? Female oriented? Neutral? What are the implications of your findings?
- Find out whether the local high school has an after-school computer lab. If it does, visit the lab twice to make observations. On each occasion, count the number of male-appearing students, female-appearing students, and trans-appearing students who are there. Next, observe the computer activity in which each student is engaging, such as playing a game (what kind of game?) or programming.
Do the boys’ computer activities differ systematically from the girls’? What about the trans-appearing students? Do there seem to be power dynamics in the lab, with some people dominating over others? What is the gender pattern of those power dynamics?
Chapter Summary
There are no gender differences in general intelligence. When we look at more specific abilities, we find no gender difference in verbal ability or mathematical ability, but a moderate gender difference favoring boys and men in 3-D spatial ability. Some aspects of athletic performance show large gender difference beginning in puberty.
Eccles’s expectancy-value theory posits that, to be motivated to take on a challenging task (for example, majoring in engineering in college), a person needs to have an expectancy of success and needs to value the task (for example, seeing it as useful or interesting). The expectancies and values that a person has about a particular task are, in turn, shaped by many forces, such as socializers’ beliefs and feedback that the student has received in the form of standardized test scores or grades in school. Gender may enter into any of these processes. For example, parents have higher expectancies of math scores for sons than for daughters.
For school achievement, girls get better grades than boys at all grade levels and in all subjects. Some of these patterns of similarities and differences vary by ethnic group in an intersectional analysis.
For occupational achievement, women have gained much in the last several decades in entry into some prestigious occupations such as medicine, veterinary medicine, and law. However, women remain a small minority in engineering.
There is a gender gap in STEM, particularly in computer science, engineering, and physics, where women are seriously underrepresented. Explanations for the gap include women lacking interest, women being unable to do the necessary math (not supported by the data), hostile environments and discrimination in these fields, lack of role models, self-expressive value systems, stereotypic attribution bias, and the belief in geniuses combined with the belief that geniuses are men.
Suggestion for Further Reading
Rivers, Caryl, & Barnett, Rosalind C. (2015). The new soft war on women: How the myth of female ascendance is hurting women, men—and our economy. New York, NY: Penguin. Journalist Rivers and psychology researcher Barnett team up to document the subtle biases and barriers to women that persist, despite the great strides that women have made in recent decades.