This chapters touches on the debugging options offered in ABAP. The ABAP Debugger, as the name suggests, will help you debug code. This chapter explains all the options available in both the new and classic versions of this tool. We’ll also briefly look at the new AMDP Debugger.
17 Debugging
A debugger is an invaluable tool for any programming environment. Whereas the syntax checker helps identify any syntax or static errors, the debugger helps you to identify any logical errors. Sometimes, it’s impossible to detect logical errors without debugging. Having good debugging skills helps you to troubleshoot many problems with application programs.
Debugging helps you to analyze program flow for a specific scenario and analyze program execution. Using a debugger, you can stop at a particular point in the program execution and analyze the system status, the contents of the data objects, and so on. The debugger is a program tool that allows you to execute a program systematically and analyze the system status at each step to troubleshoot problems with the program.
If you’re a beginner to ABAP, a debugger can be your best friend when it comes to understanding ABAP programming; it allows you to examine your programs step by step, which in turn can help you understand how each statement behaves and the functionality it offers. The more comfortable you are with ABAP, the better you become at debugging programs to troubleshoot problems. If you’re an intermediate to advanced ABAP user, the debugger is still an immensely helpful tool to ensure error-free code.
SAP offers two debugging tool versions: (1) the old debugger, called the Classic Debugger, which was available for releases earlier than SAP NetWeaver AS ABAP 6.40, and (2) the New Debugger, released with SAP NetWeaver AS ABAP 6.40. As you may expect, the New Debugger offers many more features than the Classic Debugger.
If you’re a beginner, you may find the New Debugger overwhelming, so we’ll start our discussion in this chapter with the Classic Debugger and then look at all the new features offered by the New Debugger. However, SAP is phasing out the Classic Debugger, and as of SAP NetWeaver 7.5, the Classic Debugger has been declared obsolete. It’s no longer possible to set the Classic Debugger as the default debugger, and we recommend using the New Debugger, which is the default debugger. The major difference between the two debuggers is that the Classic Debugger loads in the same session as the program, whereas the New Debugger uses a two-process architecture so that it’s loaded in a new session. The New Debugger also offers a customizable user interface with many new tools.
In Section 17.1, we’ll begin by looking at the Classic Debugger features, which are similar to the New Debugger features. Specifically, we’ll discuss how to activate and use the Classic Debugger and discuss the different types of views and additional features available.
Section 17.2 will then touch on the features offered in the New Debugger, including its UI and tools. From there, in Section 17.3, we’ll discuss a new debugger tool as of SAP NetWeaver 7.5: the ABAP Managed Database Procedures (AMDP) Debugger.
In Section 17.4 and Section 17.5, we end the chapter by looking at how the debugging tools can enable to troubleshoot code and identify important concepts.
17.1 Classic Debugger
To understand the various features of the Classic Debugger, let’s work with an example that sets up a problem and see how to go about troubleshooting the problem using this tool. For the example, assume a report isn’t showing the expected output, and you want to debug the program to figure out where things are going wrong.
In this section, we’ll begin by looking at how to activate and use the Classic Debugger.
17.1.1 Activating and Using the Classic Debugger
The Classical Debugger can be activated by changing the user settings. From any ABAP Workbench tool, such as ABAP Editor (Transaction SE38), use the menu path Utilities • Settings; under the ABAP Editor tab, select the Debugging subtab, as shown in Figure 17.1.
Here, you can select the Classic Debugger radio button under the ABAP Debugger section. Once the setting is changed, the system will call the Classic Debugger by default. Note that this setting is no longer possible to set in SAP NetWeaver 7.5.
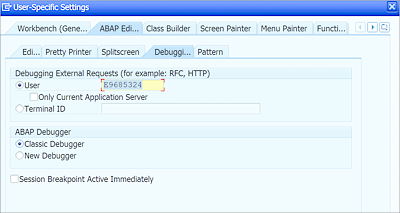
Figure 17.1 Setting Classic Debugger
Now that we’ve activated the Classic Debugger tool, let’s look at the debugging process.
The first step to debugging is to identify from which point in the program flow you want to start debugging. Do you want to start debugging from the beginning of the program or from a specific point in the program? For example, if you’re not seeing the expected output for your report program, you may want to start by troubleshooting the data selection logic. If your program has logic for selection screen validations, which typically occurs before data selection, you may want to skip debugging all of the selection screen logic and jump directly to the selection logic. So, in this case, our starting point will be the selection logic.
Once you identify the starting point, you need to set a breakpoint in the code. A breakpoint stops the program execution and calls the debugger. There are two types of breakpoints you can set:
-
Session breakpoint
A session breakpoint is triggered when the program is executed from with the SAP GUI session. -
External breakpoint
The external breakpoint is triggered when the program is called externally from a different system. This is useful when you want to debug, say, RFC or Web Dynpro ABAP, when they’re called from external applications.
To set a breakpoint, keep your cursor on the statement and click the Session Breakpoint button in the application toolbar, as shown in Figure 17.2. Alternatively, you can double-click in the first column of ABAP Editor to set a breakpoint. Repeat the same process to delete the breakpoint. The program should be in an active status to set a breakpoint. If the program is not active, activate the program first before setting the breakpoint.
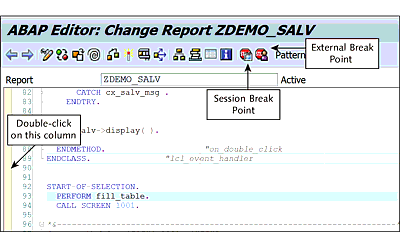
Figure 17.2 Setting Breakpoint
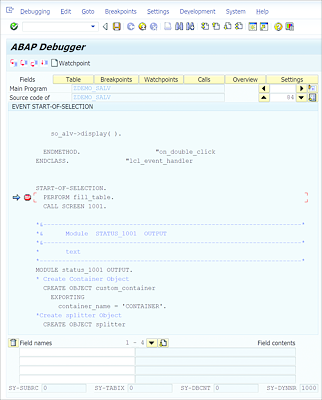
Once the breakpoint is set, execute the program; the debugger will automatically load when the program reaches the breakpoint location during program execution. When you’re in debug mode, you can set new breakpoints or delete existing breakpoints by double-clicking at the beginning of the line. Click the Save button in the standard toolbar to save the new breakpoints. The Classic Debugger should now look similar to Figure 17.3.
The top section of the debugger provides various options, as shown in Figure 17.4. Here, you have the option to execute the code step by step, switch to different views, create watchpoints, and scroll through the debugger window. A watchpoint allows you to stop the program execution when a field contains a specific value. Watchpoints are useful for debugging based on a field value as opposed to a specific ABAP statement.
The different views on the debugger screen allow you to check information while debugging; you’ll learn more about these views in the following subsections. The execution steps allow you to execute the code step by step to troubleshoot issues. The horizontal and vertical scrolling buttons allow you to scroll through the debugger window. The debugger window also displays the program and subprogram name that you’re currently debugging.
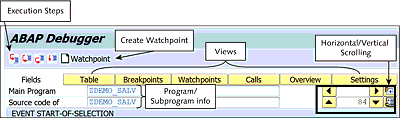
Figure 17.4 Debugger: Top Area
There are four ways to execute the code in debug mode:
-
Single Step (Press (F5))
This will execute the code line by line. Use this if you want to execute each statement, one-by-one. -
Execute (Press (F6))
This will execute the complete processing block and go to the next statement after the call location if used at the processing block call location. For example, if you press (F6) at the PERFORM statement or CALL FUNCTION statement, the debugger will execute the subroutine or function module completely without going inside the block. This is useful if you don’t want to check the execution of a processing block and skip to the next statement after the call location. If (F6) is used at any location except a processing block call, it will behave similarly to Single Step and execute each line, one-by-one. -
Return (Press (F7))
This option will exit the processing block if used inside a processing block. For example, if you’ve entered a processing block by pressing (F5) and after executing a few lines you realize you want exit the processing block because you don’t want to analyze further code, you can press (F7) to leave the processing block and go back to the statement immediately after the call location. -
Run (Press (F8))
This will go to the next breakpoint or complete the program execution if no further breakpoints are set.
The Classic Debugger screen provides different views, which we’ll discuss in the following subsections.
17.1.2 Field View
In the field view, you can assess the contents of different fields. At the bottom of the debugger screen, this view shows two columns, as in Figure 17.5.
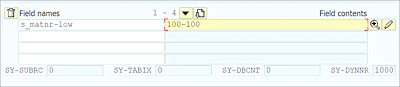
Figure 17.5 Checking Field Contents
You can double-click a field name to copy it to the Field Names column and see the field contents in the Field Contents column. You can also manually type a field name in the Field Names column. Double-clicking a field name will show the technical attributes of the field. If the field is a structure, it will show the contents of the structure.
Clicking on the pencil icon at the end of the row will allow you to change the contents of the field. For example, if you want to test for a particular value, you can dynamically change the field contents in debug mode by clicking the pencil icon.
At the bottom of the screen, you can see the contents of certain system fields. This will help you quickly assess the status, such as if the SELECT was successful (SY-SUBRC), or check the number of rows fetched from the database after the SELECT was executed (SY-DBCNT).
17.1.3 Table View
The table view allows you to check the contents of internal tables, as shown in Figure 17.6. Double-click a line number to see the complete line. You can use the horizontal scrolling buttons at the top of the debugger to scroll horizontally in the table. Also, you can check a single row of a table by using the index number within square braces; for example, it_mara[3] will display the third row of an internal table like a structure.
The Change, Insert, Append, and Delete buttons will allow you to change the contents of a row, insert a new row, append a new row, or delete a row, respectively. The plus icon in the top-right corner in Figure 17.6 will expand the table view vertically.
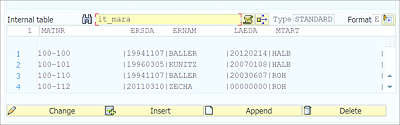
Figure 17.6 Table Contents
17.1.4 Breakpoints View
The breakpoints view (see Figure 17.7) allows you to see all the breakpoints of the program. You can delete any breakpoint by double-clicking the breakpoint symbol to the left of the respective line.
17.1.5 Watchpoints View
The watchpoints view lists all the watchpoints set for the debugging session. Watchpoints allow you to interrupt the program execution when a particular field is updated with a specific value.
For example, say you want to debug the code within an internal table loop when a particular row is copied to the work area. In such a case, you can create a watchpoint to monitor the work area. When the work area is updated with the value, the program execution stops and waits for your interaction.
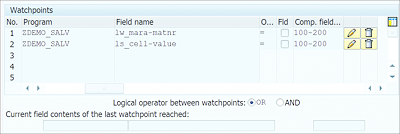
To create a watchpoint, click the Create Watchpoint button at the top of the debugger screen (refer back to Figure 17.4). This will open the Create/Change Watchpoint dialog box, in which you can provide information about the field that you want to monitor and the value, as shown in Figure 17.8.
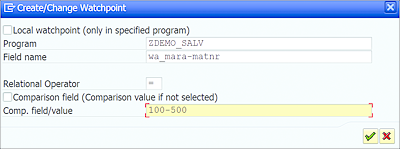
Figure 17.8 Creating Watchpoint
You can create multiple watchpoints and select the logical operator between the watchpoints as an OR condition or an AND condition, as shown in Figure 17.9. Clicking the pencil icon allows you to edit a watchpoint, and clicking the Delete icon allows you to delete a watchpoint.
Once the watchpoint is set, press (F8) and the system will automatically stop at the next breakpoint or when the watchpoint is reached. Watchpoints are useful when you want to troubleshoot based on field values rather than program flow.
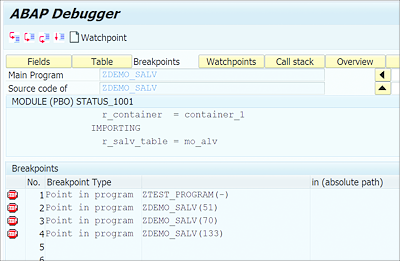
17.1.6 Calls View
The calls view provides information about the complete call stack of the session. This allows you to check all the programs loaded in the call stack, as shown in Figure 17.10.
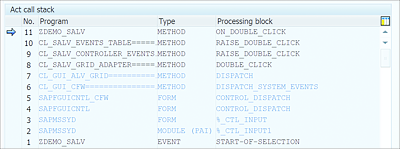
This view is useful if you want to check all the programs that are loaded into the session while your program is running. Checking the call stack allows you to verify if an expected procedure is loaded or ignored during program execution.
17.1.7 Overview View
The overview view lists all the processing blocks of the current main program, with an arrow pointing to the processing block that is being executed currently, as shown in Figure 17.11. This view allows you to quickly identify the current processing block being executed.
17.1.8 Settings View
The settings view allows you to change the debugger settings and system behavior. There are various settings that can be changed, as shown in Figure 17.12. You can learn more about these settings by referring to the SAP Help documentation at https://help.sap.com/saphelp_erp60_sp/helpdata/en/c6/617d0ce68c11d2b2ab080009b43351/content.htm.
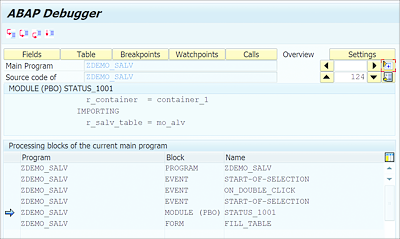
Figure 17.11 Overview View
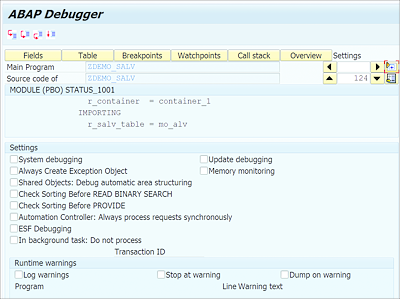
Figure 17.12 Classic Debugger Settings
17.1.9 Additional Features
The menu bar of the debugger screen offers addition features, as shown in Figure 17.13. Under the debugging menu, you can select Control • Goto Statement to jump to a specific cursor position. For example, if you’ve executed a statement and want to jump back and execute the statement again, you can keep the cursor on the statement and follow the menu path Debugging • Control • Goto Statement, as shown in Figure 17.13. From this menu, you can also choose Switch to New ABAP Debugger.

Figure 17.13 Jumping to Statement
You can select Debugging • Debugging off to turn off debugging and complete the program execution. This will complete the program execution without stopping at any additional breakpoints.
You can select Debugging • Restart to terminate the program execution. This is useful, for example, if you’ve changed any values in debug mode and don’t want the program to update those values in the database.
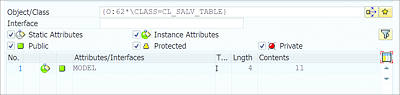
The GoTo menu offers certain interesting options. Select GoTo • Display Data Object to load different data object views and see various data objects. For example, selecting GoTo • Display Data Object • Object will open a view in which you can analyze the contents of an object, as shown in Figure 17.14. This object view provides certain specific options to check the contents of the object. For example, you can filter based on the visibility section or display only static attributes or instance attributes of the object.
Following the menu path GoTo • Status Display • Memory Consumption allows you to check the memory consumption of the program. Meanwhile, following the menu path Breakpoints • Breakpoint At allows you to set a breakpoint when a particular statement is executed, a function module is called, and so on, as shown in Figure 17.15. This option is particularly useful when debugging long programs.
For example, if you’re getting a runtime error and want to debug what’s causing the runtime error or check the status of the program before the exception is triggered, you can check the short dump to identify the statement causing the exception; once you’re in debug mode, select the menu Breakpoints • Breakpoint At • Statement to enter the statement at which you want to set the breakpoint. Then, the system will stop each time that statement is called. You can use the same Breakpoints • Breakpoint At menu to quickly stop at a particular Function Module or Method call.
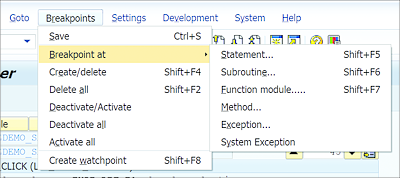
Figure 17.15 Setting Breakpoint at Particular Call
Another menu option worth mentioning is the option to activate system debugging, which allows you to debug system programs (programs of TYPE s). For example, say you’re debugging a program and come across a function module call, as shown in Figure 17.16.
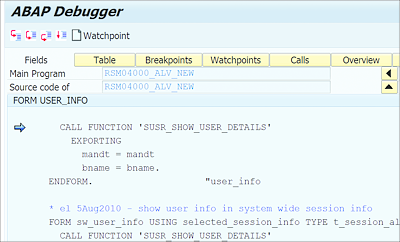
Figure 17.16 Debugging System Program
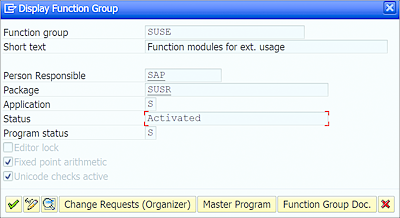
The SUSR_SHOW_USER_DETAILS function module shown in Figure 17.16 belongs to a function group for which the Program Status is set to system program (type S), as shown in Figure 17.17. If you press (F5) at this function module call, the debugger won’t enter the function module. To enter the function module, you first need to activate system debugging. To do so, follow the menu path Settings • System Debugging. It’s turned off by default to allow you to skip debugging system programs, which usually don’t pose any issues.
Other than keeping a breakpoint in the program source code, you also can activate the debugger by typing /H in the command bar of the screen. This option is useful if you want to start debugging from the PAI of a certain screen of the application. For example, say you want to analyze the code called when you select a particular button on the screen. Going through the source code to identify the code called for the button action is cumbersome. You easily can avoid manually looking through the source code by activating debugging for the screen and performing the action for which you want to examine the program execution.
Sometimes, you may want to activate debugging for modal dialog windows. Because these windows don’t have a command bar, you can’t use /H to activate the debugger for such windows. To activate the debugger for dialog windows without a command bar, you can create a shortcut for the /H command and then drag and drop this shortcut onto the dialog window. To create a shortcut, click the Generate Shortcut icon in the standard toolbar of any screen. This will open a dialog window, as shown in Figure 17.18.
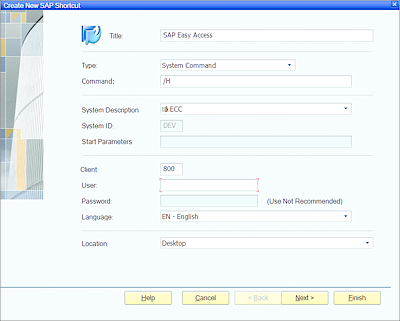
Under Type, select System Command and enter “/H” in the Command field. For Location, select Desktop and then click Finish. This will create a shortcut on your desktop. You can drag and drop this shortcut onto any modal dialog box to turn on debugging for the window.