17.2 New Debugger
The Classic Debugger loads in the same session as the program. This poses certain technical challenges for debugging ABAP programs. This also restricts developing a new UI design for the debugger. To overcome such challenges, SAP introduced the New Debugger.
In the following sections, we’ll look at the UI and tools offered with the New Debugger that differ from the Classic Debugger. We’ll also look at the overall layout and the use of sessions.
17.2.1 UI and Tools
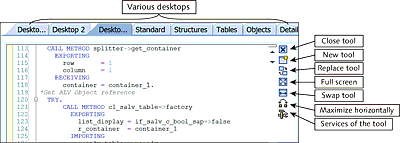
The New Debugger provides a feature-rich UI that can be customized to display up to four tools in a desktop. Figure 17.19 shows the New Debugger with the UI customized to display different tools. One tool shows the source code, another tool shows an internal table, the third tool shows an object, and the fourth tool shows variables.
Each tab is called a desktop in the New Debugger, and there are twelve total desktops, with each desktop capable of displaying four tools. Each tool has its own options, as shown in Figure 17.20. Using the available options for the tool, you can load new tools in the desktop, replace the tool, swap the tool, maximize the tool, and so on. There are also specific services for the tool that can be accessed using the Services of the Tool icon.

Figure 17.19 New ABAP Debugger
Selecting the New Tool option opens a window, as shown in Figure 17.21. As you can see, the New Debugger provides wider tool support than the Classic Debugger. It also provides some special tools—for example, a tool to debug Web Dynpro applications. Select any tool from the New Tool window to add it to the desktop.
The process to run through the code and analyze data objects is similar to that for the Classic Debugger (using (F5) to (F8) function keys, as discussed in Section 17.1.1). Compared to the Classic Debugger, the Create Watchpoint window, apart from variables, allows you to set watchpoints to monitor changes to object attributes.
Following the menu path Miscellaneous • Debugger Tips will lead you to various tips to use the New Debugger. We recommend that you go through all the tips to feel comfortable using the New Debugger.
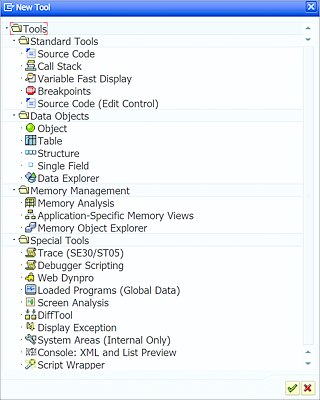
Figure 17.21 New Debugger Tools
17.2.2 Layout and Sessions
You can save the layout of the New Debugger via the menu path Debugger • Debugger Session • Save Layout (see Figure 17.22). This option is useful if you customized the desktop layout with different tools and want to use the result as your default layout.
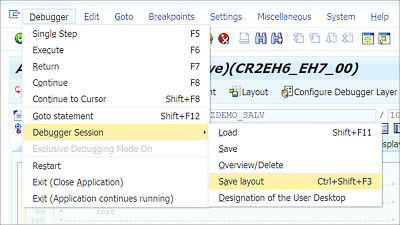
Figure 17.22 Save Layout
You can save the current debugging session via the menu path Debugger • Debugger Session • Save. This will open the Save Current Debugging Session window, as shown in Figure 17.23. You can save the current debug session to a file or to database by selecting the relevant radio button and providing a name for the session. Optionally, you can also add a comment to easily identify a saved session.
Different components of the session, such as layout, breakpoints, watchpoints, settings, options and variables, can be saved (see Figure 17.23). You can load a saved session via the menu path Debugger • Debugger Session • Load, view the saved sessions and delete them via the menu path Debugger • Debugger Session • Overview/Delete, and change the names of the desktop tabs via the menu path Debugger • Debugger Session • Designation of the User Desktop.
Because the New Debugger opens in a new session, when the application being debugged becomes ready for input, the external debugger session remains open and the application screen is presented to the user for input. If any further breakpoint is reached, the debugger loads automatically. This ensures that the debugger doesn’t lose any layout changes or tool arrangements set previously.
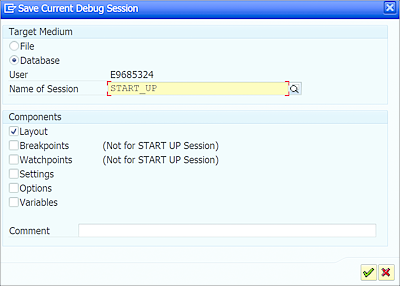
Figure 17.23 Save Current Debug Session
To close the external debugger session when the control is returned to the application, use the /hx command in the command bar of the application screen. The debugger can be turned on from any transaction screen using the /h command in the command bar of the SAP GUI screen.