
INTELLIGENCE
The topic of intelligence can generate strong feelings. Specifically, the idea that there is one monolithic kind of intelligence that is reflected by a single number plotted on a bell-shaped curve is hard to accept. Can one number determine a person’s life? Other variables such as interpersonal skill, emotional resilience, creativity, and motivation are factors independent of intelligence, which are critical for success in a career or in life. Likewise, a person can show great aptitude in one area, yet struggle in another. Having said that, it is important to acknowledge there is considerable evidence of a general mental ability called intelligence, which has a predictive value.
It has been shown that all credible tests of mental ability rank individuals in about the same way; that is, people who do well on one type of test tend to do well on the others and vice versa. Such tests (e.g., the Wechsler Intelligence Scale, which gives an IQ score) are believed to measure some global element of intellectual ability. This global element is called “g” or fluid intelligence; g is conceptualized as reasoning and novel problem-solving ability. Others have described it as the ability to deal with complexity. There is no pure measure of g. An IQ score is an approximation of g.
Some argue that g is only useful to predict academic success or success in situations that resemble school. Arguing against this, others point to data showing the predictive correlates between IQ and employment, marriage, incarceration, and income. From our standpoint, we are interested in the associations between g and the neural substrate of the brain.
Genetics
Before we delve into the neuroscience of intelligence, it is worth discussing some compelling studies on the heritability of cognitive skills. The Colorado Adoption Project that started in 1975 followed up 200 adopted children from childhood through adolescence. They compared the cognitive ability of the children with their adoptive parents and their biologic parents. A control group of children raised by their biologic parents was included for comparison.
Figure 19.1 shows the correlations for verbal and spatial abilities over time between the children and the parents. Note how the adopted children have almost zero correlation between them and their adopted parents. Their cognitive skills more closely match their biologic parents. Another finding of interest is that the correlations improve with age. We become more like our biologic parents as we age—at least with regard to intelligence.
Brain Size
A consistent finding in neuroscience has been the association between brain size and intelligence; that is, all other things being equal, bigger brains really are better. Nottebohm in his work with songbirds found a noteworthy example. The reader will remember that male songbirds have an enlarged high vocal center (HVC), which plays an essential role in his song production. Nottebohm meticulously recorded the diversity of song syllables that each bird produced and then compared this with the size of his HVC. The results are plotted in Figure 19.2 and show a robust correlation.
An extensive song repertoire is not the same as reasoning and problem solving. It is probably closer to having a large fund of knowledge (sometimes called crystalline intelligence). However, for our purposes, it shows an association between brain size and a learned task.
With humans, there is a long history of studies comparing brain size and intelligence. In the early days, they would simply compare head circumference (hat size) with rough estimates of intelligence. However, there is more to intelligence than just brain size, otherwise whales and elephants would have ruled the world. The important variable is the relative size of the brain to the size of the body.

FIGURE 19.1  The correlation between children and their biologic parents increases with age for verbal and spatial abilities. The shared environment between adopted children and their parents had little effect on verbal or spatial intelligence scores. (Adapted from Plomin R, DeFries JC. The genetics of cognitive abilities and disabilities. Sci Am. 1998;278(5):62-69.)
The Smartest Animal
Why are humans so smart? Or, to put this another way, what features of the human brain distinguish it from the brains of other mammals? If we are so much smarter, one would think it would be easy to spot the differences between our brains and that of our closest animal relatives. Unfortunately, it is hard to find anatomic correlates that explain the significant leap in intelligence we see in humans.
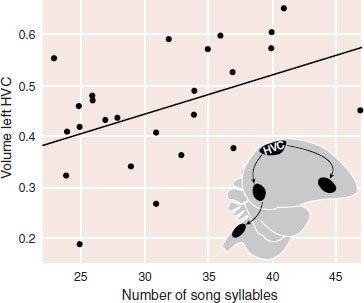
FIGURE 19.2  Adult male canaries with a large repertoire of song syllables also tend to have a large high vocal center (HVC), while those with small repertoire have a small HVC. (Adapted from Nottebohm F. The road we travelled: discovery, choreography, and significance of brain replaceable neurons. Ann N Y Acad Sci. 2004;1016:628-658.)
There are several variables that have been suggested such as brain size, relative brain weight, or number of cortical neurons, but for almost every variable there is some species that exceeds or is at least equal to humans. A cat has more cortical neurons relative to brain weight than humans and dolphins have almost the same relative brain weight compared with body weight as humans. Cats and dolphins are smart animals, but they cannot design a house, write a play, or solve algebra problems.
There is no single variable that marks the superior human intelligence. The explanation appears to be a combination of relative size and speed of communication:
• Relatively large brain compared with body weight
• Large number of cortical neurons
• Numerous synaptic connections
• Thick, fast axons that transmit signals quickly
• Short distance between neurons
In other words, humans have more cortical neurons with faster conduction velocities that make more connections than elephants, dolphins, or the other great apes.
Our superior intelligence is often attributed to our large prefrontal cortex (PFC)—the locus of executive function. However, comparative studies have found the proportional human PFC to be in line with that of the great apes and maybe smaller than that in elephants and whales. A better explanation may the proportion of white matter to gray matter in the frontal cortex. Recent magnetic resonance imaging (MRI) studies on humans and other primates compared the relative volumes of white and gray matter in the PFC. The largest difference was found with the PFC white matter (Figure 19.3). The authors suggested that this difference might be a measure of “connectional elaboration.” They postulate that the superior cognitive skills in humans could be a result of more and faster connections, not just more neurons.
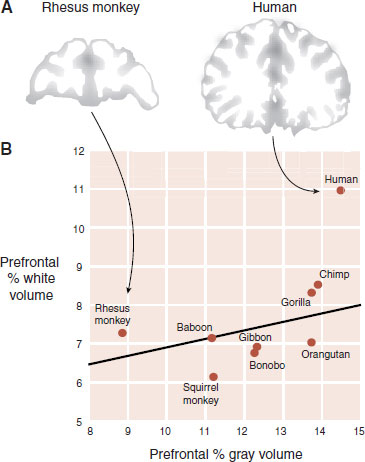
FIGURE 19.3  Gray and white matter comparisons in the prefrontal cortex (PFC) for rhesus monkeys and humans (A). The proportion of white matter in the PFC (compared with total white matter) is larger for humans than other primates (B). (Adapted from Schoenemann PT, Sheehan MJ, Glotzer LD. Prefrontal white matter volume is disproportionately larger in humans than in other primates. Nat Neurosci. 2005;8(2):242-252.)
The Smartest Humans
Shortly after his death, Einstein’s brain was removed by a pathologist at the Princeton Hospital who assumed the world had to examine the brain of such a genius. Almost certainly this was not Einstein’s last wish. The journey of his brain since 1955 is an entertaining story, but not great science. Most remarkable is the unremarkable appearance of the brain of the man who first voiced the theory of relativity. Einstein’s brain is just one example of the difficulty of finding neuroanatomical correlates for intelligence.
Modern imaging studies allow the in vivo measurement of brain volume in multiple subjects. McDaniel conducted a meta-analysis of imaging studies comparing brain volume and intelligence. He identified 37 high-quality studies with a total of 1,530 people. The correlation between brain volume and intelligence across the studies was 0.33. In other words, differences in brain volume may explain some of the differences in IQ, but there is much more that remains unexplained.
Measurements of intelligence remain relatively stable over a person’s life span. Yet, we know that the brain is a dynamic organ with more remodeling capability than we could have imagined just a decade ago. Likewise, there is shrinking of the gray matter starting in adolescence. It is unclear how these fluctuations relate to intelligence.
Giedd et al. at the National Institute of Mental Health completed a longitudinal study of cortical thickness and intellectual ability from childhood through adolescence in more than 300 children. The most significant finding was that it was not the absolute thickness of the gray matter that correlated best with intelligence, but rather the rate of change. This was most prominent in the PFC. Figure 19.4 shows the cortical thickness for one location on the right superior frontal gyrus for subjects with superior intelligence and average intelligence. Note how those with superior intelligence have less gray matter when very young, which peaks later, and then shows a more rapid thinning compared with the average children.
These findings are not what were expected. Smart children do not simply have more gray matter. Rather, it is the dynamic properties (perhaps even efficient pruning of unneeded connections) of the cortical maturation that are somehow superior in intelligent children. The significance of this finding remains unclear, but suggests that refinement, not size is the hallmark of intelligence.
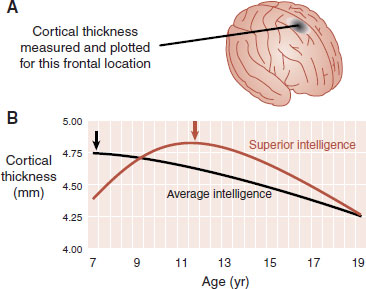
FIGURE 19.4  Measurements at the indicated point of the right superior frontal gyrus (A). Comparison of the cortical thickness at the point in (A) through adolescence for those with superior intelligence compared with those with average intelligence (B). (Adapted from Shaw P, Greenstein D, Lerch J, et al. Intellectual ability and cortical development in children and adolescents. Nature. 2006;440(7084):676-679.)
Parents and their teenage children provide an alternative way to examine the topic of intelligence. We would expect parents and children to have similar intellectual abilities, yet we would seek out the parents if we wanted advice and counsel—not the “know-it-all” teens. However, with almost every anatomical measure of the brain, the teen brain is superior: thickness of gray matter, number of neurons, and number of synaptic connections, for example. It does not make sense—the teens have more brain matter but the adults have more wisdom. The only brain structure that seems to correlate with adult wisdom is frontal lobe white matter, which peaks around 39 years of age (see Figure 8.8). This is further evidence that connectivity may be the secret to intelligence.
The study of patients with brain lesions has been a staple in neuroscience research since the days of Broca. Fortunately, we now have brain imaging capabilities and do not have to wait for patients to die to examine the lesions—which would be particularly problematic for the study of intelligence. A group in California scanned 241 patients with focal brain damage and looked for associations with general intelligence. They discovered a correlation with a “remarkably circumscribed” network in the frontal and parietal cortex including white matter tracts. The authors concluded, “that general intelligence draws on connections between regions that integrate verbal, visuospatial, working memory, and executive processes.”
In summary, the essence of intelligence in the brain remains a mystery. The studies mentioned above suggest that numerous neurons, densely packed, with rapid connections between the frontal cortex and other regions of the brain facilitate cognitive performance. More neurons, talking faster to each other, makes for a smarter brain.
Brilliance and Mental Illness
There is a popular belief in the association between “genius” and “madness”—a “fine line” it is often stated. Numerous books have been written on the topic, but these case studies are more anecdote than science. Prospective research is needed. A recent study out of Sweden sheds some much needed light on the issue.
Sweden’s social policies and national registries allow for the comparison of academic achievement with later psychiatric hospitalization. All students in Sweden are required to attend school until the summer in which they turn 16. Grades from the final year of compulsory education are normalized based on a national distribution and an average is calculated for each student. These scores were compared with psychiatric diagnoses for subsequent hospitalization. The results are shown in Figure 19.5.
It appears that exceptional academic achievement is a risk factor for bipolar disorder. For males with excellent grades, there was a fourfold increase in the risk of developing bipolar disorder compared with students with average grades. Students with the lowest grades had a modest (twofold) increased risk compared with average students. Schizophrenia, on the other hand, is uniformly associated with poor school performance and high grades are in fact protective.
The results lend some credence to the book entitled “Brilliant Madness,” which was coauthored by Patty Duke and in which she describes about her struggle with bipolar disorder. It certainly seems that activated bipolar patients are thinking too fast—racing thoughts is the clinical term. Are some racing thoughts advantageous? Is a little bit helpful for academic performance, but too much is called mental illness?
Performance Enhancement
There is considerable interest in medications or brain stimulation devices that could enhance cognitive performance. Pharmacologic or device interventions to increase problem-solving skills would be valuable tools in the treatment of such disorders as traumatic brain injury, Alzheimer’s disease, and schizophrenia. However, if they worked not only to reverse disease-related deficits but also to enhance healthy brains, there would be a large demand from people without disorders who seek to enhance their cognitive performance. The prospect of “lifestyle” medications for intelligence is worrisome, especially in a meritocracy such as ours where profession and income are largely dependent on school performance and intelligence as measured in school tests.
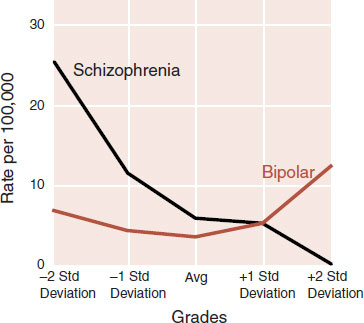
FIGURE 19.5  Students whose average grades at 16 were two standard deviations above the norm were more likely to develop bipolar disorder and less likely to develop schizophrenia. (Adapted from MacCabe JH, Lambe MP, Cnattingius S, et al. Excellent school performance at age 16 and risk of adult bipolar disorder: national cohort study. Br J Psychiatry. 2010;196:109-115.)
A recent prospective study reported an intriguing association between IQ at the age of 6 and posttraumatic stress disorder (PTSD) symptoms after trauma at the age of 17. Those children with an IQ of 115 or greater were only one-fifth as likely to develop PTSD as similarly traumatized children with an IQ of 100 or less. These results suggest that greater intelligence is in some way protective against the development of secondary anxiety.
Although there are no blockbuster treatments in the development pipeline, there are actually several products currently available. The best known agents are the stimulants such as the amphetamines and methylphenidate. Studies have repeatedly shown that these agents will improve cognitive skills in healthy subjects. For example, Figure 19.6 shows how methylphenidate decreased reaction times and errors of omission in healthy subjects in a dose-dependent manner.
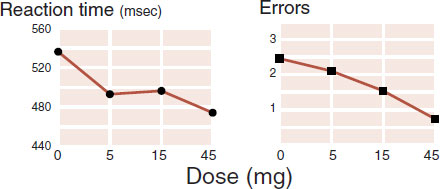
FIGURE 19.6  Healthy men (average age 22) displayed a dose-dependent improvement with methylphenidate, as measured on a continuous performance test. (Adapted from Cooper NJ, Keage H, Hermens D, et al. The dose-dependent effect of methylphenidate on performance, cognition and psychophysiology. J Integr Neurosci. 2005;4(1):123-144.)
DISORDER
ADHD
It is not uncommon in clinical practice for a parent to try out their child’s stimulant and experience a favorable response. The parent will conclude that they also have attention-deficit/hyperactivity disorder. Often such parents will present with a request for a prescription for themselves. However, improved productivity while taking methylphenidate or amphetamine is a normal response and does not constitute the presence of a disorder.
Surveys of college students have documented the abuse and misuse of the stimulant medications. Although the estimates vary widely, the practice appears to be common in US colleges. In general, students at more competitive universities, members of fraternities, and those with lower grades are at greater risk for misuse of the stimulants. But misuse is not limited to college students. A recent informal online survey by Nature readers found that 20% of the almost 1,500 respondents reported using performance-enhancing medications. The most common was methylphenidate at 62%.
Other pharmacologic agents are also known to enhance cognitive skills. Modafinil marketed for narcolepsy and excessive fatigue has been shown to improve cognitive performance in healthy subjects. Readily available agents such as caffeine and nicotine have also been shown to improve performance. Nature’s own performance-enhancing condition (hypomania) is well known to increase productivity (see Figure 19.12). In general, increased energy appears to be the common variable for improved cognitive performance.
DEFICITS
It is beyond the scope of this text to review all known cognitive deficits. However, two topics are worth discussing: mental retardation (MR) and dyslexia. Both have distinct abnormalities that give us greater understanding of the brain.
Mental Retardation
Dendritic Pathology
MR is a nonprogressive developmental disorder affecting global cognitive function. By definition, MR is characterized by an IQ of 70 or below (two standard deviations below the norm of 100). In the United States, this comprises approximately 1% to 2% of the population. There are numerous causes of MR, including genetic aberrations, toxin exposure in utero, and malnutrition.
FIGURE 19.7  Dendrites from a healthy child and one with mental retardation (MR), highlighting the abnormal spine morphology in the child with MR. (Adapted from Purpura DP. Dendritic spine “dysgenesis” and mental retardation. Science. 1974;186(4169):1126-1128.)
Severe forms of MR often have readily apparent structural abnormalities, for example, microcephaly. However, most subjects with MR show little, if any, obvious changes in brain anatomy. Their brains look roughly normal when examined with MRI. In the 1970s, researchers began postmortem examination of the brains of retarded children and discovered extensive dendritic spine abnormalities (Figure 19.7). Subsequent studies have found aberrant spine morphology and/or reduced dendritic branching as a consistent finding in MR in a variety of syndromes.
The importance of spine architecture for learning and memory has been discussed in several chapters in this book (e.g., see Figures 8.12, 12.13, 16.6, and 18.4). It is reasonable to assert that deficits in spine morphology impair the network connectivity essential for information processing. Likewise, there is only a short step to imagine that problems with information processing play a large role in the cognitive deficits of MR.
Deprivation
Deprivation in early infancy is a well-known cause of cognitive impairment. Studies on animals have established the lasting impact of early environmental impoverishment. The fall of the totalitarian government ruled by Nicolae Ceau escu in Romania in 1989 gave the world a group of unfortunate children who could be systematically studied to document the long-term effects of early deprivation.
Under the Ceau escu regime, orphaned children were raised in institutions under conditions of severe deprivation. When Romania was opened to the world by the new government, the shocking condition of these children was revealed. Most were severely malnourished, with significant developmental delays. European and American families responded by adopting many of these children.
It is assumed that most of these children were put into the institutions as very young babies. Consequently, the age at which they were adopted approximates the length of time they were raised in a deprived environment. Likewise, it is known that these children moved into enriched environments after adoption.
The cognitive skills of 131 of these adoptees have been studied and compared with 50 UK adoptees who were adopted before 6 months of age. IQ tests have been administered to all these children throughout their childhood. Significant improvements were seen during the assessments of 4-year-old and 6-year-old Romanian children. Many children displayed an encouraging “catch up” with the UK adoptees. Recently, the examination results of the 11-year-old Romanian adoptees were reported and are shown in Figure 19.8.
The figure highlights the profound and lasting effects of early institutional deprivation. Of particular interest is the dose–response relationship between IQ and the number of years spent in an impoverished environment. Children removed from deprivation before 6 months of age had almost no lasting impairment. However, those children who stayed in the institutions for more than 6 months had 20-point reductions compared with the UK adoptees. These results reiterate the work by Hubel and Wiesel regarding critical periods of development (see Figures 8.10 and 8.12).
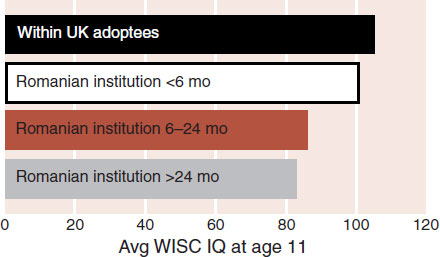
FIGURE 19.8  A dose–response effect is shown for different amounts of institutional deprivation on IQ at 11 years of age. WISC, Wechsler Intelligence Scale for Children. (Adapted from Beckett C, Maughan B, Rutter M, et al. Do the effects of early severe deprivation on cognition persist into early adolescence? Findings from the English and Romanian adoptees study. Child Dev. 2006;77(3):696-711.)
Unlike MR, dyslexia is a localized impairment. Classified as a learning disorder, dyslexia presents as an unexpected difficulty in reading in a person with otherwise normal intelligence and motivation. Dyslexia may be the most common neurobehavioral disorder in children. Estimates of the prevalence range from 5% to 17.5%.
While speech develops naturally, reading is an acquired skill. Children must learn that letters on a page represent the sounds of spoken language. Children with dyslexia have trouble decoding the letters into the sounds of words. Comprehension can be normal once the word is recognized, but sounding out the word is laborious. Reading is effortful and slow for such children. Additionally, the impairment does not spontaneously remit.
The Shaywitzs have been studying dyslexia for almost 20 years at Yale. In a large study, they examined 144 children (70 with dyslexia) using functional MRI (fMRI). The children read real words and pseudowords while being scanned. Figure 19.9 shows the difference in activity in the brains of the normal readers compared with those with dyslexia. Note the increased activity for normal readers at two regions in the left hemisphere: a frontal region and a temporal/occipital region. These regions are thought to be critical for analyzing written words.
In a remarkable application of their findings, Shaywitz et al. conducted a treatment study to see if the dormant regions in the dyslexic children could be awakened. Thirty-seven children, who were second or third graders, with dyslexia received 50 minutes of daily tutoring in their schools for 1 year. They focused on phonics: associating letters and combinations of letters with sounds. Children in the treatment group showed improved reading accuracy, fluency, and comprehension after 1 year.
Of particular interest were the results of the repeated fMRIs 1 year after the study ended (2 years after the start of the study). The baseline scans subtracted from the follow-up scans revealed regions activated in the intervening years. The newly activated regions (Figure 19.10) correspond to the same regions active in fluent readers: frontal and temporal/occipital. This study is further evidence that cognitive exercises can change the brain.
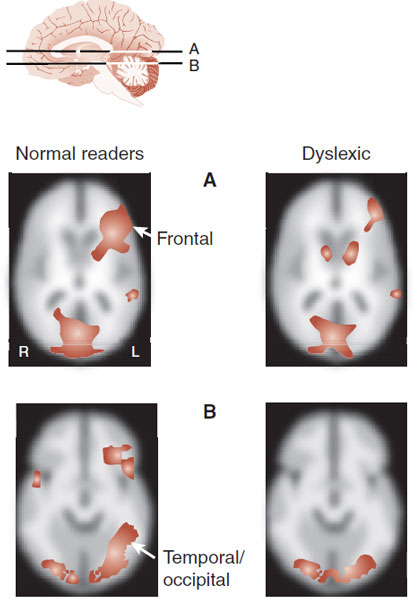
FIGURE 19.9  Children with dyslexia and healthy readers were scanned while reading. Normal readers showed greater activation of the frontal region as well as the temporal/occipital region. (Adapted from Shaywitz SE, Shaywitz BA. Dyslexia (specific reading disability). Biol Psychiatry. 2005;57(11):1301-1309.)
CREATIVITY
Creativity is conceptualized as the capacity to generate novel approaches to a problem. However, any fool can make a mess and call it art. The talent comes in producing something new that is meaningful and useful. Furthermore, being creative is different from working through a problem and testing all the available solutions. Creative moments seem to come to us in a flash—seemingly out of nowhere—often when the mind appears unfocused, for example, driving in the car or taking a shower. Creative moments feel different, but it has been difficult to identify what happens in the brain when the creative “juices are flowing.”
It is a popular belief that creativity is localized to the right brain. Daniel Pink’s “A Whole New Mind: Why Right-Brainers Will Rule the Future,” a book that was on the New York Times bestseller list for 101 weeks and has been translated into 24 languages, is a good example of this sort of belief. Pink argues that the future belongs to people who can utilize their right brain—storytellers, inventors, designers—in general, people who are more creative. Pink and others purport the right brain is the locus for art and creativity, while the left brain is more mathematical and logical. Is this true or just urban legend? What does the science show?
FIGURE 19.10  Dyslexic children who received a phonics-based reading intervention over one school year showed increased activation in the regions of the brain associated with fluent reading. (Adapted from Shaywitz SE, Shaywitz BA. Dyslexia (specific reading disability. Biol Psychiatry. 2005;57(11):1301-1309.)
Review of the Literature
Dietrich and Kanso in 2010 reviewed the literature on studies designed to identify the neural underpinnings of creative behavior and found 72 studies reported in 63 articles. They divided the studies into three categories (divergent thinking, artistic creativity, and insight) and looked for patterns in the neuroimaging and neuroelectric findings. Their conclusion is straightforward and robust—it’s a mess!
With the possible exception of diffuse prefrontal activation during the creative moment, creativity is not localized to any area of the brain. Specifically, they noted that creativity is “not particularly associated with the right brain or any part of the right brain.” They concluded that a variety of areas of the brain have been identified in one study or another, but then fail to replicate in numerous other studies. In short, the best we can say at this time is that the creative spirit utilizes the PFC—not a particularly enlightening insight. The problem may be the failure of subdividing creativity into appropriate categories or the limitations of our currently imaging equipment.
Creativity and Mental Illness
Another interesting aspect of creativity is the association with mental illness. Individuals such as artist Vincent Van Gogh, writer Ernest Hemingway, and Nobel laureate John Nash are good case examples of highly imaginative people who also struggled with mental illness. The composer Robert Schumann provides one of the most compelling examples of mental illness and the creation of art (Figure 19.11). Schumann attempted suicide twice and eventually died in an asylum. He had two particularly productive periods of his life during which he also had symptoms of hypomania. Graphing his musical works by the years he created them shows a remarkable fluctuation in productivity with mood.
A larger study supports a correlation between creativity and mental illness. Combing results from two older studies, from a time when people were more likely to have taken the Minnesota Multiphasic Personality Inventory, the authors found that scores for writers and highly creative writers fell between normal controls and patients with psychosis (Figure 19.12). It is important to note that the highly creative writers were not necessarily mentally ill, just sharing some of the traits of the seriously mentally ill.
Recent studies using the current method of systematic structured interviews based on the Diagnostic and Statistical Manual criteria have replicated these findings. That is, successful artists such as writers or visual artists have a high prevalence of mental disorders. The most common disorders are depression and bipolar disorder. It is worth noting that whereas creative artists have a high prevalence of mood disorders, it is likely not the same for creative individuals in other fields such as science and engineering. It could be that the moody creative individual is not attracted to the hard core sciences.
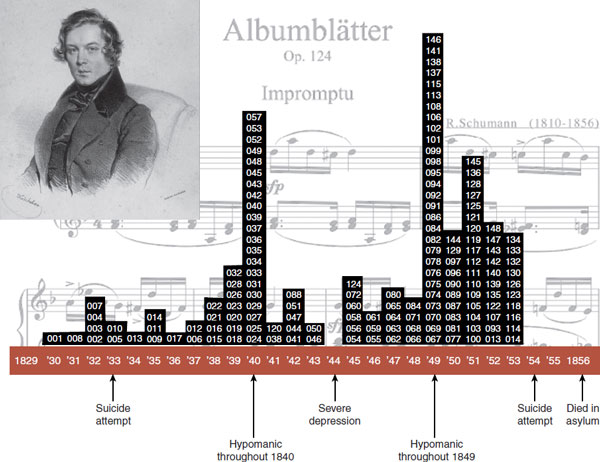
FIGURE 19.11  Robert Schumann’s works graphed by opus number and year of completion provide a visual display of the creative potential of hypomania and the devastating effects of depression. Robert Schumann, Wien 1839, lithography by Joseph Kriehuber. (Adapted from Jamison KR. Manic-depressive illness and creativity. Sci Am. 1995;272(2):627.)
The similarity between creativity and mental illness may be related to decreased filtering of thoughts and sensations. A good example of unfiltered thoughts occurs when we dream during sleep. In this uninhibited state, we experience a wild variety of thoughts that are—if nothing else—unique and creative. Some think dreaming is similar to psychosis. The important point is that when the inhibitions are off (as with sleep), the mind is open to new associations. Yet, few of the new ideas are useful.
Latent inhibition describes one cognitive mechanism known to filter extraneous sensations during the awake state. Latent inhibition is defined as an animal’s unconscious capacity to screen out and ignore stimuli that are irrelevant. Specific tests can measure an individual’s capacity to ignore irrelevant stimuli. Its significance in our discussions is that individuals who have reduced latent inhibition have been shown to be more creative. Additionally, this same trait is associated with increased propensity toward psychosis. In other words, a little less inhibition may promote more creative thinking, but too much may be problematic.
A study with Harvard undergraduate students found an intriguing association among latent inhibition, IQ, and creativity. The authors categorized the students by IQ and capacity for latent inhibition. They also determined each student’s creative achievement. Students scored high on creative achievement if they had published a book, recorded a musical composition, patented an invention, or won a prize for a scientific discovery. The results of this analysis are shown in Figure 19.13.
The figure reflects that highly creative individuals have a high IQ and are less likely to filter out extraneous stimuli. The authors concluded that such individuals not only have access to more information but also have the brainpower to handle the additional information and are consequently more likely to make original connections. However, the authors agreed with the proposition that too much unfiltered sensory information in lower IQ individuals may be a feature of psychotic thinking.
FIGURE 19.12  The Minnesota Multiphasic Personality Inventory (MMPI) allows the plotting of symptom severity across a spectrum—the upper graph being more severe symptoms. Highly creative writers and successful writers fall between typical psychotic patients and healthy controls. (Adapted from Simonton DK. Are genius and madness related? Contemporary answers to an ancient question. Psychiatr Times. 2005;22(7):23-23.)
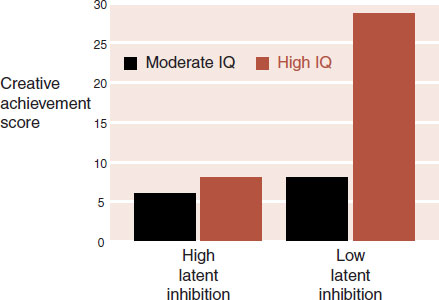
FIGURE 19.13  Undergraduate students with high IQ and low latent inhibition (the ability to filter out irrelevant stimuli) showed greater creative achievement. (Adapted from Carson SH, Peterson JB, Higgins DM. Decreased latent inhibition is associated with increased creative achievement in high-functioning individuals. J Pers Soc Psychol. 2003;85(3):499-506.)
Loosening the Frontal Lobes
Artistic expression may be enhanced with loosening of frontal lobe control. Three examples suggest this is true. The first example is of an artist with evolving frontotemporal dementia whose creative expression blossomed as her illness progressed. The patient was a high school art teacher who had been painting since she was a child. In 1986, at the age of 43, she began developing cognitive problems. Grading papers, preparing for class, and remembering students’ names became increasingly difficult. In 1995, she took early retirement. By 2000, she required caregiver support for her activities of daily living. An MRI showed moderate bifrontal atrophy along with mild left temporal atrophy.
While she was losing cognitive skills, she was also becoming increasingly uninhibited in her artistic expression. Her paintings, which had been previously more traditional, were now impressionistic, abstract, and emotional. Apparently, the inhibitions within the PFC were removed as the disease progressed and the patient became less constrained in her art. However, when the dementia progressed too far, she was no longer able to paint.
James C. Harris, who writes a commentary each month about the artwork on the cover of Archives of General Psychiatry and is also the director of the Johns Hopkins Developmental Neuropsychiatry Clinic, recently wrote about the remarkable drawings discovered in the Chauvet Cave. Dated to approximately 31,000 years ago, the animal drawings have a realistic perspective that seems impossible for Cro-Magnon man (Figure 19.14). How could these “primitive” people produce such expressive work? Dr. Harris speculates that there is reciprocal relationship between artistic representation and frontal lobe development.
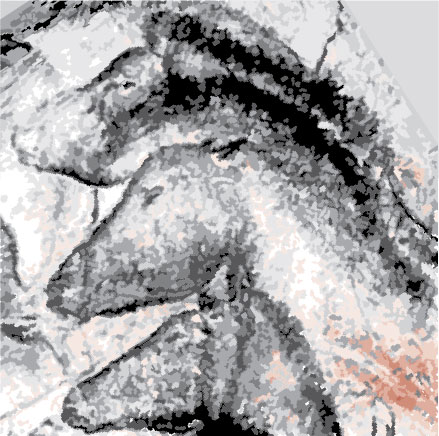
FIGURE 19.14  Drawings in the Chauvet Cave made 31,000 years ago. Did the primitive Paleolithic frontal cortex allow for greater artistic expression?
The final example is a longitudinal study of a girl described as an autistic savant whose graphic skills enabled her to draw with amazing perspective as early as 4 years old even though she virtually had no language skills. However, as she matured and her intellectual ability improved, she lost her artistic touch. These three examples, the onset of dementia, the cave paintings, and the autistic savant, highlight a conflicting relationship among the frontal lobes, artistic creativity, and cognitive skills. There is some process or connecting within the frontal lobes in which “more” is better for cognitive skills but “less” is superior for artistic expression.
QUESTIONS
1. All of the following apply to g, except
a. Fund of knowledge.
b. Novel problem solving.
c. Fluid intelligence.
d. Ability to handle complexity.
2. All of the following are true about the male canary’s HVC, except
a. The size is influenced by testosterone.
b. Greater volume equals greater repertoire of songs.
c. The size is an indirect measure of g.
d. The size fluctuates with the seasons.
3. Indications that the PFC is a major site of intelligence include all of the following, except
a. Active during problem solving.
b. Lesions produce problem-solving deficits.
c. Larger relative size in more intelligent animals.
d. Larger proportion of gray matter in humans compared with other primates.
4. Impaired spine formation on dendrites is seen with all of the following, except
a. Opioid abuse.
b. Memory formation.
c. MR.
d. Impoverished environment.
5. All of the following are true about dyslexia, except
a. Impaired ability to decode words.
b. Right hemisphere problem.
c. Inactive temporal/occipital region during reading.
d. Increased frontal activity with proper treatment.
6. Most creative individuals in the sciences have the following, except
a. Active PFC.
b. Low latent inhibition.
c. Mental illness.
d. Above average IQ.
See Answers section at the end of the book.