Let’s assume that you have found a good solar building site. Using a popular Green Mountain Homes saltbox design as a representative plan, we will move into the more technical portion of the design process by conducting what an engineer would call a “thermal study” of the planned solar home. I will demonstrate with the specifications for a “Saltbox 38” the calculations essential for solar design. Subsequently, in chapter 8, I will explain how to use the worksheets included in this book to do your own thermal study incorporating the specifications for your particular design and site.
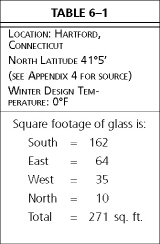
For the sake of discussion, let’s plan on locating our example of this Saltbox 38 in Hartford, Connecticut.This is not the most obvious locale, perhaps, for a solar home, but Connecticut is perfectly suitable. And if solar heating will work in frosty New England, it will work wherever you are planning to build your home. Another way to say this is that Western and Southwestern states with high elevations, clear skies, and high annual percentages of sunshine tend to be associated with solar home design, but obviously many people desiring solar homes live elsewhere.
CALCULATE R-VALUES FIRST
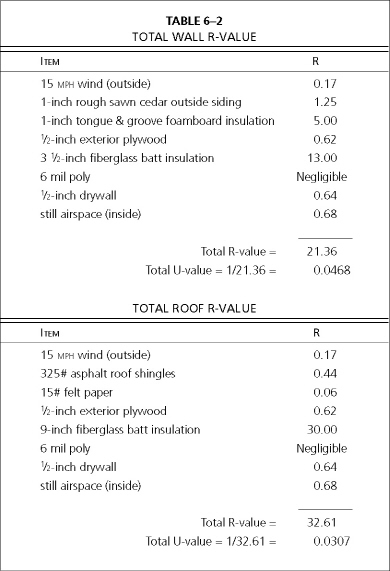
The illustration Typical saltbox design: a cross-section shows the Saltbox cross-section, and the one Two designs for layered wall construction shows wall and roof insulation. I recommend a 2 x 4 stud wall with a layer of 1-inch Styrofoam outside the exterior plywood sheathing. We first need to calculate the heat loss of the building. Step one of this calculation involves determining the wall and roof U-values. Remember from chapter 4 that U is the reciprocal of R, and expressed as Btu/hr • ft2 • °F. The R-value of the wall or roof is the sum of the individual R-values of the various elements that make up the total.
The total wall and roof R-value for the Saltbox 38 is given below.
We will use insulated dual-pane windows and patio doors and assume the manufacturer’s published overall R-value is 1.92 (so that means that the U-value will be 1/1.92 = 0.5208).
REHEATING THE FRESH AIR COMING IN
The thermal “cost” to reheat the recommended  air change per hour discussed in chapter 4 will comprise the infiltration portion of the total heat loss. There are several ways to calculate infiltration losses; we will use the air change method and assume the total air infiltration from all sources is air change per hour. This assumption is based on data derived from the formal monitoring conducted on the prototype N-38 in Royalton, Vermont. This figure includes losses from cracks around windows and doors, the amount of air lost by entering and exiting the building, and the air expelled out of the building by fans in the bathrooms.
Experienced technicians can conduct tests to determine the number of air changes per hour. If for some reason the home has less than a air change per hour, fresh air should be introduced to keep the airspace fresh and safe.
According to the 1972 ASHRAE Handbook of Fundamentals, the heat required to heat one cubic foot of air one degree is the product of the air’s specific heat times its density, or
H = c × d
where:
H = heat required to raise 1 cubic foot of air 1 degree Fahrenheit
c = specific heat of air (0.24 Btus per pound per degree Fahrenheit)
d = density of air (0.075 pounds per cubic foot)
If
H = 0.24 Btus per pound × degree × 0.075 pounds per ft3
then
H = 0.018 Btus/ft3 • °F
To obtain our infiltration loss we will use the following formula:
I = V × H × Q
where:
I = infiltration loss
V = volume of house (in cubic feet)
H = heat removed (Btus/ft3 • °F)
Q = volume of air change (air changes per hour)
If
I = V(cubic feet) × H (Btus/ft3 • °F) × Q (air changes per hour)
then
I = Btus/hr • °F
We now have all the information we need to calculate the total heat loss of the Saltbox 38. Referring to the Saltbox 38 floor plan, elevations and cross-section (see chapter 5.), the total heat loss can be calculated as shown in Table 6–3.
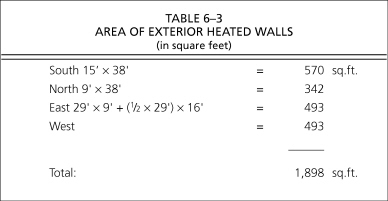
Subtracting the square feet of glass from the above total wall area, the net wall area is:
1,898 total square feet of wall area – 271 square feet of glass = 1,627 square feet of unglazed wall area
The total heat loss for the walls, glazing, and roof is the sum of the products of the square feet of area multiplied by the respective U-values as shown on the following page.
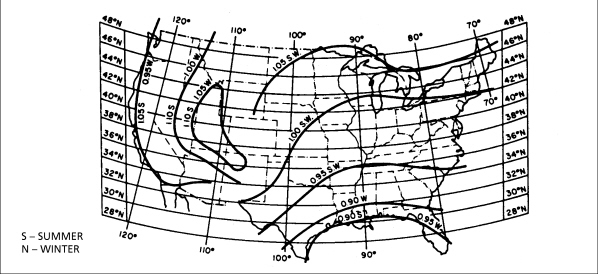
Estimated Atmospheric clearness numbers in United States for nonindustrial localities. The clearness number changes from winter to summer in certain locations.
A. Net Wall Loss = Heated Wall Area (1,627 square feet) × U-value of Heated Wall (0.0468 Btus/hr • ft2 • °F) = 76.14 Btus/hr • °F
B. Roof Loss = Roof Area (38 feet × 40 feet = 1,520 square feet) × U-value of roof (.0307 Btus/hr • ft2 • °F) = 46.67 Btus/hr • ft2 • °F
The house’s Infiltration Loss, calculated using the air change method of analysis is predicted as follows:
C. Infiltration loss = Total Volume of Living Space × Heat Removed × Air Changes per Hour
Total Volume = (8 feet × 28 feet × 38 feet) + (19.67 feet × 8 feet × 38 feet) = 14,492 cubic feet
Infiltration loss = 14,492 ft3 × 0.018 Btus/ft3 • °F × air changes per hour = 174.77 Btus/hr • °F
D. Total Heat Loss through Glazing = Area of Glass × U-value
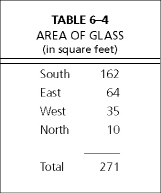
The total area of glazing is shown in Table 6–4 (use your window manufacturer’s literature to obtain the square footage of glass area per window, in your particular case). In our sample Saltbox, the heat loss through glass will be:
271 square feet of glass × 0.5208 Btus/hr • ft2 • °F (U-value of glass) = 141.14 Btus/hr • °F
The house’s total heat loss is summarized in Table 6–5.
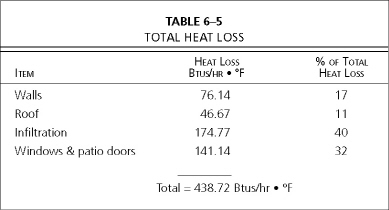
Since this house has no basement, basement losses are not indicated in Table 6–5. Due to the highly insulated perimeter of the Solar Slab and the small area exposed above grade, the Solar Slab perimeter heat loss is insignificant, and also not indicated in the table. If the Solar Slab perimeter loss were to be calculated, it would amount to 2 percent of the total heat loss. This loss should be included if, for some site or design reason, it would amount to more than 2 percent.
Another heat loss factor to consider is the heat transmitted through the framing; this is also referred to as bridging loss. Since the outside wall on this sample Saltbox is constructed as I’ve recommended, with a continuous exterior layer of rigid insulation, and since 2 x 12s were used as roof rafters, bridging losses were deemed to be insignificant, and were therefore omitted in the wall and roof R-value determinations. In most contemporary houses, tightly constructed and well-insulated, these bridging losses will be likewise insignificant, and may be ignored in heat loss calculations.
If, on the other hand, your framing represents more than 10 percent of the wall area, the framing loss should be included in your own calculations. This might occur in certain forms of post-and-beam or log-wall construction. Should you wish to adjust your calculations for framing or bridging losses, one method is to adjust the U-value. For example, in a 2 x 6 wall with the 2 x 6s 16 inches on center, the 2 x 6s account for about 10 percent of the wall area. At 24 inches on center, they account for about 6 percent of the wall area. The following example shows how to adjust the U-value for a 2 x 6 wall 24 inches on center, and a 2 x 12 roof 16 inches on center:
Average U-value of Wall = (Framing Area % of Total Wall Area × Framing Material’s U-value) + (Insulation Area % of Total Wall Area × Insulated Wall U-value)
Average U-value of Wall = (0.06 × 0.1478*) + (0.94 × 0.0468) = 0.0529 Btus/hr • ft2 • °F
Average U-value of Roof = (0.10 × 0.0723*) + (0.90 × 0.0307) = 0.0349 Btus/hr • ft2 • °F
* The U-value for a 2 x 6 is 0.1478 and for a 2 x 12 is 0.0723, assuming kiln-dried hemlock-fir or spruce-pine-fir
In our Connecticut example, the outside temperature used as the basis for calculation is 0 degrees; this is referred to as the “outside winter design temperature,” and you can find a table with representative outside winter design temperatures in appendix 4. Assuming the inside temperature to be 72 degrees Fahrenheit, the theoretical hourly heat loss of the Saltbox 38 in Hartford, Connecticut, is:
438.72 Btus/hr × °F difference (72 degrees inside – 0 degrees outside) = 31,588 Btus/hr
CALCULATING SOLAR GAIN
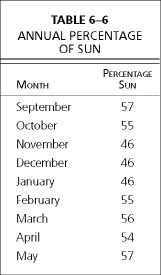
Next we need to calculate the solar gain, the heat input attributable to sunshine. The percentage of sunshine in Hartford, Connecticut, for the heating season is shown in Table 6–6.
One should never assume that there is not enough sun in a given location to justify building a solar house. It might be surprising to many people that the average insolation for the nine-month heating season in Hartford, Connecticut is 52.4 percent, meaning that the daylight hours are sunny more than 50 percent of the time on average in this location. Your new home should be designed to take advantage of whatever natural solar benefits are available. It is reasonable to assume that the economical percentage of solar heat attainable approximates the percent sunshine in a given location. Therefore, when designed properly, this home in Connecticut should receive about half of its heat free from the sun. If so, how can a solar house not work in Hartford, Connecticut?
Remembering that the Saltbox 38 used in this chapter has 162 square feet of south-facing glass, 64 square feet of east-facing glass, and 35 square feet of west-facing glass, we will calculate the predicted monthly insolation using appendix 2, Solar Intensity and Solar Heat Gain Factors (SHGF), for north latitude 40 degrees, from the 1993 ASHRAE Handbook of Fundamentals. The table lists half-day totals, and reads from top to bottom for sunrise to solar noon, and bottom to top for solar noon to sunset. We will ignore the sun’s contribution of heat into the house’s west glass in the morning, and likewise we will ignore the afternoon values for east glass, making the east-side SHGF equal to the west-side SHGF. Since the home faces true south, we will double the south-side SHGF half-day totals. The heat gain per square foot of glass on a given orientation is the product of:
Solar Heat Gain Factors (SHGF) × Shade Coefficient (SC)
In the case of our saltbox, the Shade Coefficient (SC) is the reduction in solar gain due to sunlight being reflected off each sheet of glass. SC is an ASHRAE term. From the 1993 ASHRAE Handbook, we find that the SC for 1/2-inch insulated glass is 0.88.
An examination of Andersen casement window performance specification sheets shows SC = 0.91 for Air-Filled Dual-Pane Glass with a U-Value of 0.48. Go to: http://www.andersenwindows.com/UE/ProductGuide/Residential/400CasementPicturePerformanceCenterofGlass.asp
For Andersen’s High-Performance Low-E Glass, SC = 0.51 and U-Value = 0.28. Substituting Andersen’s High-Performance Low-E Glass in this chapter’s example resulted in a 31 percent decrease in solar efficiency. In other words, the percent solar went from 54 percent down to 37percent, and most important, fuel consumption increased by 24 percent.
Performance was nearly identical to this chapter’s example when Andersen’s Air Filled Dual-Pane Glass was used.
From these test runs, northern passive solar homes depending on south, east, and west faced glass as daytime solar collectors should use normal AirFilled Dual-Pane Glass. Simply stated: Glass with a low SC value prevents too much of the sun’s heat from entering the house. High-Performance Low-E glass with diminished values of SC most probably will be best used in passive solar homes located in the south or central climate zone, where cooling is of equal or greater concern than heating.
Readers are advised to find out the values of SC and U-Value for the windows and patio doors they plan to use in their design. For Pella Windows go to: http://pellaadm.com/HTML/search.html?shade%20coef
Test computer runs should be made using the CSOL program with the different options available, and the SC and U-Value that yield the best results should be used in the design.
Simply stated: Glass with a low SC value prevents too much of the sun’s heat from entering a northern solar home. Be sure to find out the SC of your glazing.
Another consideration, which may be counterproductive, is the Department of Energy and the Environmental Protection Agency Energy Star program. U-Values for glass are published for four climate zones in the United States. The Northern Zone specifies a U-Value equal to or less than 0.35. As stated above, Andersen’s Air-Filled Dual-Pane Glass produced favorable results in our solar home example calculation, but this window has a U-Value greater than 0.35 (0.48). This could present a problem if a lender requires that the new home meet the Energy Star program’s guidelines.
The SHGF also assumes atmospheric clarity of 1.00. If your location is high in elevation and has dry and clear atmosphere, the SHGF may be increased up to 15 percent. Conversely, if the location is hazy and humid, the SHGF should be reduced. To illustrate the calculation, I will use the figures for the September Solar Heat Gains.
From appendix 2, and using the SHGF for 40 degrees north latitude, the September SHGF half-day totals are:
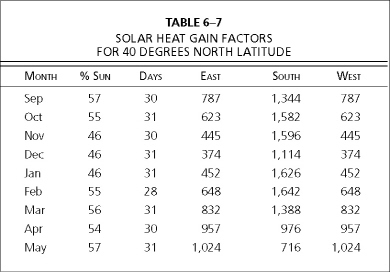
The potential solar gain (expressed in Btus per square foot per day) for east-, west-, and south-facing glass are shown in Table 6–7 (remember that south is multiplied by 2, in order to indicate two half-day subtotals).
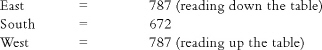
Multiply each column by the square footage of glass on each elevation, then by the number of days in each month, and finally by the percent sunshine. The totals for each elevation are tabulated in Table 6-8 in millions of Btus. Let’s use September as a sample calculation.
East = 787 SHGF × 64 square feet × 30 days × 57% sunshine
= 0.86 million Btus
South = 1,344 SHGF × 162 square feet × 30 days × 57% sunshine
= 3.72 million Btus
West = 787 SHGF × 35 square feet × 30 × 57% sunshine
= 0.47 million Btus
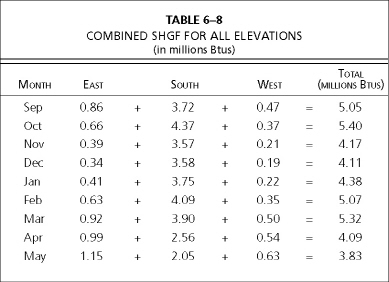
The totals in Table 6–8 need to be adjusted for the heat reflected back from the window due to dual glass. Calculate the loss by multiplying the above monthly totals by a Shade Coefficient of 0.88 (the SC of 1/2-inch insulated glass).
CALCULATING HEAT LOAD
Degree days are a measure of the heat required for a building, and degree day data from the 1981 ASHRAE Handbook of Fundamentals will be used in this chapter (see appendix 5). A degree day is defined as the difference between the median outdoor temperature and 65 degrees for a 24-hour period. The standard assumption is that the inside design temperature is 72 degrees, of which 7 degrees will be derived from sources other than the furnace. These sources include heat from lighting and cooking, the body heat of people, and so forth. Degree day tables are tabulated with an outside base temperature of 65 degrees. For example, if the outdoor median temperature was 64 degrees for the 24-hour time period, then that day had 1 degree day. The local power company keeps accurate track of degree days for its heat load calculations, and is usually a good source for this information. Oil and propane companies use degree days as a guide to tell them how frequently to make deliveries. The National Oceanic and Atmospheric Administration (NOAA) also tabulates this and other valuable weather data. The nearest engineering or earth sciences library will most probably have this data on microfiche. Ask for the five-year average to obtain a good approximation of your heat load. The degree day data obtained from other sources may differ slightly from the data contained in this book, since this kind of information is routinely updated. Slight differences will not materially affect your solar prediction calculations. Remember that we are dealing with a “fuzzy” (transient) problem, and solar predictions at best will be an informed approximation.
Knowing the calculated heat loss of our building, the degree days for our location, and the solar gains for our location, we are now ready to tabulate this information and derive our solar performance prediction.
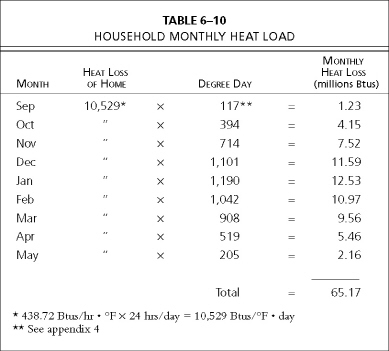
Let’s first calculate heat load per month. See Table 6–10 for a summary by month of the building’s projected heat load.
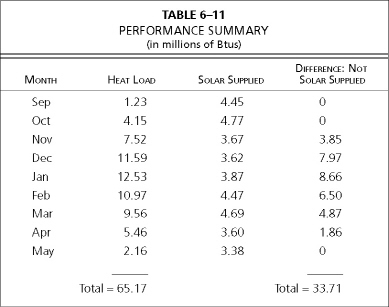
The Performance Summary for the home is shown in Table 6–11.
The Difference: Not Solar Supplied in Table 6-11 is the purchased fuel that will be needed per year. Note that in September, October, and May, the home is receiving more solar heat than needed, and in that case the windows are probably open, releasing the extra heat. In the table, when the “Solar Supplied” number exceeds the “Heat Load” number, zero is used for that month in the “Difference” column.
In this example the calculation process is as follows:
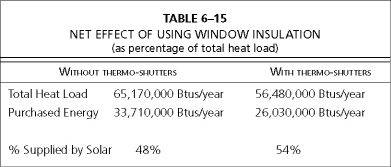
Total Purchased Fuel = 33,710,000 Btus
Total Heat Demand = 65,170,000 Btus
Percentage of Purchased Fuel = 33,710,000 Btus ÷ 65,170,000 Btus × 100 = 52% Not Solar Supplied
Percentage supplied by Solar = 100% – 52% = 48% Solar Supplied
The above calculation assumes that the home is faced true south. In our example, Hartford, Connecticut has a westerly magnetic deviation from true north of 12 degrees (see appendix 7 for an isogonic map, which indicates magnetic declinations). That means that once we have established our north–south compass line, the north–south axis of our solar home should be rotated clockwise 12 degrees.
HEAT LOSS REDUCTION DUE TO
WINDOW INSULATION
In chapter 4 we discussed the benefits of providing supplementary window insulation using thermo-shutters or some other form of night-time insulation on at least some of the home’s glazing. Let’s now calculate the difference in performance assuming that we are going to install thermo-shutters on 203 square feet of window and patio glass. This example further assumes that the thermo-shutters will be closed at night during the heating season.
Utilizing the same technique demonstrated earlier in this chapter, we calculate the R-value of the thermo-shutter to be 7.76. The total R-value of the window or patio door with the thermo-shutter closed is shown in Table 6–12.
Assuming that the thermo-shutters are closed for sixteen hours per night and open for eight hours during the day, the thermo-shutter credit will be calculated as follows:
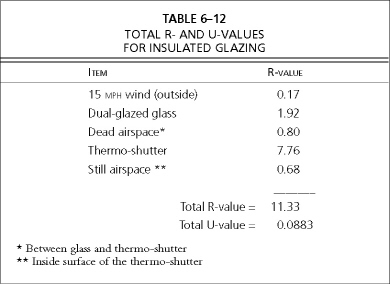
Square feet of thermo-shuttered glass × (U-value of glass – U-value of thermo-shutter) × Number of hours with thermo-shutters in closed position
203 square feet × (0.5208 Btus/hr • ft2 • °F – 0.0883 Btus/hr • ft2 • °F) × 16 hours/day
= 1,405 Btus/°F • day
Applying the above thermo-shutter credit to our previously calculated total heat loss, the new predicted heat loss total will be:
10,529 Btus/°F • day – 1,405 Btus/°F • day = 9,124 Btus/°F • day
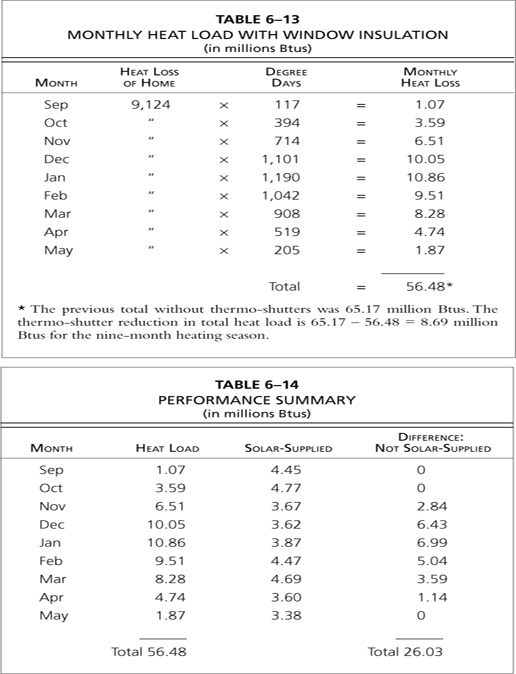
Using this revised heat loss calculation, we now recalculate the monthly heat load as shown in Table 6–13.
Table 6–14 shows the home’s total heat load in relation to the portion that is supplied by solar and not supplied by solar.
Now the totals can be summarized as follows:
Total Purchased Fuel = 26,030,000 Btus
Total Heat Demand = 56,480,000 Btus
Percentage of Purchased Fuel = 26,030,000 Btus ÷ 56,480,000
Btus × 100 = 46%
Percentage Supplied by Solar = 100 – 46 = 54%
As you can see, adding thermo-shutters lowers the total heat requirement of the home and increases the percentage supplied by solar. The overall effect of using thermo-shutters is summarized in Table 6–15.
From the performance summaries in this chapter, we can see that about two-thirds of our purchased energy is required to meet heating needs in December, January, and February. It is in these months that nighttime window and patio door insulation is the most beneficial. These months have the longest nights and shortest days, making it less inconvenient to cover our glass, since we can’t see out anyway. There are also non-numerical benefits provided by nighttime window and patio door insulation. Many people find that a home with window insulation psychologically “feels” cozier and more secure.
DID WE KEEP THE FURNACE OFF?
The performance summary tabulations are based on monthly averages and don’t tell us when and if the furnace runs, or what the living space and Solar Slab temperatures are. Have we met our design goal of keeping the furnace off?
February is a high-intensity solar month, making it a good one in which to check the living space and Solar Slab temperatures. We need to make sure that the home is in thermal balance and not overheating. In the following discussion, we will continue with and refine the concepts introduced in chapter 3.
Let’s assume that the Solar Slab is comprised of 4 inches of concrete slab bonded to 12-inch concrete blocks, as illustrated The Solar Slab concrete heat exchanger: a section drawing and The Solar Slab: a sill detail. Since the Solar Slab is inside the perimeter-foundation-wall insulation, and contains ductwork that displaces some of the concrete blocks, we will reduce the volume of theoretical concrete mass by 15 percent.
Remembering from chapter 3 that a concrete block is about 50 percent solid concrete, the volume of concrete in our Solar Slab is calculated as follows:
Volume of concrete = foundation dimensions × depth of concrete × % of theoretical concrete volume that is functional thermal mass
In the sample Saltbox, let’s define these variables in this way:
Depth of concrete = ½ of concrete block height (½ × 12 inches)+ slab thickness (4 inches) = 10 inches (or 0.833 feet)
Volume of concrete =
(28 feet × 38 feet × 0.833 feet) × 85% = 754 cubic feet
The adjusted predicted heat loss with thermo-shutters will be:
9,124 Btus/°F • day ÷ 24 hr/day = 380 Btus/hr • °F
Let’s see if the furnace needs to run. Our start time will be 10:00 PM, and we will assume the following circumstances:
1. The automatic thermostat has switched to its set-back position of 55 degrees, and our occupants have retired for the night.
2. The 10:00 pm Solar Slab temperature is 68 degrees, because the preceding day was sunny.
3. The overnight outside temperature is 10 degrees.
Let’s calculate what the 7:00 AM Solar Slab temperature will be. Appendix 2 shows that in February, our solar day starts at 7:00 AM and ends at 5:00 PM.
We also need to estimate what the average inside temperature will be overnight. Using our 10:00 PM start temperature of 68 degrees, and assuming a 7:00 AM morning temperature of 60 degrees, the average overnight living space temperature is then 64 degrees. Our Delta T (temperature difference between inside and outside) will be calculated this way:
Delta T = inside temperature (64°) – outside temperature (10°)
= 54 degrees Fahrenheit
Likening the Solar Slab to a battery, we will next see how much of a “charge” (measured in degrees) we will lose overnight. We will need to calculate the Solar Slab Thermal Capacity (SSTC). The SSTC is the product of the volume of concrete multiplied by the capacity of concrete to hold heat.
As explained above, the measure of a material’s capacity to hold heat is called “specific heat,” which is the ratio of the amount of heat required to raise a quantity of a given material one degree to that required to raise an equal mass of water one degree. The heat storage capacity of the Solar Slab is about 30 Btus per cubic foot per degree. This figure is derived as follows. The specific heat of 12-inch standard weight concrete blocks is about 0.22 Btus per pound per degree Fahrenheit. The specific heat of poured concrete is between 0.19 and 0.24 Btus per pound per degree Fahrenheit. Using 0.215 for the combination of concrete slab and concrete blocks, and 140 pounds per cubic foot as their combined weight, the heat capacity of the sample Solar Slab is calculated as follows:
0.215 Btus/pound • °F × 140 pounds/ft3 = 30.1 Btus/ft3 • °F
The SSTC equals
754 ft3 of concrete × 30 Btus/ft3 • °F
= 22,620 Btus/degree of change
The 10:00 PM to 7:00 AM heat loss will be:
380 Btus/hr • °F × 54° × 9 hours = 184,680 Btus
Since there is a positive temperature difference between the Solar Slab and the living space, the Solar Slab will supply the necessary overnight heat. Dividing the 10:00 PM to 7:00 AM heat loss by the SSTC, we find how many degrees the Solar Slab lost overnight:
184,680 Btus ÷ 22,620 Btus per degree = 8.2 degrees
Our “battery” lost 8 degrees of “charge.” Subtracting the overnight temperature loss of 8 degrees from the 10:00 PM Solar Slab temperature of 68 degrees, we find that the 7:00 AM Solar Slab temperature would be 68 – 8 = 60 degrees.
The set-back on an automatic thermostat lowers the temperature at which the thermostat calls for heat, and does so at a time which the resident specifies. In this example the set-back, overnight temperature is 55 degrees between 10 PM and 7:00 AM. That is, the house temperature must go below 55 degrees before the thermostat will switch on the furnace. Since the Solar Slab temperature will not decay to less than 60 degrees in this example, in actuality there will be no requirement for the furnace to operate to maintain a comfortable overnight temperature, even though the ambient or outside temperature may be severely cold.
This is a situation where even the most skeptical person will agree that the Solar Slab is yielding heat from its stored state back into the living space.
Since the thermostat was set to turn on the furnace at 55 degrees, the furnace did not operate from 10:00 PM to 7:00 AM because the minimum overnight living space temperature was 60 degrees.
Next let’s assume that the daytime heat setting is 68 degrees, and as suggested in chapter 5, we have located the thermostat on an east-facing interior wall. Let’s further assume that we have another sunny day. At 7:00 AM we are having breakfast in our sunny east side dining/family area, and the sun is warming us and also striking the thermostat, which heats up and does not turn the furnace on. As the solar day progresses, the entire home rises in temperature to 68 degrees. As excess solar heat enters the home, and is stored in the Solar Slab, the living space temperature will probably increase to between 70 and 72 degrees. Since these temperatures are above the thermostat setting of 68 degrees, from 7:00 AM to 5:00 PM the furnace will not operate.
Using the information contained in appendix 2, from the 1993 ASHRAE Handbook of Fundamentals, the amount of solar energy or insolation available to vertical glass on February 21 at north latitude 40 degrees is as shown in Table 6–16.
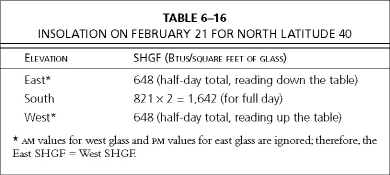
Because some of the sun’s energy is reflected out of dual-glazed windows, the amount of heat passing through the insulated dual-glazed window is reduced by multiplying the above totals by 0.88, which you will recall is the Shade Coefficient (SC) for 1/2-inch insulated glass.
Our total solar gain for the day can be calculated as:
0.88 × (648 SHGF × 64 square feet of east-facing glass) + 0.88 × (1,642 SHGF × 162 square feet of south-facing glass) + 0.88 × (648 SHGF × 35 square feet of west-facing glass)= 290,537 Btus
The Average Winter Temperature for Hartford, Connecticut, is 37 degrees Fahrenheit (see appendix 5). Let’s assume that our sunny February 7:00 AM to 5:00 PM outside temperature is 40 degrees. Using 68 degrees as the inside temperature, the Delta T (temperature difference between inside and outside) will be
68° - 40° = 28° Fahrenheit
The heat loss from 7:00 am to 5:00 pm will therefore be:
380 Btus/hr • °F × 28° × 10 hr = 106,400 Btus
Note: It is reasonable to use the reduced heat loss figure of 380 Btus per degree-hour, because the windows are heat gainers on sunny days. Also, the sun striking the south wall neutralizes it in terms of heat loss.
The amount of free solar heat available for storage during the 10hour solar collection time period can be summarized as:
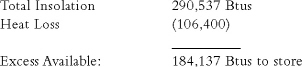
To find the daytime Solar Slab temperature increase, divide the above figure by the SSTC:
184,137 Btus ÷ 22,620 Btus per degree = 8.14 degrees
Our “battery” took on a daytime charge of 8 degrees. Adding the daytime Solar Slab temperature gain of 8 degrees to the 7:00 AM Solar Slab temperature of 60 degrees, we have a 5:00 PM Solar Slab temperature of 68 degrees. Since the temperature of the home will have quickly risen to 68 degrees even though the furnace had been “tricked” into not operating during breakfast, the furnace will have ended up not running all day.
From 5:00 PM to 10:00 PM the furnace may be needed to supplement the heat in the Solar Slab to keep the temperature at 68 degrees or higher, as required by the occupants.
Should the next day be sunless, the furnace will operate longer to keep the airspace up to temperature. In chapter 7 we will discuss how the Solar Slab assists the furnace even on sunless days.
IS THE HOME
IN THERMAL BALANCE?
The above 24-hour analysis demonstrated how the furnace was off for long periods of time, and showed that the Solar Slab’s 24-hour temperature swing or variation was about 8 degrees. Using this methodology for design calculations, a home incorporating a Solar Slab should be designed to keep the Solar Slab temperature swing within a range of about 10 degrees or less.
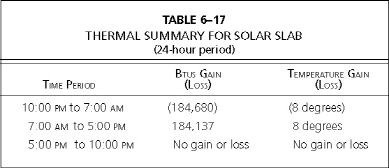
Table 6–17 gives the thermal summary for the Solar Slab for the 24-hour period described above.
Thermal balance has been achieved because the overnight loss in heat is about equal to the amount of heat that the east-, south- and west-facing glass was able to collect in excess of the amount of heat needed by the home during the day while the sun was out. This excess heat was absorbed by and later given back by the Solar Slab. The Solar Slab daily gain was approximately equal to the nighttime loss.
An example of a smaller, one-story solar home, in which every room is sunny.
In our example of a Saltbox 38 in Hartford, Connecticut on a sunny February 21, the amount of energy collected by the windows and the patio doors, the heat demands of the home, and the size of the thermal mass are all in proper proportion. This home is not overheating and the daily temperature swing was within comfortable limits.
What was the cost to heat this solar home for the 24-hour period described above? Let’s assume that the furnace fires at 0.85 gallons of oil per hour. The furnace will probably have run for about 1.5 hours in the evening and possibly .5 hours in the early morning. In that 24hour period, the furnace ran about 2 hours, consuming
2 hours × 0.85 gallons per hour = 1.70 gallons of oil
At $1.99 per gallon, the residents will have paid $3.38 for their fuel for that February day and night. The vast majority of the heat they used was free, simply harvested from the sky.
INSURING COMFORT:
SOME BASIC GUIDELINES
It is difficult to make a general rule that dictates the amount of glass and the amount of thermal mass that a solar home will need to perform optimally throughout the year. Try not to use too much of a good thing. That is, don’t overglaze. Make sure that the thermal mass is sized to allow no more than a 8-degree temperature swing from its warmest to coolest state. The occupants will feel comfortable with a temperature swing in the Solar Slab from a low of 62 to high of 70 degrees, and uncomfortable if it is colder in the morning than 62 or hotter in the afternoon than 70.
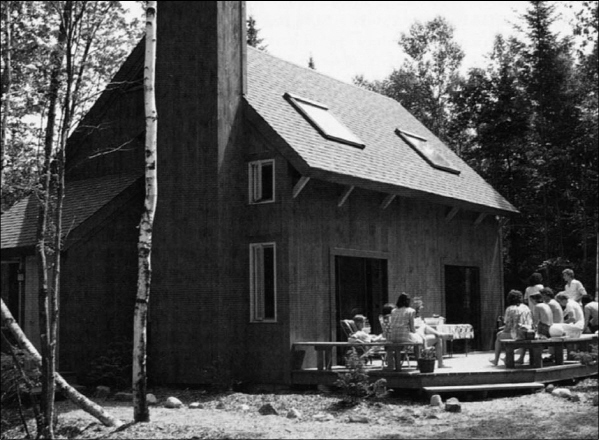
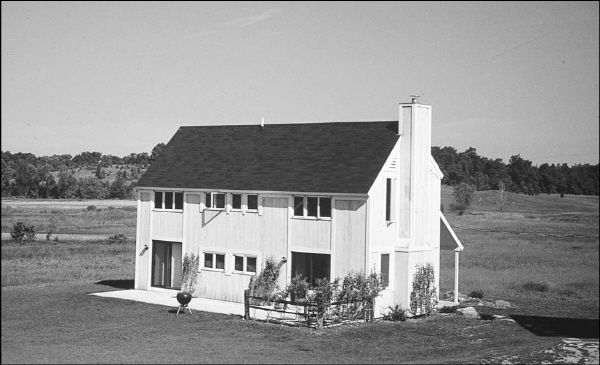
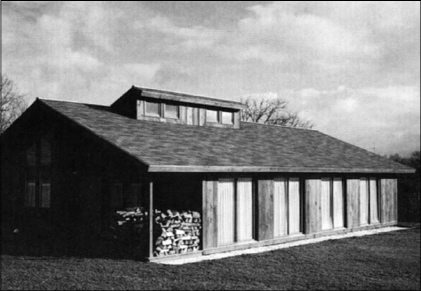
Typically, a poured slab will be 4 inches thick in a larger home, and up to 7 inches thick in a smaller home such as the N-38-X, which was another model offered by Green Mountain Homes. The N–38–X represents a small house with 1,408 square feet of living space, whereas the Saltbox 38 represents a larger home of 1,895 square feet (see photo.).
Attempts have been made to produce ratios that will dictate the ideal relationship of glass to mass, or glass to wall area, or glass to floor area. Again, considering the wide variations in regional climatic conditions and in the specific characteristics of local building sites, general rules are difficult to create and apply. There really is no substitute for good solar design and good judgment. As can be seen in the example above, the amount of glass on each elevation and the size of the thermal mass are interrelated, and such relationships are dependent on location, the heat loss of the building, and other factors.
The Saltbox 38 we have been using as an example is designed according to the following ratios of glazing to insulated wall area, considering the glass area on the east, west, and south as a percentage of insulated wall area:
261 square feet of glass ÷ 1,898 square feet of insulated wall area × 100 = 14%
Using 8 degrees as the design temperature “swing” in the Solar Slab, the smaller home will be used to illustrate a procedure to determine the appropriate thickness of the poured slab.
The specifications for this representative N–38–X (sample location: Middlebury, Vermont) are:
Footprint (dimensions of Solar Slab) = 16 feet × 38 feet = 608 square feet
East- and west-facing glass = 44 square feet each
South-facing glass = 122 square feet
East-, west-, and south-facing glass area ÷ insulated wall area = 210 square feet ÷ 1,720 square feet × 100 = 12%
Area of glazing insulated with thermo-shutters = 80 square feet
Total heat loss for the house, with thermo-shutters in use = 295 Btus/hr • °F
Let’s determine the thickness of the Solar Slab needed to keep the above solar home in thermal balance. Middlebury is approximately 44 degrees north latitude. Since appendix 2 lists the SHGF for 40 and 48 degrees north latitude, the SHGF will be interpolated for 44 degrees north latitude. Using a peak February day, and 8 degrees as our maximum desired Solar Slab temperature swing, the correct calculation is as follows:
Solar Principle # 6
Do not over-glaze.
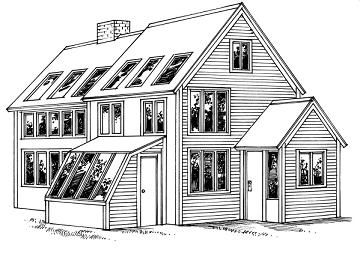
Incorporate enough windows to provide plenty of daylight, but do not make the mistake of assuming that solar heating requires extraordinary allocations of wall space to glass. An over-glazed building, as shown below, will probably overheat. A highly insulated and well-constructed home with a proper number and distribution of high-quality windows does not need much energy to maintain comfortable temperatures year-round.
Elevation Solar Heat Gain Factor
East 594 Btus per square foot (half-day total, reading down the table)
South 817 × 2 = 1,634 Btus per square foot (full day)
West 594 Btus per square foot (half-day total, reading up the table)
Using a Shade Coefficient of 0.88 (for 1/2-inch insulated glass), the total insolation for a peak February day is:
East = 44 ft2 × 594 Btus /ft2 × 0.88 = 23,000 Btus
South = 122 ft2 × 1,634 Btus/ft2 × 0.88 = 175,426 Btus
West = 44 ft2 × 594 Btus/ft2 × 0.88 = 23,000 Btus
_______________
Total: 221,426 Btu
Since the SHGF Tables assume a Clearness Number of 1.00, and since Middlebury is in snow country, the total insolation will actually be increased by 10 percent, because the low angle of the February sun will reflect heat upward from the snow cover. The new total, adjusted accordingly, is:
221,426 Btus × 1.10 = 243,569 Btus
The Average Winter Temperature for Middlebury, Vermont, is about 30 degrees. Using 68 degrees as the average inside temperature, the Delta T or difference is:
68° – 30° = 38° Fahrenheit
The 7:00 AM to 5:00 PM heat loss will be:
295 Btus/hr • °F × 38 degrees × 10 hours = 112,100 Btus
The amount of free solar heat available for storage during the 10hour solar collection time is:
Total Insolation 243,569 Btus
Heat Loss (112,100 Btus)
____________
Excess available to store: 131,469 Btus
The formula to determine the necessary thickness for this home’s Solar Slab is:
Stored Btus = cubic feet of concrete × Btus per cubic foot per degree × maximum design Solar Slab temperature variation, or
131,469 Btus = x cubic feet of concrete × 30 Btus per cubic foot per degree × 8 degrees
This means that the correct figure in the equation for the cubic feet of concrete needed will be 548. The next calculation will involve dividing this cubic foot total by the square footage of the slab multiplied by 85 percent to account for the functional percentage of thermal mass in the overall slab (the figure 0.85 compensates for the portion of concrete block displaced by air passages and ducts):
548 cubic feet ÷ (16 feet × 38 feet × 0.85)
= thickness of Solar Slab (1.06 feet, or 13 inches)
Since 12-inch concrete blocks are half solid, the slab thickness is 13 inches – 6 inches = 7 inches.
NO COOKBOOK RECIPES
FOR SOLAR DESIGN
While writing this book I conducted a search of the design records for existing Green Mountain Homes in the hope of finding certain ratios or percentages that were common to all solar homes and that could be used to assist other designers. No obvious “cookbook recipe” emerged, except for two basic design parameters:
1. The square footage of east-, south-, and west-facing glass should be in the range of 10 to 20 percent of the total exterior heated wall area.
2. The peak solar-supplied February-day increase in Solar Slab temperature should be 8 degrees.
Is there a general rule about the ideal square footage of east- or west-facing glass as it relates to the square footage of south-facing glass? As mentioned earlier, east- and west-facing glass, though beneficial in late fall and early spring, must be used judiciously in locations where summer air conditioning is required. In northern New England, where air conditioning is never really necessary, the amount of east- or west-facing glass can be increased; however, in Maryland, where the expense of air conditioning is a factor, the amount of east- and west-facing glass should be less, in order to reduce morning and afternoon heat gain. Remember that west-facing glass will be especially detrimental to keeping a home cool. The low angle of the westerly sun will overheat the home in summer in locations where summer cooling is a design factor. The range of east- or west-facing glass as a percentage of south-facing glass in the homes we researched was from 25 percent to 75 percent, which is too high a spread to yield any general rule. Other factors influencing decisions about the amount of east- and west-facing glass are the floor plan or layout of the home, the location of shade trees, the direction of special views, the use of window insulation, the dominant weather conditions at the site, and most importantly, the desires and aesthetic preferences of the homeowner.
Our design philosophy and practice has been first to present ideal considerations to the people planning a house, and then to incorporate as many of these idealized factors as possible while carefully considering the clients’ desires, needs, and particular site situation.
One way to solve a problem is to guess. (There’s a fancier engineering term for the stratagem — convergence by trial and error). Then make the appropriate calculations and see what the results look like. Then repeat the calculations procedure with a better guess, until the variables converge toward the best result. The same method can be used to design a home with a Solar Slab.
SUMMARY OF THE DESIGN PROCEDURE
In summation, the sequence of steps in the solar design procedure are as follows:
1. Conduct a site analysis: in other words, really get to know this place where you may be spending many years. Make numerous visits at different times of day and in different seasons.
2. Begin to do progressively more refined drawings and floor plans for the home, keeping in mind the solar design principles presented in this book, and using the amount of glass suggested in this chapter for the east-, south-, and west-facing elevations. Keep the total square footage of the east-, south-, and west-facing glass between 10 to 20 percent of the total square footage of heated wall area.
3. Find the north latitude of the home site (see appendix 4).
4. Find the Outside Winter Design temperature for this location (again, see appendix 4).
5. Calculate the R-values for the walls, glass, and roof (see appendix 3).
6. Calculate the overall predicted heat loss of the home, taking a nighttime insulation credit if nighttime glass insulation will be used.
7. Find the degree day data for the specific home site (see appendix 5).
8. Find the insolation values for the home site (see appendix 2).
9. Find the percentage of sunshine for the home site (see appendix 6).
10. Tabulate in Btus the heat load, including the portion that will be solar-supplied and the difference, not solar-supplied.
11. Calculate the percentage of total heat load that will be supplied by solar.
12. Use the “converging guess” method to make several “runs,” adjusting the variables and trying out different combinations, to see which design produces the best economy while satisfying the aesthetic and living-space requirements of the home’s future residents.
13. Using a peak solar day in February, calculate the following:
A. The predicted daytime excess solar energy: the amount of heat available to be stored for later.
B. The necessary thickness of the Solar Slab based on an ideal daytime temperature swing of 8 degrees.
14. Check your overall results using common sense and good judgment—for which there is no substitute!
A solar home uses thermal mass—a material that readily absorbs heat—to collect and store the warmth of the sun during the day. This thermal mass will then radiate heat back into a home’s living space during the cooler nighttime hours. This book describes a technique for constructing a Solar Slab using ordinary concrete blocks and a poured slab, which transforms the conventional house foundation into a particularly effective thermal mass.
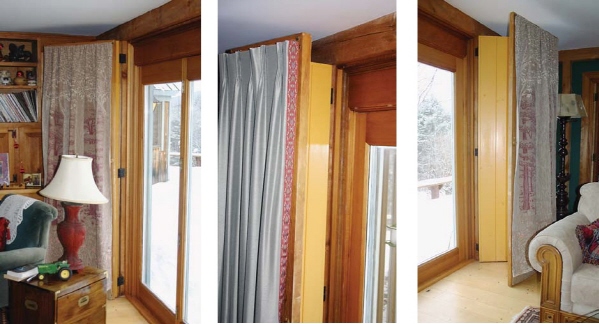
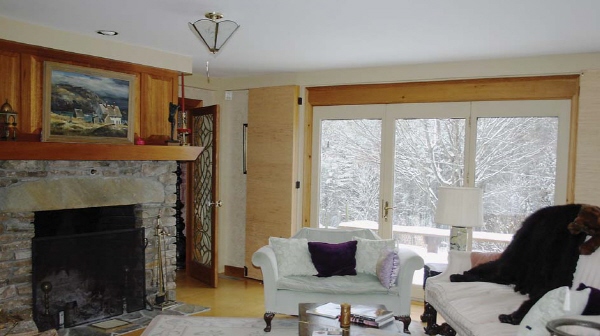
Folding thermo-shutters insulate windows at night (or shade the windows during times of intense sun). Space to either side of windows and doors is designed into house plans so that the shutters have room to fold back against the wall. The shutters can be decorated to harmonize with the room decor, giving you the style and grace of draperies with the much higher R-value of solid, airtight shutters.
Because of improvements in the standards for wall framing, windows, and insulation, even conventional houses are now far more energy efficient than our ancestors’ homes. As a result, it has never been easier to build a passive solar house.

The first principles of good solar design are siting a home with a southern exposure and utilizing the natural features of the site, including trees that provide shelter from harsher weather that tends to come from the north.

A passive solar home will to a great extent heat and cool itself, with minimal use of conventional HVAC equipment, and with no additional conventional expenses over the cost of comparably sized non-solar, fossil-fuel-dependent house. Note the three deciduous trees planted to provide summer shade, yet allow full winter sun.


In a building that is tightly constructed and well insulated, you will need to be sure to provide for adequate exchange of fresh air. You might want to consider including a solar cat or two in your household: not only will a cat infallibly follow the path of the sunlight over the course of the day, but with its frequent trips in and out through the door, the cat will ensure a comfortable exchange of air.


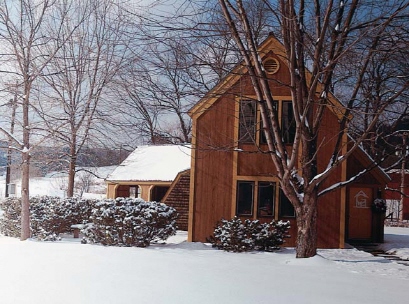
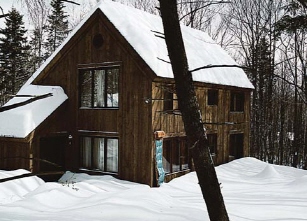
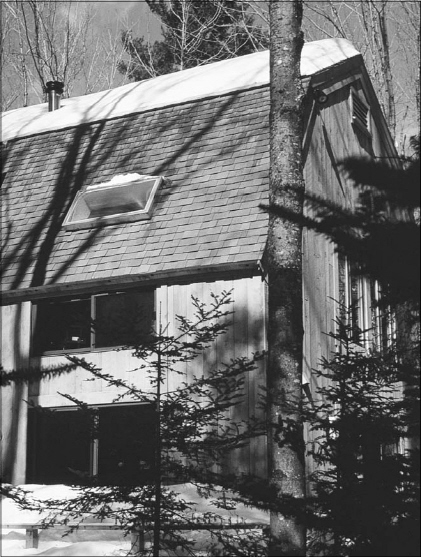
Three solar homes, all warm and comfortable even in the depths of winter. Note in the bottom picture how the snow lies very evenly on the roof. Proper insulation and venting of the roof allows the snow to melt away slowly without causing “tell-tale” icicles or creating ice-dam problems.
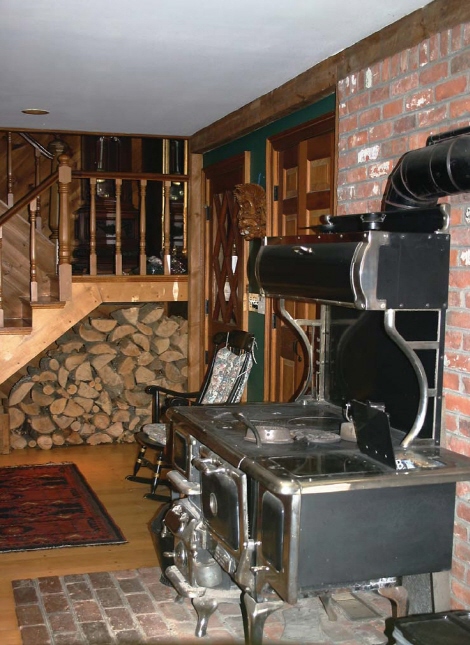
The front entrance and stairway of a solar home. Notice the proximity of the woodpile to the front door and the airtight wood/coal stove, which provides a substantial amount of the backup heat needed by this 3,500-square-foot home. Air grilles located behind the woodpile discharge warm air collected at the second-floor ceiling.
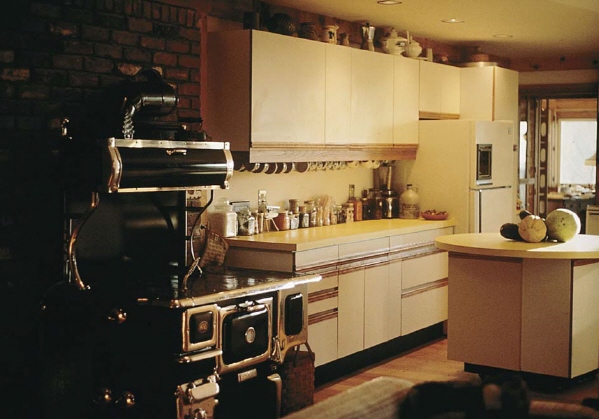
A view of the kitchen, located to the right of the stove pictured on the previous page. The stove also provides domestic hot water for further energy savings.