Examining thread activity is especially important if you are trying to determine why a process that is hosting multiple services is running (such as Svchost.exe, Dllhost.exe, or Lsass.exe) or why a process is hung.
There are several tools that expose various elements of the state of Windows threads: WinDbg (in user-process attach and kernel-debugging mode), Performance Monitor, and Process Explorer. (The tools that show thread-scheduling information are listed in the section Thread Scheduling.)
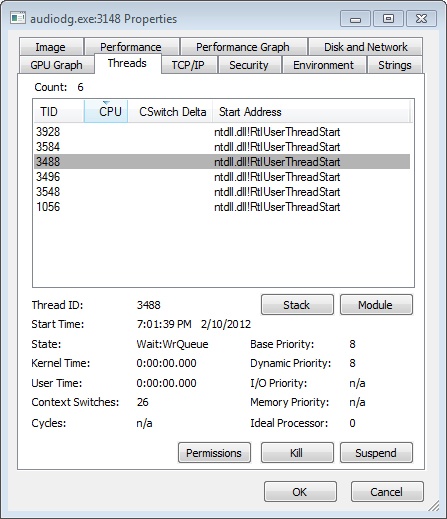
To view the threads in a process with Process Explorer, select a process and open the process properties (by double-clicking on the process or clicking on the Process, Properties menu item). Then click on the Threads tab. This tab shows a list of the threads in the process and four columns of information. For each thread, it shows its ID, the percentage of CPU consumed (based on the refresh interval configured), the number of cycles charged to the thread, and the thread start address. You can sort by any of these four columns.
New threads that are created are highlighted in green, and threads that exit are highlighted in red. (The highlight duration can be configured with the Options, Difference Highlight Duration menu item.) This might be helpful to discover unnecessary thread creation occurring in a process. (In general, threads should be created at process startup, not every time a request is processed inside a process.)
As you select each thread in the list, Process Explorer displays the thread ID, start time, state, CPU time counters, number of cycles charged, number of context switches, the ideal processor and its group, and the base and current priority. There is a Kill button, which will terminate an individual thread, but this should be used with extreme care. Another option is the Suspend button, which will prevent the thread from forward execution and thus prevent a runaway thread from consuming CPU time. However, this can also lead to deadlocks and should be used with the same care as the Kill button. Finally, the Permissions button allows you to view the security descriptor. (See Chapter 6, for more information on security descriptors) of the thread.
Unlike Task Manager and all other process/processor monitoring tools, Process Explorer uses the clock cycle counter designed for thread run-time accounting (as described later in this chapter), instead of the clock interval timer, so you will see a significantly different view of CPU consumption using Process Explorer. This is because many threads run for such a short amount of time that they are seldom (if ever) the currently running thread when the clock interval timer interrupt occurs, so they are not charged for much of their CPU time, leading clock-based tools to perceive a CPU usage of 0%. On the other hand, the total number of clock cycles represents the actual number of processor cycles that each thread in the process accrued. It is independent of the clock interval timer’s resolution because the count is maintained internally by the processor at each cycle and updated by Windows at each interrupt entry. (A final accumulation is done before a context switch.)
The thread start address is displayed in the form “module!function”, where module is the name of the .exe or .dll. The function name relies on access to symbol files for the module. (See EXPERIMENT: Viewing Process Details with Process Explorer in Chapter 1.) If you are unsure what the module is, click the Module button. This opens an Explorer file properties window for the module containing the thread’s start address (for example, the .exe or .dll).
Note
For threads created by the Windows CreateThread function, Process Explorer displays the function passed to CreateThread, not the actual thread start function. That is because all Windows threads start at a common thread startup wrapper function (RtlUserThreadStart in Ntdll.dll). If Process Explorer showed the actual start address, most threads in processes would appear to have started at the same address, which would not be helpful in trying to understand what code the thread was executing. However, if Process Explorer can’t query the user-defined startup address (such as in the case of a protected process), it will show the wrapper function, so you will see all threads starting at RtlUserThreadStart.
However, the thread start address displayed might not be enough information to pinpoint what the thread is doing and which component within the process is responsible for the CPU consumed by the thread. This is especially true if the thread start address is a generic startup function (for example, if the function name does not indicate what the thread is actually doing). In this case, examining the thread stack might answer the question. To view the stack for a thread, double-click on the thread of interest (or select it and click the Stack button). Process Explorer displays the thread’s stack (both user and kernel, if the thread was in kernel mode).
Note
While the user mode debuggers (WinDbg, Ntsd, and Cdb) permit you to attach to a process and display the user stack for a thread, Process Explorer shows both the user and kernel stack in one easy click of a button. You can also examine user and kernel thread stacks using WinDbg in local kernel debugging mode.
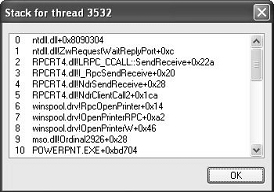
Viewing the thread stack can also help you determine why a process is hung. As an example, on one system, Microsoft Office PowerPoint was hanging for one minute on startup. To determine why it was hung, after PowerPoint was started, Process Explorer was used to examine the thread stack of the one thread in the process. The result is shown in Figure 5-12.
This thread stack shows that PowerPoint (line 10) called a function in Mso.dll (the central Microsoft Office DLL), which called the OpenPrinterW function in Winspool.drv (a DLL used to connect to printers). Winspool.drv then dispatched to a function OpenPrinterRPC, which then called a function in the RPC runtime DLL, indicating it was sending the request to a remote printer. So, without having to understand the internals of PowerPoint, the module and function names displayed on the thread stack indicate that the thread was waiting to connect to a network printer. On this particular system, there was a network printer that was not responding, which explained the delay starting PowerPoint. (Microsoft Office applications connect to all configured printers at process startup.) The connection to that printer was deleted from the user’s system, and the problem went away.
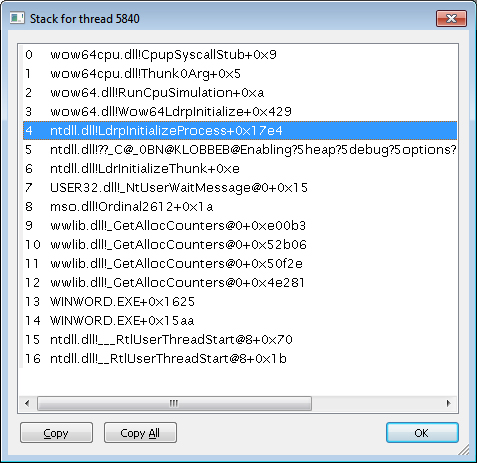
Finally, when looking at 32-bit applications running on 64-bit systems as a Wow64 process (see Chapter 3 for more information on Wow64), Process Explorer shows both the 32-bit and 64-bit stack for threads. Because at the time of the system call proper, the thread has been switched to a 64-bit stack and context, simply looking at the thread’s 64-bit stack would reveal only half the story—the 64-bit part of the thread, with Wow64’s thunking code. So, when examining Wow64 processes, be sure to take into account both the 32-bit and 64-bit stacks. An example of a Wow64 thread inside Microsoft Office Word 2007 is shown in Figure 5-13. The highlighted stack frame and all stack frames below it are the 32-bit stack frames from the 32-bit stack. The stack frames above the highlighted frame are on the 64-bit stack.
As we discussed in the process internals section, protected processes have several limitations in terms of which access rights will be granted, even to the users with the highest privileges on the system. These limitations also apply to threads inside such a process. This ensures that the actual code running inside the protected process cannot be hijacked or otherwise affected through standard Windows functions, which require access rights that are not granted for protected process threads. In fact, the only permissions granted are THREAD_SUSPEND_RESUME and THREAD_SET/QUERY_LIMITED_INFORMATION.


