AN IMPORTANT ASPECT in the overall assessment of a company’s financial position is its sources of finance and the performance measures applied by investors. The statement of financial position is a good starting point for seeing how a company is financed: the proportions of the total capital employed provided by shareholders and other sources of finance.
Equity and debt
A statement of financial position has three broad classifications of liabilities: equity (shareholders’ or stockholders’ funds), non-current liabilities (long-term creditors) and current liabilities (short-term creditors). These reflect the three potential sources of finance open to any company. Finance can be raised from shareholders, through long-term or short-term borrowing, or through the management of working capital. The raising of any form of finance – debt or equity – is completed by means of a “financial instrument”.
The shareholders’ contribution to the finances of a company may be given a variety of names:
- equity;
- net worth;
- net assets;
- capital and reserves;
- shareholders’ (stockholders’) funds.
Equity is the term most commonly used to identify the ordinary shareholders’ investment in a company. The balance sheet figures for equity may include preference shares or other non-voting shares a company has in issue, but such shares should not be included in the definition of equity. Equity and any equity instruments have a “residual interest in the assets of an entity that remain after deducting its liabilities”.
Any finance other than equity is referred to as debt, which can be divided into long-term and short-term borrowings and creditors. Borrowings with a life of less than one year appear within current liabilities and are short-term. Long-term borrowings appear as part of non-current liabilities. A note will detail their date of repayment and interest rate.
Equity shares provide a company with long-term finance. They are not normally redeemable and have no guarantee of income, through the payment of dividends, attached to them. Debt is normally borrowed for a fixed term with a fixed rate of interest. With debt, interest charges have to be paid and at some time the money borrowed will have to be repaid. With equity there is no expectation of capital repayment and any dividend paid is under the control of the company. The relationship between debt and equity is crucial to an appreciation of the financial structure of a company and its viability.
Leverage or gearing
Raising finance from external sources increases a company’s risk because, in the case of loans, there is a cost (interest) and an obligation to repay the loan. If it is a convertible loan, it can reduce the degree of control that existing shareholders have over the company when new shares are issued. In the UK and the US companies are mainly financed by shareholders. In France, Germany and Italy it is mainly banks that provide corporate capital.
The relationship between debt and equity is referred to as leverage or gearing. Management should make sure that the balance between debt and equity finance is appropriate for the business being conducted. Too much debt and a company is said to be highly geared; a low-geared company is financed mainly by its shareholders. The higher the level of debt in relation to equity the greater is the potential risk to shareholders of not receiving a dividend or getting back the capital they have invested. Interest on debt must be paid before any dividends, and all borrowings must be repaid before anything becomes available for shareholders.
Debt/equity ratio
The relationship between internal (equity) and external (debt) sources of finance can be expressed as a percentage or a ratio: the debt to equity ratio.
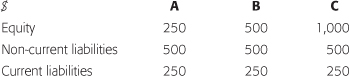
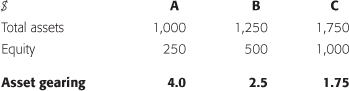
Debt/equity ratio = (non-current liabilities + current liabilities) ÷ equity
For the three companies the debt/equity ratios are:
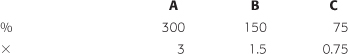
The debt/equity ratio is the most commonly used measure of the relationship between internal and external finance. Company A with equity of $250 and debt of $750 has a debt/equity ratio of 3 or 300%. This can be interpreted as indicating that for every $1 of shareholder investment in the company, outside borrowings and creditors provide $3. Company C has only $0.75 of debt for every $1 of equity. Thus company A is the most highly geared company.
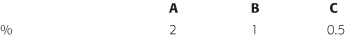
Another approach is to take the long-term borrowings – to be found in non-current liabilities – as the numerator and add it to the equity as the denominator to provide a long-term debt ratio.
Long-term debt ratio = long-term borrowings ÷ (long-term borrowings + equity)

It is to be expected that equity outweighs long-term liabilities – the ratio is less than 1. If the ratio is greater than 1, lenders have more of a stake in the company than the shareholders.
Non-current liabilities ÷ equity
Defining debt and equity
There is no standard definition of gearing, and there are often considerable practical difficulties in making the distinction between equity and debt. Although a debenture or bank loan is clearly part of debt, how do you classify a convertible loan, which carries a fixed rate of interest and is capable of being repaid on an agreed future date or of being converted into equity shares?
Using the balance sheet and its notes it is possible to identify all of a company’s long-term and short-term borrowings. What remains are other non-current liabilities – including taxation and provisions – and other current liabilities – including trade payables, taxes payable and provisions. You may use these refined figures of debt and equity in any analysis. A sound rule in financial analysis is to be conservative; when in doubt, treat an item as debt.
The time for which debt is scheduled for repayment is an important factor influencing the interpretation of any gearing ratio. Any borrowings not scheduled for repayment within one year are included in debt. A company not required to repay loans for five years may be viewed differently from one where repayment will take place in two years. The gearing ratios of the two companies may be identical, but the underlying implications are different. The notes accompanying the financial statements will provide details of debt repayment terms and their interest rates.
Off-balance-sheet items
When a company raises finance or acquires assets and there is no identifiable change in the balance sheet, it is referred to as an off-balance-sheet transaction. There is nothing new in off-balance-sheet items: just because a transaction is not reflected in the balance sheet does not make it automatically suspect. Off-balance-sheet items caused considerable concern in the 1990s, as financial experts offered a range of such items to assist companies reduce the disclosure of costs and the risks of finance. They followed precisely the requirements of GAAP and accounting standards but failed to show the real picture.
Joint ventures are a good example of the potential for off-balance-sheet financing. Two companies (X and Y) set up a joint venture, and each invests $100 in the new company (Z) for 50% of the equity. They jointly act as guarantors for a bank loan of $1,000 to set Z up in business. The balance sheets of X and Y show only the $100 investment in the joint venture. The liability for the loan of $1,000 does not appear; it is an off-balance-sheet item. The figure of $100 will increase under the equity method of valuation as X and Y make further investments in Z or the joint venture begins to make a profit. Each company takes 50% of Z into its balance sheet.
The greater the assets and the lower the liabilities in a company’s balance sheet, the happier everyone is. A bank lending money to a company will want to minimise the risks involved; it may stipulate a maximum level of debt to equity (gearing) for the company. If the company exceeds this level, the bank can require the loan to be repaid immediately. Similarly, analysts, as a simple measure of creditworthiness, may set “safe” levels of gearing that the company should not exceed. In such cases there is pressure on management to minimise the liabilities appearing on the face of the balance sheet. For companies X and Y, in effect their level of debt has increased by $500, but there is no evidence of this in their balance sheet gearing ratios.
Accounting standards have significantly limited the scope for off-balance-sheet manipulation. Legislation has also played a part. The US has the Sarbanes-Oxley Act, and from 2008 UK companies were required to disclose the potential impact of off-balance-sheet items (Companies Act 2006). Where such items are found to exist they should be included in the definition of a company’s debt for the purpose of analysis. The IASB and the FASB have improved the reporting of off-balance-sheet items with IFRS 10, 11 and 12 and SFAC 166 and 167.
A simple measure of a company’s gearing is provided by the debt ratio.
Debt ratio = total debt ÷ total assets
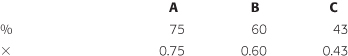
The debt ratio can be calculated either directly from the balance sheet or from a common size statement. The higher the ratio the higher is the gearing. A ratio of 50%, commonly viewed as the limit for accepting without question a company’s level of gearing, indicates that for every $1 of assets 50¢ has been financed by long-term and short-term debt. Using this guideline, company A is highly geared with 75% of total assets financed by debt, whereas company C is low geared at 43%.
Interest cover ratio
Interest paid on debt is charged as an expense before arriving at the profit for the year attributable to shareholders. An increase in external borrowings brings higher gearing and a greater interest charge in the income statement. Once a loan is taken, the interest payments must be made in cash and the capital sum repaid on the agreed date. A company not generating enough profit to cover interest payments or having insufficient cash available to repay the loan faces serious difficulty.
An effective ratio for combining profitability with the impact of gearing is interest cover. This measures the ability of a company to generate sufficient profits to allow all interest on borrowings to be paid. It is calculated by dividing the profit before interest and tax (PBIT) by the interest charge for the year. The figure for PBIT should exclude any exceptional or extraordinary items, and so represent the profit being generated from regular trading operations.
Interest cover = profit before interest and tax ÷ interest paid
The figure for interest used in the ratio should be that due for payment during the financial year, and care should be taken to add back to the figure appearing in the income statement any interest that has been capitalised or interest received that has been deducted. This information will be found in the notes accompanying the income statement or the statement of cash flows.
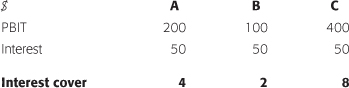
The higher the interest cover the lower is the risk that there will be insufficient profit available for payment of dividends to shareholders. Company C has the highest interest cover; profit could decline by eight times before it would be unable to cover the interest due on borrowings. The comparatively high interest cover of C is due partly to its profitability and partly to its gearing: C has the lowest gearing.
Interest cover can be used to assess the impact of changes in profitability on the risk of shareholders not receiving a dividend. For B a 50% decline in profit would result in there being nothing available for the payment of dividends; every $1 of PBIT is required to pay interest. In the same circumstances and ignoring tax, A would have $50 and C would have $150 available for the payment of dividends.
Attractions of high gearing
Simple arithmetic supports a decision by a company to take advantage of outside sources of finance. Shareholders will clearly benefit if a loan bearing a 5% interest charge is invested in the business where it is expected to generate a 10% rate of return. For no increase in their investment shareholders’ return improves, through either increased dividends or capital growth, or a combination of the two.
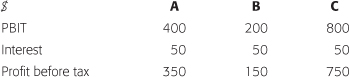
The situation where there is a 50% decrease in profits has been considered, but what happens when profits double? Profit, subject to tax, becoming available to the shareholders of B increases by $100 and interest cover moves from 2 to 4 times ($200 ÷ $50).
When a company is confident that the costs of external borrowings can be covered through the increased profit flowing from the investment made in the business, it makes sense to increase gearing. An added incentive for debt is that interest is normally tax deductible but dividends are not. High gearing increases the risk associated with the investment, but it can provide shareholders with high returns.
Asset gearing and return on equity
In Chapters 6 and 7 the Du Pont Chart was used to analyse profitability and efficiency. The profit margin and asset turn were combined to generate a rate of return on assets employed. The same approach, using after-tax profit, can be used to calculate return on equity (ROE) – a key performance indicator for any company.
Return on equity = (after-tax profit ÷ assets) × (assets ÷ equity)
With a little expansion this model can be highly effective in assessing the impact of gearing on a company’s ROE.
How a company’s assets are financed can be reviewed with the asset gearing ratio, sometimes referred to as the equity multiplier. This is directly linked to the debt ratio and identifies what proportion of the assets or capital employed is provided by shareholders. Assets may be defined as total assets or in any manner you intend to use consistently in your analysis – tangible operating assets (ROTOA) or net operating assets (RONOA).
The impact of gearing can clearly be seen; the higher the gearing the higher is this ratio.
Asset gearing = assets ÷ equity or
Equity gearing = (debt + equity) ÷ equity
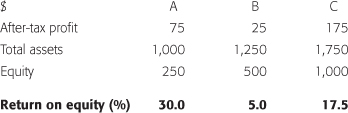
Company A’s shareholders are supporting only one-quarter of the total assets employed in the business. For each $1 of equity in company A there is $3 of debt and creditor finance ($750 ÷ $250). Company C shows only $0.75 ($750 ÷ $1,000). This can be viewed as the multiplier working for shareholders to increase the profitability of their investment. Any interest payable has been deducted in arriving at the after-tax profit. If two companies have the same total assets and after-tax profit, the one with the greater asset gearing will show the higher ROE.
Financing a business with debt can increase shareholder returns. For every $1 of equity in company A there is $4 of assets. This acts to increase the profits available to shareholders. For company A, if the after-tax profit margin (7.5%) is multiplied by the asset gearing ratio (4), the result is the ROE (30%). Company C has a higher profit margin (8.75%) but a lower asset gearing (1.75) producing a 17.5% ROE. Return on equity can be seen to be the end result of three ratios.
ROE = (profit ÷ sales) × (revenue ÷ assets) × (assets ÷ equity)
Assuming that sales revenue for all three companies is $2,000, the ratios are:
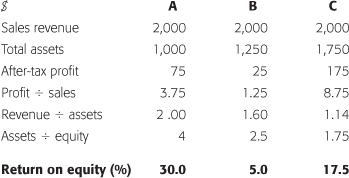
If B and C increased their gearing level to that of company A (4), ROE would rise to 8% for B (1.25 × 1.6 × 4) and 40% for C (8.75 × 1.14 × 4). This illustrates the impact of gearing on shareholder returns.
This combination of ratios offers an effective tool to aid the analysis of a company’s rates of return and financial structure. Capital structure measures are combined with the ability to produce profit (profit margin) and to use assets to generate revenue (asset turn). It can also be used to assess the implications of any likely changes in the business – what happens if profit margin declines and gearing increases?
Dangers of high gearing
The more a company relies on debt the less control it has over its finances and the more it is at risk. A highly geared company may find that lenders are less likely to accept changes in the terms of a loan agreement than shareholders are to accept a lower or even no dividend as the company runs short of cash or needs money to invest in assets.
High gearing can bring high volatility in the level of profit available to equity shareholders. For a highly geared company, a small movement in profit can have a dramatic influence on equity earnings. A small decline in profit may result in the company having to use all of its profit to service debt rather than pay dividends.
When business is booming, a company may regard an increase in gearing as not only attractive but also essential. It can be seen as a sign of poor financial management not to borrow more to achieve returns greater than the cost of the borrowing. During times of inflation, when the real cost of debt decreases, the pressure can be irresistible. However, if the boom slows and/or ends in recession, a highly geared company faces difficulties as profits decline, interest rates rise and loans fall due for repayment.
The problems that many banks encountered in the 2008 financial crisis provide a further illustration of the potential problems associated with high gearing. Suppose company A found that 10% of its total assets ($1,000) – subprime mortgages – had become valueless. The assets’ carrying value becomes $900 and shareholders’ funds are reduced to $150. The debt ratio moves from 75% to 83% ($750 ÷ $900) and the debt/equity ratio from 4 to 5 times ($750 ÷ $150), now showing the company in a somewhat different light.
A further danger inherent in high gearing is that as the providers of debt see gearing rise they may, to reduce their own exposure, insist that certain restrictions are built into the loan agreement, such as an upper limit for gearing or tougher levels of interest cover or liquidity. The company loses some degree of control and flexibility of approach in its financial management. If it breaks the loan restrictions, it may be held in default and forced to make immediate repayment.
Share price and value
Shares are normally issued at a par value. The par value of a share is the nominal value at which it is issued and appears in the balance sheet. A company may issue 25¢ or $1 shares and this, rather than the market price, is the value consistently used in the balance sheet. When shares are issued at a price higher than par value the difference is shown in equity as share premium or capital in excess of par value. The par value of a share has no relevance to financial analysis. In the US, it is common for companies to issue shares of no par value.
In general, share prices reflect views of the future rather than the mainly historical perspective presented in an annual report. A balance sheet should not be expected to reflect the market price of shares. It is the share price quoted on the stock exchange that determines the value of an investment. Share prices and price movements of the previous day are given in the media together with the high and low points for the year.
Many factors can influence a company’s share price. Some are clear and quantifiable; others are more esoteric and ephemeral. A company issuing a profit warning can expect a drop in share price. Rumours of a takeover, a technological breakthrough, changes on the board, a big order or a lost one can all influence share price. Share price will partly reflect the general mood of the market, which is in turn linked to the national and global, economic, political and social environment. General optimism produces a bull market (one in which share prices are rising) and pessimism a bear market (one in which share prices are falling).
There can be only one indisputable answer to the question: why did the shares go up by 5% yesterday? It is, as any market trader knows: because there were more buyers than sellers.
The prime trigger for a movement in share price is a change in investors’ confidence in the ability of a company to produce profits in the future. Shares may have been purchased on the basis of the past performance of a company, but they are held in expectation of future returns: income and capital gain. The sector in which a company operates can also influence share price. If it is one that is seen as being static, this will hold back the share price, whereas the reverse is true for a dynamic or glamorous sector.
Each stock exchange has its own share price indicator. In the UK, the FTSE 100, commonly referred to as the Footsie, includes the share prices of the largest 100 listed companies. This is a good real-time indicator of the market; a rise in the FTSE can be taken to indicate a general upward movement in share prices. The US has the Dow Jones and NASDAQ, France the CAC General, Germany the DAX and China the Shanghai Composite.
Betas
For any given period, movements in both a company’s share price and a selected stock-exchange index can be plotted to give an indication of the sensitivity of the company’s share price to general movements in the market. This relationship is termed the share’s beta – the beta rating, beta factor, beta coefficient – and it provides a measure of the volatility of a share relative to the market. In the UK the FTSE 100 or the FT All-Shares index is used; in the US it is the NYSE Composite (all stocks on the exchange). The statistical analysis supporting the calculation of betas is complex. You are unlikely to be involved in calculating a beta; all you need to know is what it is meant to indicate.
Both income and capital gains from each share are compared with the return from the selected market index over a number of years. Betas are incorporated into the capital asset pricing model (CAPM), which can be used to quantify the cost of a company’s equity. The market’s beta is 1. If a share moves precisely in tune with the market it will have a value of 1.0. This, by definition, is that of the average company.
If it was found that for every 1% move in the market a company’s share moved 1.5%, applying the 1.5 factor to the market index should provide an indicator of the likely price of that company’s shares. A beta of 1.5 suggests that for every 1% move in the market the share will move 1.5%. If the buoyancy of the market is directly linked to expectations for the economy, companies with high betas are likely to be directly affected by boom or doom. With a sound economy high-beta companies can be expected to generate extremely good returns, but in recession they will probably be poor performers.
Cyclical stocks are likely to be high beta. For example, cars are more likely to be purchased during good times. There is a direct link between an investment’s potential return and its risk. A company with a low beta is likely to be little affected by changes in the economic environment. Government stocks or gilts have a beta of 0; the interest received is not affected by stockmarket fluctuations. Companies producing consumer goods that are purchased irrespective of the economic climate can be expected to have low betas.
The higher the beta – the greater the volatility – the higher will be a company’s risk premium. A risk premium may be seen as the compensation for uncertainty or the extra return an investor can be expected to require to invest in the share. Low-risk (low-beta) shares will attract little or no risk premium. If the average risk premium – market risk premium (MRP) – is 5% and the company has a beta of 1.5, its shares can be expected to have a 7.5% (5 × 1.5) risk premium.
Net asset per share and market to book ratios
If a company is wound up and the assets are sold for their balance sheet values, after all external liabilities are settled what remains – net worth or net assets – is all that is available to repay equity shareholders. It is therefore worth calculating the net asset per share ratio to get an idea of the value of the assets supporting the share price. The higher the assets per share the lower is the shareholders’ risk.
Asset backing = net assets ÷ number of shares in issue
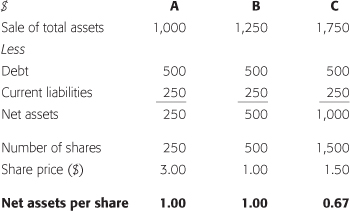
If the assets are shown at their fair value, the net asset value (NAV) per share can be taken as a reasonable starting point to estimate the amount to be received for each share held in the company if it were liquidated.
For most companies, net asset backing per share will be lower than the current share price for the simple reason that there should be more to a company than just the book value of its assets. The same will apply when the total stock-exchange value – the market capitalisation or book value – of a company is set against the balance sheet value of net assets. This will provide the “market to book” or “price to book” ratio, which will normally be greater than 1. If this is not the case, it means that little value is being placed on expectations of growth or improved performance.
For major US companies before 2008, the ratio was close to 5:1 with only $1 of assets in the balance sheet to support $5 of stock-exchange value. Intangibles can be an important factor in this ratio. Typically, internet or dotcom companies have a low net asset per share but high market to book ratio.
Where the share price is lower than the net asset backing, this can be interpreted in a number of ways. It may be that the company has not been performing as well as others in the same sector and there is general agreement that this is likely to continue, with the result that there is little demand for the shares. Where the net assets per share are much higher than a company’s share price it may be seen as being past redemption, and almost certainly a target for takeover by someone who has spotted the chance to acquire assets cheaply. The 2008 financial crisis provided many examples of this.
Risk and the payback period
A simple and popular means of comparing investment opportunities is to calculate the payback period. An investment of $1,000 offering an annual income of $100 has a payback period of ten years. Another option might be to invest the $1,000 in a project offering a $200 annual income stream. A payback period of five years is likely to be more attractive than the first option: the shorter the payback period the better. Payback is used in investment project assessment and provides an indication of how long it will be before a project generates sufficient income to recover the capital investment. It takes into account the risk involved in the project. The longer the payback period the greater is the exposure to risk.
Finance and capital investment
The strategic report should outline the current level of capital expenditure together with an indication of future intentions for non-current asset investment and, ideally, that allocated to:
- marketing and advertising;
- employee training and development;
- research and new product development;
- maintenance programmes;
- technical support to customers.
This kind of detail can be helpful in assessing how a company could, at least for a short time, reduce expenditure while maintaining the level of its current operations. Almost any expense might be cut for a short time without an immediate negative impact on profit.
To check on the consistency of asset investment, use the asset replacement rate and capital expenditure turnover ratios (see Chapter 7). The first provides an indication of the speed with which a company is replacing tangible assets, and the second links investment to turnover. Sudden shifts in these ratios can indicate a decision to reduce or halt investment in productive assets in an attempt to maintain liquidity or because finance has been refused.
The way in which capital investment projects are financed is worth investigation. The timescale of the planned investment should match that of the finance being applied. A company using short-term sources of finance to build a factory or make a long-term investment is more likely to run into difficulties than one using long-term finance.
You should expect finance for long-term assets to come from equity or long-term borrowings and for working capital to come from short-term loans or similar sources (see Figure 9.1). The annual report should make clear the link between borrowing requirements and capital expenditure plans.
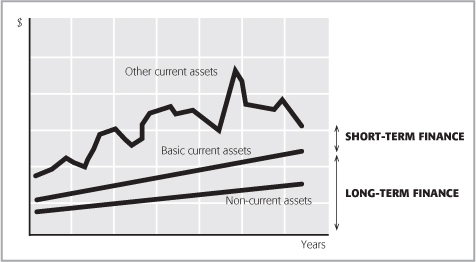
What you generally want to see is some consistency in the debt/equity balance and when finance is raised that it is being productively employed in the business. A simple source and application analysis of the balance sheet can give an insight into where funds are coming from and where they are employed in the business. A simple rule of financial management is that a company’s long-term investment in assets should be financed from long-term sources. There should be a match between the length of time funds are tied up in investment and their repayment terms.
Peak borrowings
The annual report should include some discussion on cash flow linked to the statement of cash flows and liquidity. This can prove particularly useful where the cash flow generated from business segments is different from the profit disclosed for them in the segmental analysis report.
The annual report should make it possible to appreciate the level of a company’s borrowings throughout the year not just that at the balance sheet date. That a company may have approached, or indeed exceeded, its borrowing limits during the year is an important factor in the assessment of its current financial position and future viability.
Price/earnings ratio
A company’s earnings per share (EPS) can be incorporated in an equivalent to the payback measure: the price/earnings (P/E) ratio. Share price is dependent upon investors’ opinions of a company’s future earning potential as much as anything else. EPS (as last reported) can usefully be linked to current share price to provide some indication of expectations for future performance.
Price/earnings = share price ÷ earnings per share
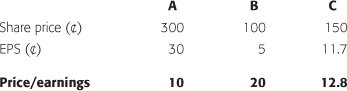
For company A the P/E of 10 can be interpreted as showing that when a share is purchased for 300¢ this represents the equivalent of ten years’ earnings of 30¢ a year – in other words, a payback period of ten years.
The higher the P/E ratio the greater the confidence investors have in the future prospects and performance of the company. A high P/E ratio indicates investors have confidence that the company will maintain and probably improve its current performance in the coming year.
High or low price/earnings?
The only way of deciding whether a company has a high or a low P/E ratio is to compare it with other companies. Companies are listed in the financial media by their sector of operation. The company with the highest P/E ratio is considered, on that day, to be the sector’s best future performer for investors.
As EPS is dependent upon share price, the P/E ratio is influenced by forecast trends, rumours or myths of the moment. It is not unusual for the company with the highest ratio one year to be the first in the sector to succumb to recession or mismanagement. By definition, a high P/E ratio indicates that it is probably too late to invest in the company since the price to be paid will be too high. It may also indicate that a company is already overvalued. Experience suggests that the only way for a high P/E to move is downwards.
Prospective price/earnings
If a forecast is made of a company’s likely future profits, this can provide a figure for likely future EPS. If company A is forecast to have a profit growth of 10% in the coming year, after-tax profit will rise to $82.50 ($75 + $7.50) and EPS to 33¢. If the current share price is divided by forecast earnings (300 ÷ 33), a prospective P/E ratio of 9.1 is produced. This prospective P/E is the product of arithmetic and is not influenced by real life.
If any item is left as unknown in the equation below, it is easy to discover its value.
Share price = earnings per share × price/earnings ratio
300 = 30 × 10.0
330 = 33 × 10.0
300 = 33 × 9.1
For company A, where only one variable in the equation is adjusted, EPS is forecast at 33¢ and the share price rises to 330¢. If the share price is held at 300¢, with 33¢ EPS the P/E ratio moves to 9.1. Prospective P/E ratios can only be estimated, but once some forecast is obtained for profit and P/E it can be used to indicate likely future share price movements. If for company A EPS is forecast at 33¢ and it is considered that the company should command a P/E ratio of 12, the likely future share price can be calculated as follows.
Future share price = forecast earnings per share × prospective price/earnings
396 = 33 × 12
Problems with price/earnings ratio
In most cases, the P/E ratio being used in analysis is that provided by the media, not one calculated by the user. This can cause problems. The profit used as the basis for a published P/E ratio is normally that shown in a company’s income statement and it may therefore have been arrived at creatively. Furthermore, one side of the equation is historical profit, which is not guaranteed to be a guide to future performance, and the other side is current share price, which changes from minute to minute on the stock exchange. A rumour of takeover or a major technological breakthrough in product development will not alter historical earnings, but it will certainly have an effect on the share price.
Dividends
Companies normally make two dividend payments per year: an interim payment based on half-year profits and a final payment at the end of the year. These will appear in the statement of shareholders’ equity and the statement of cash flows.
Investors see dividends as an indicator of current performance and future profits. An increased dividend signals that a company’s directors consider performance and prospects to be good. Dividends also act as a signal to the market. Good news, indicated by an increase in dividend, usually triggers a rise in share price and bad news the reverse.
The strategic report should provide some information about dividend policy and shareholder returns. It must be accepted, however, that it is difficult for companies to commit themselves to a predetermined dividend level. Next year the profit may drop, and for a variety of reasons the company may wish to move away from its previous dividend cover or payout level (see Chapter 6 and below). Many factors, other than profit, can influence the dividend decision, including the requirements of major institutional shareholders, how confident directors are that profit will improve quickly, general market expectations and what other companies are doing; if they are maintaining dividends, it may be difficult for one company to break the trend.
Dividend per share
The dividend per share (DPS) can be calculated using the same denominator as earnings per share. The total dividend for the year is divided by the weighted average of the number of shares in issue.
Dividend per share = dividend ÷ weighted average number of shares in issue
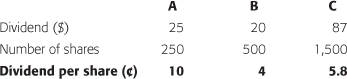
Remember, as with EPS, that it is not possible to directly compare different companies’ DPS. Companies with an identical dividend but different share structures will not show the same DPS.
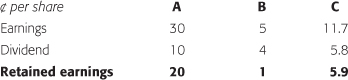
Retained profit per share
When the profit for the year attributable to equity shareholders is known, the next step is for the directors to decide what the dividend should be and how much of the profit should be retained for use by the company. If the dividend per share is deducted from the earnings per share (see Chapter 6), what remains is the retained profit per share for the year.
Retained profit per share = earnings per share – dividend per share
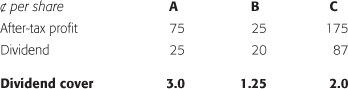
Dividend cover
If after-tax profit attributable to ordinary shareholders is divided by the dividend, the result is the number of times the dividend was covered. As with interest cover, the higher the dividend cover ratio the better or safer is the position of a company. However, levels of what is considered acceptable cover vary across business sectors. If a company is operating in a sector that is reasonably unaffected by economic downturns, such as food manufacturing and retailing, a lower dividend cover ratio is more acceptable because the risk is lower.
Dividend cover = after-tax profit ÷ dividend
= earnings per share ÷ dividend per share
Payout ratio
Another way of looking at the safety level of dividend payments is to show what proportion of profit is being distributed to shareholders.
Payout ratio = 100 ÷ dividend cover
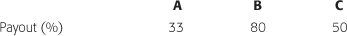
The higher the payout ratio the lower is the dividend cover; the level of profit cover for dividend is just being expressed in a different way. A company with a high payout ratio is not retaining profit to reinvest in the business. You should always try to discover why. Is management not confident about the future prospects of the business, or are they taking a short-term view and keeping shareholders happy with a dividend payment rather than providing for future long-term growth? The reverse of the payout ratio is the retention ratio.
Gross dividend
Companies deduct tax and make a net dividend payment to shareholders. To allow comparison with other investment opportunities, tax should be added back to produce the gross dividend per share. Company A has a dividend of 10¢ per share. If the tax rate is 0.2 (20%), the gross dividend is 12.5¢; 2.5¢ covers the basic rate tax and 10¢ is paid to shareholders.
Gross dividend = dividend ÷ (1 – tax rate)
Earnings yield
To obtain some indication of the return flowing from an investment, the current share price and earnings per share can be combined to give the earnings yield.
Earnings yield = 100 × (earnings per share ÷ share price)
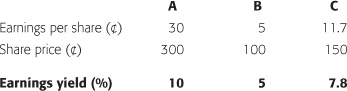
Earnings yield is not an indicator of the actual return on investment. It is based on earnings per share not the dividend received by shareholders. If the P/E ratio is known, it is simple to calculate the earnings yield – it is the reciprocal of the P/E ratio. Company B with a P/E ratio of 20 has an earnings yield of 5 (100 ÷ 20) and company C 7.8 (100 ÷ 12.9).
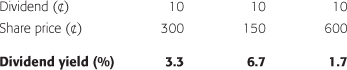
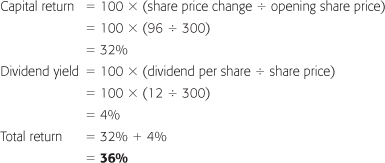
Dividend yield
Dividend yield links the current share price to the dividend received.
Dividend yield = 100 × (dividend per share ÷ share price)
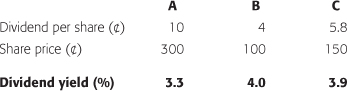
Movements in share price bring about a change in the dividend yield. As the share price changes there is an automatic adjustment in dividend yield, as illustrated below for company A, whose share price moves between 150¢ and 600¢.
Shareholders’ return
The return shareholders expect from their investment is a combination of the capital gain flowing from an improvement in share price and the income from dividends – total shareholders’ return (TSR).
A change in share price is part of the total return on shareholders’ investment. To calculate the current or the likely future TSR, the capital gain and the dividend yield can be combined. If company A’s share price is forecast to rise to 396¢ and the dividend per share to 12¢, then the likely future return can be estimated as follows:
Valuing companies
There is no simple way of arriving at the value of a non-quoted company. It is often necessary to do so not only to agree a price for a company’s sale, but also to meet government requirements to place a value on a deceased person’s estate for tax purposes. The annual report can be used as a basis for valuation; the statement of financial position offers comprehensive details of a company’s assets and liabilities. The value of assets – fair value – shown in the statement can be used; but as the statement is not intended to offer a valuation, it can only be a rough guide.
Free cash flows, EBIT or EBITDA can form the basis of a rough and ready valuation. A company’s cash flow or profit is multiplied by an appropriate factor to produce a value. It is possible to find on the internet suggested multiples for a variety of types and sizes of businesses. The multiple will always depend on a guesstimate as to what is appropriate for the company and its type of business.
The ideal would be to use discounted cash flow techniques to provide a valuation. Unfortunately, for most companies, the possibility of obtaining accurate forecasts of future cash flows is low. The only time there can be an accurate and indisputable value for a company is when it has just been bought or sold. At other times its value is an estimate based partly on science and partly on art.
Capitalisation
If a company’s shares are quoted on a stock exchange, there is a ready source of data upon which to base a valuation. Multiplying the current market price of a share by the number of shares in issue provides an indication of the company’s current stock-exchange value. This is its market value, or the capitalisation of the company.
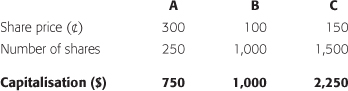
Company A has a capitalisation of $750. If you wanted to acquire the company, $750 is probably a better guide to the price to be paid than, say, total assets ($1,000) or equity ($250) in the balance sheet.
The financial media publish capitalisation figures for companies daily or once a week. This provides a basis for the comparison of the size of companies according to current stock-exchange values. In practice, if you decided to acquire A, as shares began to be purchased market forces would bring about a price rise. The capitalisation of $750 offers a guide to the minimum likely price for the company.
Earnings multiple
To calculate a company’s capitalisation, after-tax profits can be multiplied by the P/E ratio. Company A has a P/E ratio of 10 and after-tax profit of $75, the product of which is the $750 capitalisation.
Capitalisation can be readily produced only for quoted companies. To calculate the value of a non-quoted company, you can use the P/E ratios of stock-exchange listed companies operating in an appropriate business sector. The internet offers numerous sources of real-time share prices. Otherwise newspapers normally contain a business section where the previous day’s prices are published. The P/E ratio of three or four comparable companies or the sector average can be used as a basis for valuation.
Armed with an appropriate benchmark P/E ratio, it is possible to calculate a share price. For example, a company operating in a sector with an average P/E ratio of 16.66 has earnings per share of 5¢ but no quoted share price.
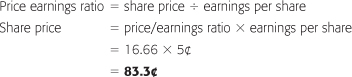
Using the average P/E ratio for the appropriate sector produces a suggested share price for the company of 83.3¢. In most cases it should be possible to identify one or two quoted companies that reasonably match the activities or spread of business of the company being valued.
After-tax profit versus earnings per share
In the previous section the company’s shares were valued at 83.3¢ using the sector average P/E ratio of 16.66. The basis of the valuation is the after-tax profit generated by the company and attributable to equity shareholders. This is not affected by the number of shares in issue or, ignoring tax implications, by dividend policy. It is therefore better and much simpler to use this as the basis for valuing non-quoted companies.
If the after-tax profit is $25 and this is multiplied by the 16.66 P/E ratio, the result is $416, which when divided by the number of shares in issue (500) gives the same share price of 83¢. It is easier and more practical to use $416 as a value for the company, but the individual share price may be important if shares are being transferred between family members in a private company.
Investing in a small private company is usually considered more risky than buying shares in a quoted company. To compensate for this, the P/E ratio used in valuing a private company may be adjusted by an appropriate amount, referred to as the risk premium. If the P/E ratio selected is 16.66 and a 35% risk premium is considered applicable, the multiple to be applied to value a company is 10.8 (16.66 – 35%). If the company has after-tax profits of $25, applying the 10.8 multiple gives a value of $270 and a share price of 54¢ ($270 ÷ 500).
Further problems are encountered if only a proportion of a company’s equity is being valued. In this case the method detailed above can be used with discount factors applied to the multiple according to the quantity of shares involved. A 5% block of shares might be discounted by 60%, but if 51% of a company’s shares are being acquired the discount might be only 10–20%.
The average P/E for the appropriate sector can be used, but in most cases it should be possible to find at least one suitable company to use as a basis for direct P/E comparison. A simpler alternative, for UK companies, is to use the FTSE Actuaries Share or Sector Indices. If there are no obvious sources of P/E ratios, a rule of thumb is that a multiplier of 10 should be applied to after-tax profits to provide an indication of company value. Where a company is making a loss, sales revenue multiples may be used.
Dividend valuation method
If it is assumed that the value of a share is the present value of its future dividends, then dividend can form the basis for valuing a company. The basic formula is:
Value = (dividend × (1 + dividend growth) ÷ (required return – dividend growth))
An appropriate discount factor can be applied to give the present value of the anticipated dividend stream. If the current dividend of a company is 6¢ per share, dividend growth is expected to be 5% per year and shareholders require a 15% rate of return, a share in the company can be valued at 63¢.
Value = (6.0 × 1.05) ÷ (0.15 – 0.05) = 6.3 ÷ 0.1 = 63¢
Government bonds and rates of return
Investors can be assumed to look for different rates of return linked to the risk of a given investment opportunity. The lower the risk the lower is the required rate of return. The rate of return investors require has a direct influence on the cost of a company’s capital. The higher the risk the higher is the rate of return required, and the more it costs a company to service through dividend and interest payments the finance provided. A good starting point is to look at returns from risk-free investments.
It is generally accepted that lending money to the government is risk free, as the interest rate and maturity date are fixed and certain. Thus the return from government securities can be regarded as that required from a risk-free investment. Investors in other securities, such as equities, require an additional return to compensate for the additional risk. This is called the risk premium. Using non-redeemable bonds, the interest yield can be calculated in a similar way to that of dividend and earnings yields.
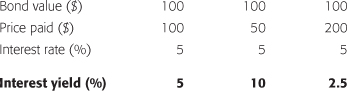
If investors see that the returns from alternative sources are greater than 5%, they may sell their bonds to take advantage of the opportunity. The sale of bonds brings about a reduction in their price ($50) and their yield increases to 10%. When bonds are seen as a better investment, the price rises to $200 and the yield falls to 2.5%.
The base bank rate of interest, quoted daily in the media, can be used as an alternative to government securities to provide an indicator of the risk-free rate of return.
Equities risk premium
As well as the risk-free rate of return, investors can reasonably expect a premium for the risk involved in investing in equities. The equity risk premium has normally been between 5–10% on both the UK and US stock exchanges.
An additional premium is required when considering investment in private, non-quoted companies, which are generally assumed to be a more risky investment than quoted companies. As a general rule, a minimum of an additional 25% premium should be added to compensate for the risk of unlisted company investment. Many valuation experts, however, suggest that the premium should be 30–40%.
Cost of capital
The view investors take of the risk associated with buying shares in a company determines its cost of capital. The higher the risk the higher are the expected returns and the higher is the cost of raising finance for the company. Before a company returns a profit it must cover its cost of capital. Interest on borrowed funds will have been charged before arriving at the profit for the year, but the company will not necessarily have made an appropriate allowance for the cost of equity capital provided by shareholders.
The cost of debt can be estimated from the financial statements. There will be notes providing details of the interest rates applying to loans. The after-tax cost of borrowing $500 at 10% interest with a tax rate of 50% is 5%, and at a tax rate of 40% it would be 6%. Inflation reduces the real cost of debt financing. With a currency decreasing in value over time, the true rate of interest adjusts and so does that repaid at the end of the loan period. Calculating the actual cost of borrowings for loan or convertible stock not issued at par is complex. For most purposes, it is adequate to take the interest rate quoted as being an acceptable approximation of the actual real cost.
There are many ways of estimating the cost of equity. One is to use dividend yield adjusted for the impact of tax. This is only an estimate as it does not take account of the fact that dividend rates may change and, of course, that share prices change from day to day. A simple adjustment to allow for some rate of growth could be applied to the dividend yield, or the earnings yield could be used. The higher the P/E ratio the lower is the earnings yield. A high P/E ratio infers that investors have confidence in the future performance of the company so the cost of raising finance will be lower; of course the reverse also applies.
Investing in new and untested technology can offer huge returns if it is successful, but there is also the possibility of the investment having to be written off, so a high risk is involved. If investors are to be attracted to the investment, they must have some incentive. The cost of equity is the return required by investors to provide capital to a company; the higher the perceived risk of the company the higher is the cost of capital.
The CAPM offers an approach to calculating the cost of equity for a company.
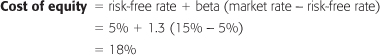
With a risk-free rate of return of 5% and a market rate of return of 15%, the equity risk premium is 10%. A company with a 1.3 beta has an estimated cost of equity of 18%. If the company had a beta of 2, the cost of equity would rise to 25%.
Another way of arriving at an approximation of the cost of capital is to take a simple weighted average for equity and debt. The cost of debt is taken as the interest rate applying to each item and the cost of equity as the dividend yield.
Where a company is financed 50% by debt, requiring 10% interest, and 50% by equity, requiring a 20% return, the weighted average cost of capital (WACC) is 15%.
- The debt/equity ratio is a well-tested and simple measure of the balance between the finance provided by equity shareholders and that derived from external borrowings (debt). Although the ratio may be subject to manipulation, it still provides the best starting point for an assessment of capital structure. The content of the denominator and numerator can be refined as appropriate. The lower the ratio the greater is the proportion of finance being provided by shareholders. A company with a low debt/equity ratio is said to be low geared.
- The debt ratio is helpful in interpreting the structure of a balance sheet. It shows what proportion of total assets has been funded by external sources of finance. For most businesses, when more than 50% of assets are debt financed it is advisable to complete a detailed analysis of the company and its likely future prospects before considering an investment. If only one measure of gearing were allowed, this would be the most attractive.
- Notes in the annual report will provide details of a company’s debt, showing for the next five years the amount, rate of interest and date when the borrowings mature or are to be repaid. At first glance these notes may appear overwhelming, but they are worth studying. A simple indicator of the likely demands to be made on a company’s future cash flow is created by taking the total annual interest charge and adding to it any capital repayments to be made for each of the next two or three years. Based on previous experience, does it look as if the company can meet these expected cash outflows without having either to sell assets or to initiate new borrowing?
- For shareholders, the efficiency of a company in making debt work for them is an important consideration. Shareholders’ return is a combination of profitability and gearing. Two ratios can be combined to highlight how return on equity is being achieved.
- The interest cover ratio is an effective way of linking the level of gearing with profitability. A company borrowing money to finance its operations must pay the agreed interest in cash each year. The greater the interest cover provided by pre-interest and pre-tax profit the safer is the company’s position. A high-geared company must guarantee to maintain a safe level of interest cover. A combination of high gearing and low interest cover is not a healthy sign.
- Similarly, the extent to which dividend is covered by profit is a useful indicator of the comfort or safety level for shareholders. The higher the dividend cover the greater is the proportion of retained profit being ploughed back into the company.
- A useful measure is to use cash flow as the basis for cash flow dividend cover. All interest, tax and non-equity dividends are deducted from operating cash flow and the result divided by the equity dividends. This ratio identifies the proportion of cash flow, after all external financing charges, available for equity dividends.
- Dividend per share should be combined with earnings per share in studying the historical record of a company. If earnings per share and dividend per share are plotted, the difference is the amount per share being retained in the business each year. Some consistency in the three figures should be evident.
- The financial media provide daily calculations of dividend yield and P/E ratios. When studying a listed company it is possible to make a direct comparison with the P/E ratios of similar companies, and to obtain some indication of the ranking given by investors. The higher the P/E ratio the higher are investors’ expectations of a company’s future performance.
- A company with a high P/E ratio is not necessarily a good investment. A high ratio indicates that the market has already taken into account the future prospects of the company and that it is probably already too late to buy.
- Published P/E ratios can be used to provide a valuation for non-listed companies. If the average ratio for the appropriate sector is found and applied as a multiplier to the after-tax profit of a company, the result is an indicator of total value.