THE THREE “E”S – efficiency, effectiveness and economy – provide the basis of value for money. The efficiency of a company can be defined as the relationship between the output of products or services and the input of resources necessary for their delivery. Quantified as a ratio of output to input, the efficiency of one company can be measured over time and compared with that of others. One of the main responsibilities of management is to make efficient use of the human, physical and financial resources available to a company. This chapter considers various means of measuring, assessing and comparing companies’ efficiency of utilisation of each of these three categories of resources.
Practical control of efficiency in companies must be carried out internally. It is the focus of management accounting rather than financial accounting and external reporting. In most cases information about the internal control systems of companies is not available to outsiders.
Human resource management
The total employee cost and number of people employed for the current and previous year will normally be found in the notes in a company’s annual report. A company’s website is probably the easiest to access source of any available employment statistics.
Problems of definition
It may seem unlikely that it should be difficult to define the number of employees of a company, but unfortunately it is true. In the annual report a company may define the number of employees as being any of the following:
- the average number employed during the year;
- the number employed at the end of the year;
- the total number of full-time and part-time employees;
- the number of full-time equivalent employees.
A full-time equivalent (FTE) is produced by dividing the total number of hours worked by all employees by the standard number of hours in the selected working period: a week, a month or a year. This definition is popular in the retail, hotel and catering sectors and in other organisations where large numbers of part-time workers are employed. If the standard contract is to work 35 hours per week for 47 weeks per year (5 weeks allowed as holiday), the FTE is 1,645 hours per year. An employee working 4 hours per day for the 47 weeks counts as 0.57 FTE.
20 hours × 47 weeks = 940 hours per year
940 ÷ 1,645 = 0.57
When a number of companies are being studied in order to assess the comparative efficiency in the use of human resources, it is important as far as possible to use a common basis for the definition of the number of employees. In most cases, the figure for employees given in the annual report will be either the average number employed during the year or the number employed at the year end. A straight comparison between two companies based on an analysis where one provides a figure for average employees during the year and the other for year-end total employees is potentially misleading. However, when comparing a number of companies, particularly if they are located in different countries, there is often no other option.
Average remuneration per employee
Most companies provide a figure for the total wages and salaries paid during the year – employee benefit expense. If total remuneration is divided by the number of employees, the result is the average remuneration per employee.
Average remuneration = total wages and salaries ÷ number of employees
Where there are significant variations in average remuneration between companies in the same sector, first check (and this applies to all the ratios of efficiency in this section) to see if there is a difference in the definition of the number of employees. If this is not the explanation, further investigation is required to discover the reasons for the variation. One company may be operating in a different segment of the market or be based in a higher- or lower-cost employment area than another. It is not appropriate to use this ratio as a measure of efficiency to compare companies in different countries, but it may be of use in deciding where to locate a business.
The figure given for the total employee costs can be assumed to include the remuneration of a company’s directors since they are employees. Directors normally receive above-average pay, but it is unusual for this to result in the distortion of the average remuneration ratio for a major company; and, if necessary, you can subtract directors’ remuneration as it is given separately (see below).
Interpreting the figures
A company seen to be offering its employees well below what appears to be the norm for the sector or the national average wage for the country in which it is based may be efficient in the control of employee cost; but whether such a policy will prove to be in the best long-term interests of all concerned is questionable. In recent years, many companies defending their executive remuneration packages have reaffirmed their belief that “if you pay peanuts, you get monkeys”. There is no reason to assume that this is not equally true for the shop or factory floor.
When a business sector is being investigated, it may be useful to have some indication of the total numbers employed in it and the position of companies as employers. This can be achieved by preparing a table ranking the companies according to numbers of employees and calculating the total. From this the importance of an individual company as an employer within a sector, or of a sector as a source of employment within a country, can be highlighted. If employee figures for a number of years are available, then any employment trends by company or by sector can be identified.
The long-term view
Companies often choose to provide employee statistics as part of their five-year or ten-year record of financial performance. Where this information is available it can be used to study a company’s record as an employer. Over a number of years a company can be expected to show some consistency in its number of employees. If a company increases the number one year and reduces it the next, it may be exhibiting weakness. Management may not be in control of the business and may be unable to plot and follow a medium-term, let alone a long-term, action plan. In a company that relies on highly skilled employees to deliver its products or services, a hire-and-fire employment policy usually has a negative impact not only on employee loyalty and productivity but also, eventually, on the company’s financial performance.
Other sources of information
In addition to a company’s annual report, newspapers, magazines and journals can be useful sources of information. Large changes, either up or down, in a company’s employee numbers are often the subject of informed comment. Trade journals that cater for the business sector a company is in can also be helpful.
Sales revenue per employee
Having looked at the number of employees and their average remuneration, the next step is to consider employees’ contribution to the generation of sales revenue and profit. If sales revenue is divided by the number of employees, the ratio of sales revenue per employee is produced. This is a measure of the ability of a company to generate sales revenue on the basis of its employees.
Revenue per employee = sales revenue ÷ number of employees
This ratio should be calculated for a number of years to see the trend for the selected company. It is particularly useful when used to compare a number of companies operating in the same business sector. Companies can be ranked in order of their sales per employee, and, if data are available for a number of years, their relative and changing positions in the league table can be assessed.
Interpreting the figures
Differences between companies in the sales per employee ratio can often be explained by differences in their focus within a sector. A discount food retailer is likely to have higher sales per employee than a department store, and the rate for a fashionable boutique may be even higher. A labour-intensive goods manufacturer will have lower sales per employee than one with a highly automated plant. A construction company that subcontracts much of its work to other companies rather than undertaking this itself will have a much higher sales per employee ratio than one that does not subcontract. When studying a business sector, it is important to look at variations among companies in the level of this and other ratios and to try to explain any trends exhibited, both for individual companies and for the sector as a whole. A company may then be seen in the context of its business sector to be setting, following or matching the general standards of performance and trends.
Compare the ratios of sales and remuneration per employee. A company only just managing to earn enough revenue to cover its wage bill and associated employment costs will not be producing exciting rates of return. A company that cannot generate sales revenue per employee of at least double the average wage applying in its country of operation can be assumed to be if not already in trouble then certainly heading for it.
Profit per employee
Most businesses can be expected to strive to produce the highest level of revenue per employee possible, but it is profit rather than revenue that may be seen as the only true measure of efficiency. There is little point in generating revenue if this does not in turn produce profit. The ratio of profit per employee is a measure of the ability of a company to produce profit based on employees.
Profit per employee = profit ÷ number of employees
Chapter 6 discussed the importance of the selection of an appropriate profit from the income statement to produce a meaningful profit margin. The same issues are involved in the decision about which profit to use in the ratio of profit per employee. It is probably most effective to concentrate on the gross and operating profits per employee as measures of how efficiently a company is using its employees and the employees’ contribution to its overall performance and success.
Interpreting the figures
As with the ratio of sales per employee, the trends for both individual companies and the business sector should be studied. Individual company performance in profit per employee can be compared with the average or standard for the sector and year-by-year movements assessed. Significant one-off shifts in this ratio should be investigated to discover if they are the result of a change in the efficiency of a company or some other action or event, such as an acquisition or disposal of a labour-intensive subsidiary. Where possible, it is most effective to concentrate on the continuing business operations of a company and to ignore any exceptional profits.
Value added per employee
Chapter 6 dealt with using a value-added statement to investigate a company’s cost and expense structure and the way in which the corporate cake is divided among various interest groups. Value added can be defined as the difference between the revenue received by a company and the amount it paid for goods and services. It is easy to produce a figure for the value added per employee, and, as with profit per employee, the higher the ratio the better is a company’s performance.
Value added per employee = value added ÷ number of employees
Employee cost per unit of revenue or unit of value added
A third measure relevant to efficiency in the utilisation of employees can be produced by dividing the total employee cost by sales revenue and presenting it as a percentage. This produces the employee cost per unit of sales revenue.
Employee cost per unit of revenue = 100 × (employee costs ÷ sales revenue)
Value added may be used in place of sales revenue to produce a ratio of employee cost per unit of value added to indicate the proportion of value added of a company being devoted to employees.
The employee cost to sales ratio shows what proportion of each unit of sales revenue generated during the year was taken up by employee remuneration and allied expenses. Broadly, the lower the ratio the better it is for the company. If less of each unit of revenue is devoted to employee remuneration, there will be more available for other purposes.
$ |
A |
B |
Sales revenue |
100 |
100 |
Employee costs |
30 |
20 |
Employee cost per $1 sales revenue |
0.30 |
0.20 |
Interpreting the figures
For every $1 of sales revenue generated during the year, company A puts 30¢ and company B puts 20¢ towards employee remuneration and associated expenses. If the amount set aside for employment expenses is taken as a measure of efficiency, company B appears to be performing better than company A. There may be a number of reasons for the variation between the two. Company B may employ fewer people or pay a lower rate to its employees, or it may be operating in a different segment of the market and be able to charge a higher price for its products or services.
Relating employee cost to revenue is a useful way of comparing companies operating in the same business. If the ratio is calculated for a representative number of companies, an average or median can be found for the sector against which individual companies can be measured and compared over time.
Where the ratio of employee cost to sales revenue is used for international comparison, major variations can be expected because wage levels differ and social security and other benefit charges may be included in the total employee cost. It is therefore not recommended that too much weight be placed on this ratio for comparison of companies operating in different countries.
Tangible non-current assets per employee
In many businesses the investment in tangible non-current assets provided to assist employees is an important factor in gaining an overview of the efficiency of a company’s activities. If heavy engineering companies or car manufacturers are being analysed, it is useful to assess their ability to generate sales revenue and profit per employee and to maintain control over total employment costs; but measurement of investment in assets used in the production process to support employees’ activities is equally important in assessing each company’s efficiency in human resource management.
If the total of tangible non-current assets shown in the balance sheet is divided by the number of employees, the ratio of tangible non-current assets per employee is produced.
Tangible non-current assets per employee = tangible non-current assets ÷ number of employees
Interpreting the figures
This ratio provides a basis for comparing companies with respect to the investment they have made in assets necessary for their production activities. For example, a car manufacturer can be expected to require continued and substantial investment in robotics to maintain the quality and level of output and, perhaps, to allow a reduction in employee numbers. This will be reflected in the asset per employee ratio. A company undertaking the necessary investment can be expected to display a higher figure for the ratio than one that is not.
The use of this ratio may also be appropriate when analysing some service organisations. For example, when studying the passenger transport sector the amount of non-current assets per employee may be used to compare one company with another to assess the supporting investment in trains, planes, ships, buses or coaches. The ratio can also be employed to highlight for further investigation the variation between companies operating in the same line of business but in different countries.
Inevitably there will be problems of comparison, as some companies may own their factories and plant and machinery and others may rent or lease these assets. However, when the non-current asset per employee ratio is prepared for a number of companies operating in the same business, it provides a useful measure of the comparative levels of investment in assets used in the production process. The average or median ratio for all of the companies being studied gives a base against which to assess individual companies and, over a number of years, to observe any trends that are developing in a business sector.
Operating or net assets per employee
If a company provides detailed segmental information that includes the allocation of employees between sectors and geographic locations, the ratios described above can be adapted to provide measures for each unit. It should also be possible to calculate the operating assets or net assets per employee from the segmental information provided. If it is possible to prepare these ratios for a number of years, movements in the allocation of a company’s employees between businesses and countries, as well as the supporting investment in productive assets, can be observed.
Directors’ remuneration
Included in the employee’s remuneration figure is that for the company’s directors. The annual report will contain a report from the remuneration committee providing information on the company’s remuneration policy.
In a KPMG report, Directors Remuneration 2012, it was shown that the CEO of a FTSE 100 company had a median base salary of £800,000 and more than £3m total earnings. For a FTSE 250 company the figures were £450,000 and £1m. For several years there has been widespread criticism of what have been described as “fat cat” remuneration packages given to some directors. The annual report contains details of the remuneration or emoluments of all a company’s directors. The figure for directors’ remuneration or emoluments can be taken to cover their salary, profit share, bonus payments and other benefits. It should include not only bonuses for good performance but also any one-off payments for redundancy, contract severance or “golden goodbyes”. Whether a board member gets the money as a result of competence or incompetence, it is an expense to the shareholders. Shareholders have become increasingly irritated by payments made to directors that bear no relationship – except inverse – to company performance or investor returns.
The fact that the UK and US governments had to use taxpayers’ money to ease the shock created by the 2008 banking crisis revitalised calls for curbs on executive pay. Even when their companies failed, or shareholders lost their investment when they were taken over, some executives walked away with multimillion-dollar pay-offs. In the UK the collapse of Northern Rock and several other banks in 2008 required government intervention; and in 2012 the Co-operative Bank, having discovered a £1.5 billion “black hole” in its balance sheet, saw no reason to change its directors’ remuneration policy. Exactly how many trillions of dollars the US government used to support its problem companies is still being calculated. There can be no doubt that the 2008 global financial crisis created the stimulus for much tighter oversight of executive remuneration packages.
In 2013 the UK government amended the 2006 Companies Act to enforce much stricter reporting of directors’ remuneration. From 2014, listed companies must publish an annual directors’ remuneration report. Information is provided for each named director showing for the current and previous year:
- a single figure for the total remuneration received;
- salary and fees received;
- all taxable benefits;
- performance achievement payments;
- pensions benefits;
- share options.
It is now possible to make direct comparisons between companies of directors’ rewards for similar functions, such as marketing or IT. A graph and table will show the performance of the company’s market share price and an appropriate comparative index. All major decisions on directors’ remuneration will be stated and comment made on any substantial changes from the previous year. The future remuneration policy will be described and shareholders will be invited to vote on it.
Plus dividends
It is important to remember that the figure for directors’ remuneration in the annual report does not necessarily include any dividends received by directors on shares they own in the company. To gain a fuller picture of the total income that flows to directors from the company, the number of shares they own should be multiplied by the dividend paid. This is easy to do, as the annual report will contain a table listing directors’ names and the number of shares owned or in which they have a beneficial interest. The dividend per share is often displayed at the foot of the income statement.
Share options
Directors and other employees of a company are often given share options. Share option schemes are considered a standard means of motivating and rewarding a company’s workforce. An individual is offered the right to purchase a company’s shares at some time in the future at a predetermined price. For example, a director may be offered the right to purchase 1,000 shares in two years’ time at $2 each. If in two years the share price reaches $4 and the director exercises the right to purchase, a profit of $2,000 is made (although if shares are then sold there may be a capital gains tax liability).
IFRS 2 – similar to FAS 123 – provides guidance on the treatment of share option schemes. Employee stock options (ESO) and incentive stock options (ISO) are common in the US. In the UK you may see reference made to government-approved schemes, such as:
- EMI – enterprise management incentives;
- CSOP – approved company share option plans;
- SIP – share incentive plans;
- SAYE – save as you earn option schemes.
These schemes set limits on the level of individual employee’s participation and define any tax implications.
The treatment of share options (IFRS 2) requires the fair value of the option to be shown as an expense in the income statement and a compensating increase to be made in the balance sheet for equity. For example, if a director is offered the option to purchase 1,000 shares in three years’ time, the fair value (IFRS 13) of options is estimated to be $900, which, if spread over three years, is $300 per year. For each of the next three years the income statement will be charged with $300 and balance sheet equity increased by $300.
Shareholders have a right to expect a company to inform them not only of what share option schemes are in operation but also of what options have been taken up by executives and at what prices. Where this information is available it can be incorporated in the analysis of directors’ rewards suggested above (see Chapter 3).
The cost of the board
It is worth calculating the cost of the board of directors as a whole. The total remuneration package of each director, consisting of salary and fees plus any bonuses or other benefits, should appear in the annual report. If the total of these is added to the total number of directors’ shares multiplied by the dividend paid, a reasonably accurate figure of the cost of the board of directors is produced. This figure can be expressed as a percentage of sales revenue or profit, as was suggested for the total employee cost, to produce ratios that can be used to compare the practice of different companies over a number of years. Where one company is seen to provide much higher directors’ remuneration than similar companies, you may want to find out why this is the case. Has it proved worthwhile for the shareholders?
Average director’s remuneration
If the total figure for directors’ remuneration shown in the accounts is divided by the number of directors, a figure for the average director’s remuneration is produced. The current year’s figure can be compared with that of previous years to test for consistency and trends. It can also be compared with that of similar companies.
Who controls the board?
Ultimately, shareholders – although in practice this means the institutional investors who have substantial shareholdings – can overturn the directors’ remuneration policy. In the UK shareholders should get the opportunity to vote on directors’ remuneration policy. Indirect pressure from government, public opinion, professional bodies and stock exchanges may also influence board policy. However, there are many instances where boards have shown themselves to be thick-skinned when it comes to their remuneration.
Physical resource management
The decision on how to measure the efficiency of a company’s use of its available physical resources – the assets employed – must be based on an understanding of the nature of its business. Different types of businesses demand different measures.
Starting point
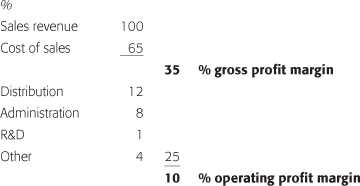
A useful first step towards such understanding is to turn to the income statement to discover the broad cost structure of the company being analysed. The income statement provides outline details of a company’s costs and expenses. The way the information is set out depends upon the nature of the business. For example, retail and manufacturing companies may set them out as follows:
Retail |
Manufacturing |
Cost of sales |
Cost of sales |
Staff costs |
Distribution expenses |
Occupancy costs |
Administration expenses |
Maintenance and renewals |
Research and development |
If each cost and expense heading is expressed as a percentage of sales revenue for the year and a number of years are considered or a number of companies are compared, trends and variations can quickly be highlighted for further investigation.
Analysing the rate of return
A good single overall measure of a company’s efficiency can be taken as the rate of return it produces on the assets employed. Rate of return ratios were discussed in Chapter 6. The target for almost any business is to make efficient use of assets to produce sales revenue from which profit is made. Dividing sales revenue by the assets employed in the business produces the asset turn ratio (see Chapter 6). This ratio is for most companies an eminently suitable measure of their efficiency in managing their assets.
Asset turn = sales revenue ÷ assets
A company displaying a low asset turn when compared with similar companies may be assumed to have some unproductive assets, some overvalued assets or inadequate management skills, or a combination of the three. The asset turn ratio is simple to produce, combining sales revenue from the income statement with the denominator – total assets, net assets, capital employed or whichever one is chosen. (Chapter 6 discussed the selection of an appropriate asset or capital employed figure from the balance sheet.) If calculated for a number of years, the ratio offers some insight into a company’s continuing efficiency. When a number of companies operating in the same business sector are being studied, this ratio is an excellent basis on which to make judgments of comparative efficiency in the use of assets to generate sales and profit.
The overall rate of return of a company is produced from the combination of profit margin and asset or capital turn. The one multiplied by the other provides the ratio.
The use of the Du Pont or pyramid approach to presenting rates of return is discussed in Chapter 6 (see Figure 7.1). The two main component ratios of profit margin and asset turn can be further subdivided to offer insight into the way in which the rate of return is produced and the efficiency of a company at various stages of its production activities.
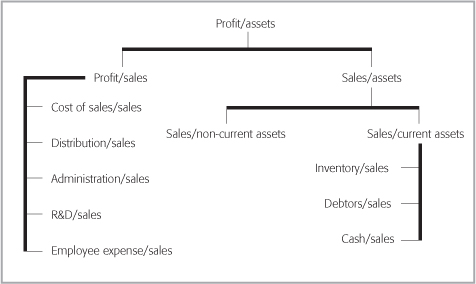
This pyramid of ratios can be helpful in analysing a company and in identifying which aspects of a business most affect its overall profitability. For example, it enables you to assess the impact on the rate of return of a decline in the inventory turn.
Ideally, it is the continuing business operations of a company that should be the focus of this analysis. In practice, however, where several companies operating from various country bases are being studied it is probably easier to take the total of both continued and discontinued operations for a year-by-year comparison.
For any company, the act of adding or removing businesses from its portfolio of operations can be significant, as can precisely when in the financial year this is done. The accounting treatment of acquisitions, in particular, can influence the profit displayed for the year. Whether a proportion of the full year’s profit or the total profit of the acquired company is brought into the income statement can have a direct influence on apparent profitability.
Once the figures have been translated into a table, it is easy to see whether there is a consistent approach by which a company is, over a number of years, managing to achieve its profit margins. If similar data can be collected for similar companies, benchmarks can be selected for the measurement of comparative performance (see Chapter 9).
Additional measures
A company may, in its annual report, provide additional information on its operations and performance. Needless to say, a company that has nothing to boast about will not often provide anything beyond the minimum required.
Companies that provide more information than that stipulated by legislation or accounting rules and practice may adopt any form of presentation they wish, and the figures published are not necessarily subject to the normal independent checks and verification by an auditor. Furthermore, the provision of additional operating details in one year’s annual report does not commit a company to provide the same details in other years or, if it does, to ensure that the figures are presented on a consistent and therefore comparable basis.
Many retail companies give details of the number and size of their outlets and total sales area. These provide a basis for calculating ratios of sales and profit per square foot or square metre of selling space. For any retailer, a practical measure of its efficiency is that of its ability to generate sales and profit per unit of sales space, and operating targets are often set to try to improve both of these ratios.
Such measures are an excellent means of assessing one company’s performance over a number of years and of comparing several companies. But differences between companies may be explained partly because they are in different sectors of the business. For example, a food retailer can be expected to sell more per square metre than a department store but to be operating at a lower profit margin and therefore probably a lower profit ratio.
It may prove useful to calculate the asset turn ratio using only non-current assets as the denominator:
Sales revenue ÷ non-current assets
If all the companies being analysed are in the same business sector, the differences between them shown in this ratio may be worth further investigation. However, remember that if they are diversified companies there may be issues of non-comparability. If so, use the information provided in any segment analysis that is available.
Output or level of service ratios
Other businesses may provide statistics on their output or levels of service. A transport company may publish the number of passengers carried or the passenger miles travelled in a year. These figures can be used as the denominator in ratios to assist the study of a company’s historical performance and to compare one company with another.
The cost and profit per passenger or per passenger mile can be calculated in a similar way to provide another measure of how efficiently companies deliver transport services. The staff cost of one company can be linked to the number of passengers, or ideally passenger miles, to allow comparison with previous years and with other transport companies. Transport companies in other countries may usefully be included in the analysis to produce the average amount paid by a passenger.
An electricity generating or supply company may provide details of the amount of electricity (megawatts) produced during the year. A motor manufacturer may disclose how many cars or tractors were produced during the year. Whenever a suitable common denominator for a business sector can be determined, this should be used as the basis for the preparation of a series of ratios to measure efficiency and performance.
Other sources of information
Additional information on a company or business sector can usefully be obtained from sources other than annual reports. Newspapers, journals, magazines and government and trade publications may offer data and information that can effectively be incorporated in performance and efficiency measures.
It is often possible to obtain national statistics relevant to a business sector – for total retail sales, total amount of electricity generated, number of cars and trucks manufactured and sold, for example. Even if the financial year end of a company does not match the calendar or fiscal year on which the statistics are based, it is still worth estimating the market share of a company to see how this has changed over the years.
Declining assets
Some indication of the age of assets employed in the business may help in the assessment of a company’s current and likely future efficiency. Details may be provided in the notes accompanying the balance sheet; there should at least be a statement on when the assets were last valued. A general guide to the expected future effective working life of assets can be arrived at by dividing the balance sheet value of the tangible non-current assets by the depreciation charged for the year in the income statement. The resulting figure indicates how many years it will be before the assets are completely written off and may be taken as a measure of their estimated future useful working life.
Estimated life of assets = tangible non-current assets ÷ depreciation
If tangible assets are shown in the balance sheet at $100 and the income statement includes $10 for depreciation, this implies a ten-year useful working life for the assets. Of course, there are many factors and events that can render this ratio ineffective. A company may acquire a major asset at the end of the year and decide not to make any depreciation charge for it in the accounts. It may revalue all or part of its assets, or it may change its depreciation policy. But this quick and simple ratio provides a starting point for more detailed analysis of tangible non-current assets.
In the income statement notes a company should provide details of its depreciation policy, giving for each class of asset the rate and method of depreciation being charged. The most common depreciation methods are discussed in Chapter 3. Depreciation policy can have a significant impact on reported profit.
The rate at which a company is replacing its assets can provide an indication of its ability to keep pace with technological change – an important factor for most companies and crucial for many. One means of determining the rate is to divide the tangible non-current assets shown in the balance sheet by the amount of capital expenditure for the year.
Asset replacement rate = gross tangible non-current assets ÷ capital expenditure
The figures for the gross, undepreciated value of tangible non-current assets and capital expenditure are given in the notes in the annual report. Alternatively, although it is not ideal, the capital expenditure figure in the statement of cash flows can be used. A company with gross tangible assets of $1,000 and capital expenditure for the year of $125 can be assumed to be replacing its assets approximately every eight years. Ideally, this ratio should be calculated for a number of years so the trend and consistency can be studied, and one company can be compared with others to see whether it is above or below the average or standard levels for the business sector. The ratio of accumulated depreciation to total non-current assets may be calculated to support the analysis; a high ratio suggests a low replacement rate.
It is possible to calculate the net capital expenditure each year as follows:
Year-end net non-current assets
Less beginning of year net non-current assets
Plus depreciation
= net capital spending
Capital expenditure turnover
The way a company’s capital expenditure is maintained or moving in relation to sales revenue can be measured by dividing sales revenue by capital expenditure to produce a ratio of capital expenditure turnover.
Capital expenditure turnover = sales revenue ÷ capital expenditure
If the ratio is decreasing, this may indicate that a company is increasing its investment in tangible assets to support the continuing generation of sales revenue. An increasing ratio may indicate a reduction in investment due to a lack of available funds or a lack of confidence in the business’s prospects.
The asset ownership ratio
In studying the tangible assets of a company, it is worth seeing what proportion of the non-current assets is owned and what proportion is leased. Is the foundation of growth to be on owned or leased assets? What may be the implications of this policy and what is the practice of other companies in the same business sector? The notes in the accounts give details of the division not only between owned and leased assets but also between long and short leases and operating and finance leases. This additional information may be of use when looking at the trend exhibited by a company over a number of years as it grows and develops.
Leasehold proportion = 100 × (leased assets ÷ total tangible non-current assets)
Research and development
A crucial function that often acts as a direct link between physical and human resources is research and development (R&D). The successful and profitable move from basic research to the development of commercially viable products and services is normally achieved through the application of the talents of highly skilled employees using sophisticated machines and instrumentation.
As described in Chapter 3, for most companies in most countries the total amount of R&D is written off in the year in which the expense is incurred; it is not usual to capitalise all or part of the R&D expense. If a company incurring an R&D expense of $100 follows the generally accepted accounting practice of writing the total amount off through the income statement, a loss may be disclosed as in company A below:
The income statement is charged with the total $100 of R&D expenditure and none is capitalised in the balance sheet. If the company is allowed to spread the R&D expense over a ten-year period, arguing that this is the time period over which the benefits of the investment will be gained, the position will be that of company B. Nothing has really changed, but a loss has been turned into a profit of $10 and the balance sheet value of the company is $90 larger because a new asset of R&D has appeared reflecting the capitalisation of the balance of the expense, which will be written off over the next nine years. This might be acceptable if there was no uncertainty about the survival of the company over the nine years, but were the company to run into problems immediately after the publication of its annual report, it is debatable whether the R&D asset in the balance sheet could be sold for $90. R&D is an intangible asset and accountants generally consider that its real value is too subjective for quantification in the accounts. Referring to Chapter 1, the rule of “when in doubt, write it off” applies.
A simple test of the effectiveness of a company’s R&D investment is to see whether or not it produces results. There is no commercial benefit to a company in investing resources in interesting research projects if these do not result in products and services reaching the marketplace. There is equally no point in a company investing large sums in R&D when there is no call for this from its customers. For retail companies only a limited amount of R&D is worthwhile, but for their suppliers more substantial investment in this area may be essential. Sectors in which sizeable and continuing investment in R&D is crucial include pharmaceuticals, defence and information technology.
A company’s annual report contains details of the amount spent on R&D and may also provide information on new products developed and launched, together with details of any breakthroughs that have taken place. All this is of at least some help in assessing the effectiveness of a company’s R&D programme.
R&D to sales ratio
One way of determining the consistency of a company’s policy on R&D is to divide the amount spent on it by sales revenue. The result multiplied by 100 gives the R&D to sales ratio.
R&D to sales = 100 × (R&D expense ÷ sales revenue)
For most companies, a reasonably constant level of investment in R&D is to be expected. A decline in the ratio may be because R&D expenditure is constant but sales revenue is rising, but a sudden reduction in the ratio may be an indication of corporate malaise. An easy way to improve profit when business is tough is to cut expenditure on things such as R&D. As discussed in Chapter 10, such action may bring short-term profit, but it may also damage long-term prospects.
Problems with percentages
Calculating a ratio as a percentage removes any necessity for currency conversion where international comparisons are being made, but it does not overcome the size differences of companies. If two companies invest 1% of their sales revenue in R&D, the ratio would not distinguish between them. However, if one company had sales of $10m and the other had sales of $1m, the amounts being invested in R&D by each are very different. For example, a big computer company may spend more on R&D than the total sales revenue of some of its smaller competitors.
Another problem is that many companies set their R&D budget as a regular percentage of sales revenue. This has the merit of consistency, but it may lead to difficulties. If revenue is declining, because of a lack of competitive edge in a company’s products, reducing spending on R&D in line with the set R&D to sales ratio is likely to exacerbate the decline.
Additional sources of information
Well-informed media coverage and reports from analysts who are experts in the relevant sector will help in assessing a company’s R&D performance. However, a simple but effective rule for anyone thinking of investing in a company is: “If you can’t see it, don’t buy it.” Before investing money in a company, try to get some first-hand knowledge of its products or services. Are its products and the range offered as good as, if not better than, those of competitors? Do its staff give the impression of competence and enthusiasm? If you are not impressed, why should anyone else be? Have a look at some big internet companies, such as Amazon, to see what customer reaction is to their products or services.
When you have invested in a company, regular physical checks on its products and services are as important as the financial analysis suggested in this book. This may seem like hard work, but it can be interesting and it is definitely a safer approach.
Financial resource management
Chapters 8 and 9 deal with many aspects of financial management efficiency, but there are some that are properly covered here.
The treasury function
The role of a company’s treasury department has become more important in recent years, mainly as a result of the increase in international business and the complexity of cash flows. Not long ago, a finance director might have spent a few minutes now and then considering the implications of currency movements for a company. Today, every major company has full-time staff overseeing the management of finance and cash flows.
For a company with its head office in the UK and a subsidiary operating in the US, a shift in the exchange rate between the pound and the dollar can have a dramatic impact on group profitability. If the subsidiary has a profit of $100 and this is “sent” to head office when the exchange rate is $1.55, £64.52 profit is brought into the group accounts. If the exchange rate is $1.65 or $1.45, the profit is £60.60 or £68.96. Thus the equivalent of a 10% change in the apparent profits of the subsidiary can be brought about simply by fluctuations in the exchange rate. The accounting treatment of international transactions is discussed in Chapters 2 and 3. Companies should do their best to avoid undue exposure to the risks of exchange-rate movements. In recent years, there have been some notable examples of companies that have lost large amounts of money because they were in effect betting on how currencies would move in relation to each other rather than hedging their risk from exchange-rate fluctuations. Managing currency transactions is a core responsibility of the treasury department.
Interest cover ratio
One financial efficiency measure for a company is its ability to pay the interest on its borrowings from operating profits. When profit before interest and tax (PBIT) or earnings before interest and tax (EBIT) is divided by the amount of interest paid, the resulting interest cover ratio shows how many times a company’s profit covers the interest payments it has to make.
Interest cover = pre-interest and tax profit ÷ interest
The higher the figure the safer is the company. A company with an interest cover ratio of 2 could suffer a 50% drop in profit and still meet its interest payments. A company with a ratio of less than 1 would have to dip into its cash reserves or sell assets or raise additional finance to meet its interest payment commitments if there was any reduction in profit.
Summary
- Efficiency is normally associated with the control of costs and expenses and with the productive use of all the available resources of a company to deliver its products or services to the marketplace at a competitive price.
- The efficiency of a business can be measured in various ways. It can be argued that the acid test of efficiency is profit. The development of a suitable set of performance measures linked to profitability is described in Chapter 6. However, a company may be highly efficient in managing its costs and expenses but face factors beyond its control that limit its ability to generate profitable revenues. There may be a recession or oversupply, or there may be a price war within the sector. In such circumstances, the lower profitability of the company may not indicate a lack of efficiency.
- After you have gathered relevant data for as many years as possible, a useful first step is to reduce the income statement to a common factor basis by expressing costs and profits as a percentage of sales revenue (see Chapter 6).
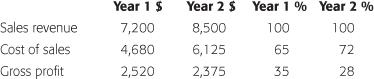
Using this approach makes it much easier to pick out changes and trends, either from year to year for one company or when comparing one company with another, particularly if they are operating in different countries. The profit margin ratio strips out problems of size and currency.
- Profit per employee is probably the best measure of the efficiency of use of the human resource element of a company.
- The rate of return ratio is the best single ratio to use as a measure of the overall efficiency of a company (see Chapter 6). An efficient company is more likely to produce a profit than an inefficient one, and is thus more likely to produce consistently higher rates of return.
- In assessing the ability of a company to make use of its available resources, the asset turn ratio is ideal. It is quick and simple to calculate. Sales revenue is taken from the income statement and a figure for assets taken from the balance sheet; one divided by the other produces the asset turn for a company. If each time a company makes a sale it takes a profit, the more sales are generated the more profit is produced. The higher the asset turn the better is the productive use being made of the assets employed in the business and the better is the eventual overall rate of return.
- Financial management can be encapsulated in the interest cover ratio. This displays the cost of a company’s external borrowings as a proportion of pre-interest and tax profit for the year. The more a company finances operations from external sources on which interest is paid or the higher the interest rates being charged the lower is the ratio.