
It isn’t what people think that’s important, but the reason they think what they think.
—Eugène Ionesco
Definition: Any number or variable or product of numbers and variables.
Examples: 3, -4x, xy3, 1.5xy2a3b4
Find the product
(3a2b3)(–2a5b2)
(3a2b3)(–2a5b2) = –6a7b5
Remember your exponential formulas/rules:
ab × ac = ab+c
(ab)c = abc
ab/ac = ab–c
Definition: The number that appears in front of the variable(s).
Example: Given monomials 2a; -3xy; and 17x2yz5, their corresponding coefficients are 2, -3, and 17.
Calculate the coefficient of
2a × (–3xy) × 17x2yz5
The resulting monomial is:
–102ax3y2z5
and its coefficient is –102.
Definition: A polynomial is the sum of two or more monomials.
Example: xy3 + 1.5xy2a3b4
Find the product
–5b(2b5 + 7b3 – 9b)
–5b(2b5 + 7b3 – 9b) =
–5b(2b5) – 5b(7b3) – 5b(–9b) =
–10b6 – 35b4 + 45b2
Definition: The term (of a polynomial) is each monomial that makes up the polynomial (i.e., a number, a variable, or a product of a number and a variable or variables).
Example:
binomials = polynomials with two terms (e.g., 5x – 10)
trinomials = polynomials with three terms (e.g., 7x3 + 2x – 4)
The degree of a term is the sum of the exponents on the variables contained in the term.
Calculate the degrees of 2ab and 5y3
The degree of the term 2ab is 1 + 1 = 2. The exponent on a is 1 and on b is 1 and the sum of the exponents is 2.
The degree of the term 5y3 would be 3 because the exponent of the only variable contained in the term is 3.
Definition: Terms that have exactly the same variables and exponents; they are the only terms of the polynomial that can be combined.
Example: 5a2b3 and -13a2b3
Calculate the coefficients a, b, c, and d such that
ax3 + bx2 + cx + d = (x – 1)(x + 1)(2x + 3)
(x – 1)(x + 1)(2x + 3) = (x2 – 1)(2x + 3) =
= 2x3 – 2x + 3x2 – 3 =
= 2x3 + 3x2 – 2x – 3
Thus,
a = 2, b = 3, c = –2, d = –3
Definition: Exponents are shorthand for multiplication: (5)(5) = 52, (5)(5)(5) = 53. The exponent stands for however many times the number, variable, or a combination (product) of the two are being multiplied. The quantity that’s being multiplied is called the base. This process of using exponents is called “raising to a power,” where the exponent is the “power.” So, 53 is “five, raised to the third power.” When we deal with numbers, we usually just simplify; we’d rather deal with 27 than with 33. But with variables, we need the exponents, because we’d rather deal with A6 than with A × A × A × A × A × A.
Properties.
(xm)(xn) = x(m + n)
(xm)n = x mn
Any number that is not 0 raised to the power 0 is just 1. As a result,

Example: Write  using only positive exponents.

Given the following equation
64x – 3 = 2–3x
Calculate x.
64 = 8 × 8 = 23 × 23 = 26
Thus (26)x – 3 = 2–3x
26(x – 3) 2–3x
6(x – 3) = –3x
9x = 18
x = 2
Definition: Rule/formula describing how to associate elements that belong to two different sets (“domain” and “range,” see below); it assigns to each number in one set (domain) a number in the other set (range).
Examples:
Example 1:

where x = “argument” (of the function)
Example 2:

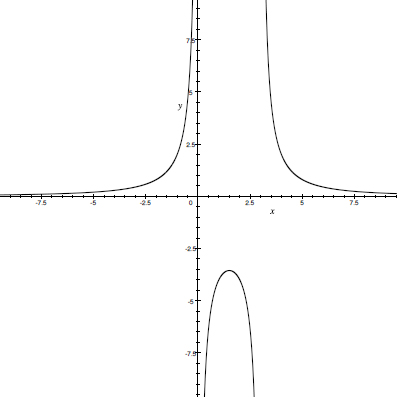
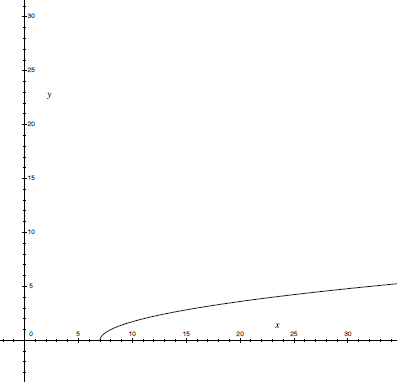
The graphical representation of the function y = f(x) in the xy coordinate system for the two examples above is shown below:
Example 1:
Example 2:
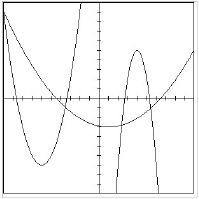
Definition: Polynomial function that takes the form: ax2 + bx + c where a ≠ 0 (the highest exponent of x is 2); its graph is a 2nd degree polynomial or a parabola (see graph example below).
Example:
f(x) = ax2 + bx + c = 0
Solution:
where: f(x) = a(x – x1)x – x2)
The graph of a quadratic function is a parabola:
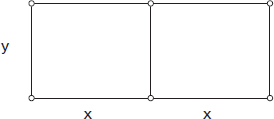
A rancher has 1200 meters of fence to enclose a rectangular corral with another fence dividing it in the middle as in the diagram below.
Calculate the largest possible area that can be enclosed with the available fence.
Total area: A = 2xy
In addition, x and y must satisfy.
3y + 4x = 1200
3y = 1200 – 4x
y = 400 – 4x/3
We now have y expressed as a function of x, and we can substitute this expression for y in the formula for total area A.
A = 2xy = 2x (400 – 4x/3)
We need to find the value of x that makes A as large as possible. A is a quadratic function of x, and the graph opens downward, so the highest point on the graph of A is the vertex. The graph of the function (not required to solve the problem) is shown below:
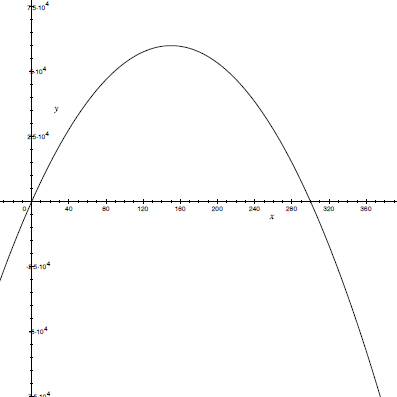
Since A is factored, the easiest way to find the vertex is to find the x-intercepts and average.
2x (400 – 4x/3) = 0
2x = 0 or 400 – 4x/3 = 0
x = 0 or 400 = 4x/3
x = 0 or 1200 = 4x
x = 0 or 300 = x
Therefore, the line of symmetry of the graph of A is x = 150, the average of 0 and 300.
Now that we know the value of x corresponding to the largest area, we can find the value of y by going back to the equation relating x and y.

The maximum value of the area A is therefore
Amax = 2 × 150 × 200 = 60,000 [m2]
Definition: The domain of a function is the set of all of the values for which the function is defined (the x values.).
Example: The domains of the functions illustrated in the two examples in the function section above are
Example 1:

Domain:
x ∈(–∞, 0)∩(0,3)∩(3, +∞) or x ∈(–∞, +∞) – {0,3}
Example 2:

Domain:
x ≥ 7 or x ∈ [7, +∞)
Example #3:
f(x) = x2 – 2x + 5
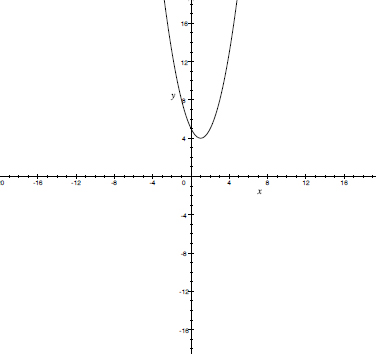
Example #4:

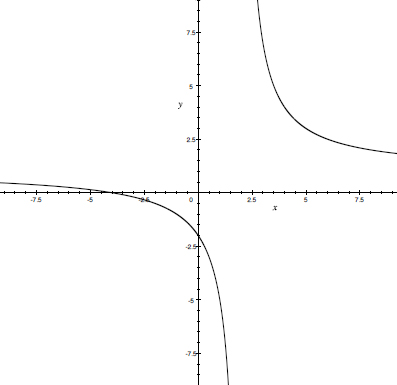
Example #5:

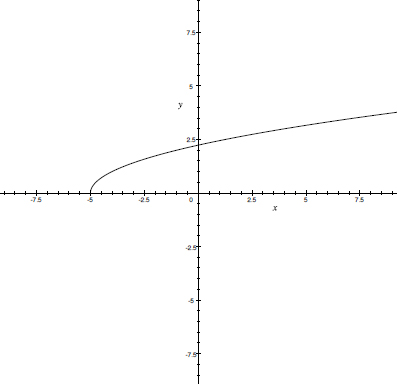
The domains for the three functions shown above are
| Function | Domain |
| f(x) = x2 – 2x + 5 | (–∞,+∞) |
|
(–∞, 2)∪(2, +∞) |
|
[–5, +∞) |
Definition: Range (of a function) is the set of all of the values that are the output (result) of applying the function (the f(x) or y values).
Example:
The range of values for f(x) corresponding to each interval on which x is defined in the graphs shown in the domain section is shown below.
| Function | Domain |
|
|
|
[0, +∞) |
f(x) = x2 – 2x + 5 |
[4, +∞) |
| Function | Domain |
|
(–∞, +∞) |
|
[0, +∞) |
Systems of (linear) equations can be solved using techniques such as substitution, elimination/addition, graphing, and Gaussian elimination. The most popular ones are substitution (see p. 13) and elimination/addition (see p. 18).
In solving inequalities or systems of inequalities, most rules and properties used to solve linear equations/systems of equations are valid. A notable exception is the following:
If the signs of both sides of an inequality are changed (or both sides are multiplied by a negative number), then the sense of the inequality will change, so if
x < y
then
-x > -y
See Problems 180 and 185 for sample problems.