This chapter explains how to read and critique statistics presented by someone else, including statistics contained in published research articles and workplace presentations. It begins with a general outline of how to critique a research article and then focuses more narrowly on ways to critique the statistics chosen and their presentation, as well as common ways authors and presenters try to cover up weaknesses in their data. In some ways, this chapter has the broadest applicability of any in this book because even if you never plan or carry out a statistical analysis yourself, there’s a good chance you will consume statistics presented by others, whether in your workplace, at school, or simply in your daily life as an informed citizen.
Often, you are called upon to evaluate not just the statistics used in an article but the entire article. This can be intimidating, particularly the first time you face such a task, but following a systematic process can make it easier. If you are reviewing an article for a specific journal, there may be a checklist or other form provided to guide your evaluation process. If not, check other publications in the field to see whether they have a checklist or set of guidelines that might be useful to you. For instance, Preventing Chronic Disease, a journal published by the Centers for Disease Control and Prevention, has a peer review checklist. This chapter presents a basic outline that provides some guidance, in the form of questions you should ask of each part of the article, for reviewing any research article.
- Abstract
Is the research question interesting and relevant? Is enough detail included in the abstract (including statistical results) to give you confidence that the article is based on original and significant research? Are the claims in the abstract supported by the results presented in the article? (Surprisingly often, they aren’t.)
- Literature review
Does the literature review set up the research question, convincing you that it is important and necessary? Is the research cited current? It’s fine for a review to include older articles, particularly if they are classics in the field, but the absence of any articles from the past several years suggests a paper that has been in the trunk (written but not published) for several years. The lack of current articles can also indicate a research question that is no longer central to its field or a literature review drawn from an older article and not updated.
- Study design
What kind of a design is used—observational, quasi-experimental, experimental? What specific statistical methods are used—ANOVA, linear regression, factor analysis, and so on? Is the design appropriate to the data and the research question? Could a stronger design have been used instead? Are the hypotheses presented clearly?
- Data
Is it clear how the sample was obtained and why? Is the process of data collection, processing, and analysis described in detail? Do you see any red flags, such as different sample sizes in different analyses, that are not discussed adequately? Are the data appropriate to the research question?
- Results and conclusions
Are the results presented clearly and related to the hypotheses? Do the results support the conclusions drawn? Is sufficient information presented in tables and figures (not just the results from statistical tests) so that you have a good feel for the study and its results? Are there any potential biases or flaws in the study that should have been discussed but weren’t? Do the results have practical as well as statistical significance? Are the limitations of the study presented clearly?
It’s possible to be too critical—all studies are performed in the real world, after all, and we don’t want the perfect to be the enemy of the good, let alone the excellent. When evaluating research, it is important to know what standards are expected in the professional field in question, and more experienced colleagues can provide excellent guidance in this regard.
Broadly, the misuse of statistics falls into two very distinct categories: ignorance and intention. The ignorant use of statistics arises when a person attempts to use descriptive or inferential statistics to support an argument, yet the technique, test, or methodology is inappropriate. The intentional misuse of statistics arises when a person attempts to conceal, obfuscate, or overinterpret results that have been obtained. Intuitively, you might think that ignorance arises mostly with complex statistical procedures such as multivariate analysis—and it certainly does—but even basic descriptive statistical procedures are routinely misused. Intentional misuse is rife in descriptive statistics as well, from using misleading scales on graphs to ignoring the assumptions of inferential testing necessary to make their results valid.
In this chapter, some examples are drawn from the contemporary debate surrounding climate change and global warming because the public mood in most countries has clearly changed over the past few years. The purpose is not to convince you one way or the other regarding climate change but simply to provide real-world examples of some of the difficulties of doing statistical research and interpreting and communicating the results.
If you are presented with a set of dazzling statistics that are meant to prove or support some argument, theory, or proposition, begin with the following checklist to start asking the tough questions:
- Representative sampling
If the investigator is attempting to make inferences about a population by using a sample, how was the sample selected? Was it truly randomly selected? Were there any biases in the selection process? The results of any inferential tests will be valid only if the sample is truly representative of the population that the investigator wants to make inferences about. In some cases, samples can be maliciously constructed to prove a particular fallacious argument. Alternatively, a volunteer bias might arise when some members of a population respond to a sampling request while others do not. For inferences about a population to be valid, the sample must be truly representative with all sources of bias removed.
- Response bias
If the data was obtained through interviews or surveys, how were the questions worded and the responses collected? Be cognizant not only of push-polling (a poll whose true purpose is not to gain information but to influence public opinion) but also of social desirability bias (the tendency for respondents to give the response they think the data collector wants to hear and/or that makes them look like a better person).
- Conscious bias
Are arguments presented in a disinterested, objective fashion or is there a clear intention to report a result at any cost?
- Missing data and refusals
How is missing data treated in the analysis? If participants were selected randomly but some refused to participate, how were they counted in the analysis? How is attrition (loss of subjects after a study begins) handled?
- Sample size
Were the sample sizes selected large enough for a null hypothesis to be rejected? Were the sample sizes so large that almost any null hypothesis would be rejected? Was the sample size selected on the basis of a power calculation?
- Effect sizes
If a result is statistically significant, was an effect size reported? If not, how was the importance of the result established? Was it meaningful in the context of the phenomenon under investigation?
- Parametric tests
Was the data analyzed using a parametric test when a nonparametric test might have been more appropriate?
- Test selection
Was the correct inferential test used for the scale of variable? Different techniques are used for different DV (dependent variable) and IV (independent variable) combinations of categorical, ordinal, interval, or ratio data.
- Association and causality
Is the only evidence for a causal relationship between two variables a measure of association, such as correlation? In this situation, it is incorrect to assert a causal relationship, even if one variable is labeled dependent on an independent variable.
- Training and test data
Has a model been developed using one data set and then tested using the same data set? If so, is there any acknowledgement that the model might not work as well on a different data set? This problem occurs frequently in pattern recognition applications.
- Operationalization
Is the variable selected to measure some particular phenomenon actually measuring it? If not, does the operationalization of the phenomenon seem reasonable? This is a common problem in psychology, when latent variables (such as intelligence) are measured indirectly by performance on different cognitive tasks.
- Assumptions
Have the assumptions that underlie the validity of the test been met? How has the investigator ensured that they have been met? For example, if a test assumes that a population is normally distributed and it is in fact bimodal, the results of the test will be meaningless.
- Testing the null hypothesis
To determine whether two groups are drawn from the same or different populations, it is common practice to test the null hypothesis that they are drawn from the same population. This derives from basic scientific methodology in which theories are supported by numerous and reliable sets of tests of null hypotheses that are rejected rather than the (apparently) more straightforward approach of testing the hypothesis directly. Beware of any piece of research that attempts to prove a theory by a single experiment.
- Blinding
Was the study single-, double-, or triple-blinded? For example, could the participants or investigators have introduced some bias by having knowledge of the treatment or control conditions in an experiment?
- Controls
If the effect of a treatment is demonstrated in a pre-treatment or post-treatment model, are matched controls receiving a placebo within the same experimental paradigm to control for the placebo effect? A designed experiment is the best (some would say the only) way to draw causal inferences reliably from data.
Investigations supported by statistics follow a surprisingly standard life cycle. If you are reviewing a piece of work, try to determine what the sequence of events was during the investigation. Did the investigators start with one hypothesis and change their minds after the results were in? Did they try numerous tests with various post hoc adjustments to make sure that they could report a significance-test result? Have they split results from one study into several articles to increase the length of their CVs? Asking searching questions about the research process is like a detective asking questions about movements at a certain date and time—inconsistencies and story-changing can be very revealing!
Investigations based on statistics should proceed along the following general lines:
Assuming that a period of observation and exploration has preceded the start of an investigation, research questions should be stated up front. Investigators must have formulated hypotheses (and the corresponding null hypotheses) well before they begin to collect data. Otherwise, the use of hypothesis testing is invalid, and the investigation can take on the flavor of a fishing expedition. Given that a p = 0.05 result represents a 1 in 20 chance of making a Type I error, and because thousands of studies are published each year in the scientific literature alone, many “facts” must surely be open to question. This is when independent repeatability and reliability are critical to the integrity of the scientific method.
The relationship between the population of interest and the sample obtained must be clearly understood. It’s not acceptable to make inferences about the entire human population based on a sample of highly educated, healthy, middle-class college students from one college.
Hypotheses must relate to the effect of specific independent (predictor) variables on dependent (outcome) variables. Thus, it’s critical to know as much about the dependent variables as possible, especially every source of variation in them. This is particularly important when dependent variables are thought or known to be highly correlated (i.e., multicollinearity). The dependent variables must be measurable and must operationalize underlying concepts completely.
In complex designs, when there are both main effects and interactions to consider, all the possible combinations of main effects and interactions and their possible interpretations must be noted.
Procedures for random sampling and handling missing data or refusals must be formalized early on to prevent bias from arising. Remember that a truly representative sample must be randomly selected. Where purely random sampling is not feasible, it might be possible to identify particular strata within the population and sample those in proportion to their occurrence within the population. If random sampling will not be used (and frequently it is not), this limitation must be acknowledged and addressed.
The simplest test that is adequate to the purpose should be selected, that is, the simplest test that will allow you to explore the inferences that you need to examine. Multivariate techniques are incredibly important, but if you need to make only simple comparisons, they might be inappropriate.
Tests should be selected based on known or expected characteristics of the data.
Ideally, every result should be reported, even if the study did not find statistical significance. Failure to do so leads to publication bias, in which only significant results are published, creating a misleading picture of our state of knowledge. Don’t be afraid to report deviations, nonsignificant test results, and failure to reject null hypotheses—not every experiment can or should result in a major scientific result!
Generally, the design of an investigation of a question of interest needs to follow the guidelines presented in Chapter 18 if meaningful inferences are eventually to be made. However, many investigations do not follow these types of guidelines at all—especially if the investigation was produced for a publication that relies on sensational headlines to grab the attention of an inattentive reader or viewer. Even if a study followed appropriate procedures and produced valid results, the meaning of those results can be distorted if a news report extrapolates from the results of a single study to indicate a fundamental shift in knowledge.
Understanding variation is critical to all systems. Variation can arise from legitimate sources (true variation in the population) but also from measurement error. Variation can be cyclical, so cross-sectional designs might not always correctly identify that local minima might be perfectly acceptable in the life cycle of a system. In climatic systems, for example, variation in temperature occurred prior to the Industrial Revolution and the consequent increase in the release of greenhouse gases; how do you separate the variation expected due to normal cyclical effects from that which can be directly attributed to human activity? This is one of the critical issues facing environmental science because the atmosphere definitely warmed since the last ice age, without any human interference, until the Industrial Revolution. The point is that a scientific article should discuss the issue of variation and place its results in the context of expected natural variation.
Scope in defining a population is critical in accurately specifying the limits of inference that can be made from a particular study. If all members of a population are measured in some way, and there is no missing data or refusals, you don’t need statistics at all because you can calculate parameters of interest directly. However, this situation rarely arises in research. Part of the problem in defining a population is when there is some fundamental misunderstanding of the population in question. Imagine that a survey of attitudes is undertaken in Utah and the results extrapolated to apply to the population of California, or a survey taken in Italy but applied to the population of Denmark. This might not seem farfetched because in the first example, both states are not only located in the same country but are relatively close in geographical terms, and in the second they are both part of Western Europe. However, in either case, there are also many differences: the size and diversification of the economies, the ethnic and racial makeup of the populations, and so on, and the burden is always on the researcher to make the case that such a generalization is appropriate.
There are two key aspects of sampling: size and randomness. A truly representative sample must be both large enough and randomly selected to give an accurate estimate (statistic) of any population parameters. Being sufficiently large to represent the population is a difficult problem—calculations of statistical power (discussed in Chapter 15) certainly provide a basis for this in terms of inferential testing—but more sophisticated sampling schemes will attempt to identify all sources of variation in the population that might introduce bias and sample within those appropriately. Drawing a random sample is the best way to avoid many types of bias in selection, but it is not always possible. An article should always report how the study sample was selected and discuss any consequences from the use of nonrandom sampling.
A recent study indicated that the administration of antidepressant medication to a large number of participants in a clinical study was no more effective than a placebo. Thus, the expectation of receiving a cure resulted in the same improvement in depressive symptoms as receiving a tablet with the active ingredient. The placebo effect is very powerful in humans, and most studies should provide some type of explicit control when the effect of a treatment is intended to be demonstrated. In clinical and pharmaceutical sciences, the methods and processes for controls are well established. When control groups are not possible (for instance, in climate modeling), the article should provide some other sort of context, if possible, for the results presented (historical data, results from other studies).
When statistical significance is measured at the p = 0.01 or 0.05 level, this means that there is a 1 in 100 or a 1 in 20 chance, respectively, of a Type I error being committed. Thus, in the case of p = 0.05, a repetition of the experiment would lead to 19 out of 20 cases being significant and 1 out of 20 being insignificant. This is why independent replication and repeatability are so important. In addition, the world is full of coincidences, and experiments are subject to measurement error. The interaction of coincidence and measurement error can lead to some downright wacky and unexpectedly “significant” findings to which no actual significance should be attached. Imagine that there are 20 earths surrounding the sun, and you choose one to examine the effects of global warming. You find a correlation between increases in industrial activity and temperatures for the past 200 years. Because you know that there is a 1 in 20 chance of committing a Type I error, you would check out at least some of the other planets or perform an experiment on them all, with half acting as matched controls for the others.
You can see the difficulty here in understanding the causal sources of global warming. There are no other 19 planets that you can experiment with or verify your model against—but at the same time, you know there is a strong possibility of committing a Type I error. A similar problem arises in the case of disease clusters; some geographical areas seem to have unusually high rates of a particular disease, leading residents to suspect an environmental cause. However, this type of reasoning is also susceptible to the shooting-the-barn fallacy in which you shoot first and then draw the target around where the bullets struck; the implication is that the geographical area was defined after the disease cluster was noted. In addition, purely by chance, some towns, counties, and so on will have unusually high rates of disease just as when, flipping a coin many times, you can expect long runs of heads and tails from time to time. The point is that you should always be alert for studies that appear to capitalize on chance, particularly if their results contradict what is known from other, better-designed studies.
The issues surrounding the appropriate interpretation of inferential tests are complex and prone to error. However, the use of descriptive statistics also has enormous potential to introduce errors in reasoning and understanding. Some of these errors are deliberate attempts to misguide and mislead. Others are simply poor choices. In this section, you learn about some common problems associated with descriptive statistics, especially measures of central tendency and graphing.
The issue of selecting an appropriate measure of central tendency applies whenever data is not normally distributed, and the more extreme the departure (particularly due to the presence of outliers), the more important the choice. In right-skewed populations (those with a relatively small number of high values), the mean will be higher than the median, and if the high values are far removed from the rest of the population, the mean can be quite misleading as an average value. This is the reason information such as income and home values are usually reported as medians rather than means—the presence of a few very rich people or a few very expensive homes within a population can distort the mean while having minimal effect on the median.
Measures of central tendency can also be misleading when the sample and/or the population changes from measurement to measurement. Average house prices are a classic example; these are based solely on sales in a particular period such as one year. From year to year, the sample from which the average is calculated will almost certainly change, unless all houses sold in one year are resold the next and no other houses are sold. This would surely be a very unlikely event. And yet eager homeowners often take a 10% average rise in house prices to mean that their home’s value has increased by the same proportion. Where the population itself changes—such as where many new homes are built and sold in one year—the median will almost certainly rise. And yet existing houses might sell for exactly the same price (or less) than the year before. A more valid method of determining the average house price would be to sample among the population so that each house has an equal chance of being valued and added to the sample. Furthermore, because the proportion of existing houses to new builds is known, the sample could be further stratified so that average prices for both types of houses could be reported and/or aggregated afterward.
To avoid undue influence from extreme cases, sometimes a rule is followed to remove them from analysis. For instance, cases that lie two standard deviations above or below the mean might be dropped before the statistics are calculated, or a certain proportion, such as the upper and lower 10%, might be dropped, a practice known as trimming. Removing extreme cases from analysis also helps minimize measurement error effects; in reaction time experiments, for example, it’s not uncommon for participants to become incredibly bored and miss a stimulus. If the computer program waits only for two seconds to accept a response, but the stimulus is missed, a reaction time that is usually on the order of 20–80ms is now recorded as 2,000ms, which is up to two orders of magnitude greater. If this case is not culled, the mean would be greatly overestimated.
The key point in this example is that although there are legitimate reasons to remove outliers, any alteration of the study sample after it is collected must be reported and strongly justified by the authors. A good practice when reviewing articles is to check reported sample sizes throughout the article: if the sample drawn is not the sample analyzed, is a reasonable explanation provided? If cases were removed by the researcher, is this clearly explained and justified? Was a sensitivity analysis performed; that is, was the data analyzed twice, once with all the cases and once with the outliers removed, to examine the effect of removing the outliers?
The standard error for the data should be reported, especially if the article is comparing the means of two groups. The standard error is an estimate of the standard deviation of a sampling distribution (such as the sampling distribution of the sample mean) and is thus an estimate of the variability of a reported statistic.
Normally, the standard error is estimated by using the standard deviation divided by the square root of n; thus, all else held equal, as the sample size increases, the standard error decreases, and the parameter estimates become more reliable. In most fields, the confidence interval for any point estimate (e.g., the mean) is generally reported as well as the standard error of the mean. The confidence interval provides a measure of the precision of the point estimate, and the article should not only provide confidence intervals but discuss their meaning. If the confidence intervals are wide, this should be discussed in terms not only of the precision of the particular study but in terms of generalizing the results.
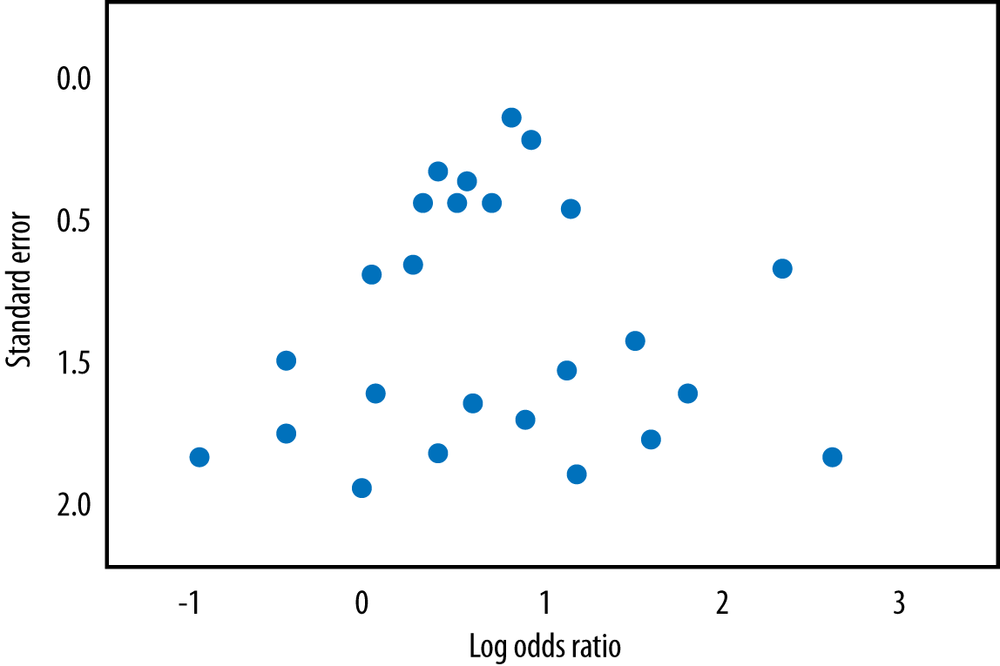
Graphs provide an accessible way to communicate numerical information. However, graphs can be misused in a number of ways; for example, axes might be unlabeled, meaning that they cannot be correctly interpreted, or manipulated to obscure or enhance the real relationship between variables. In scientific work, actual data values should be presented as well as graphical displays; often in the popular media, only graphs are presented, which heightens the possibilities for deception.
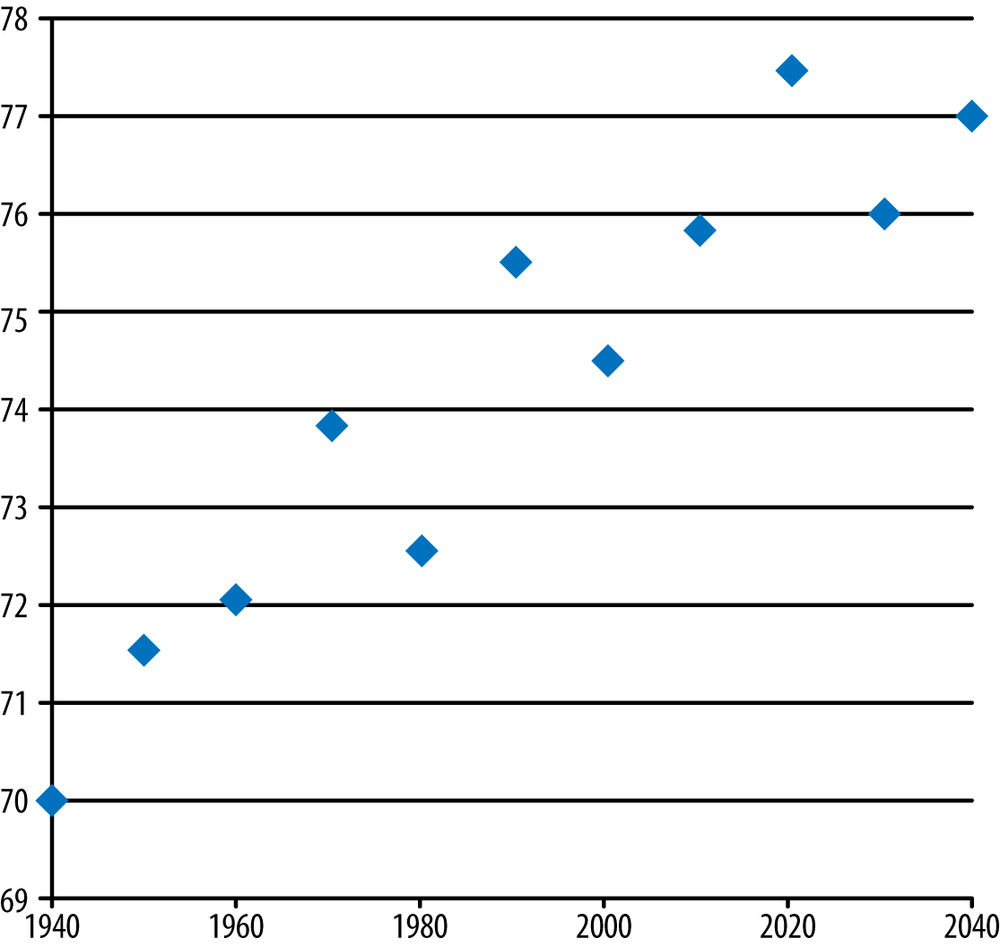
The old adage “A picture tells a thousand words” is certainly true, but the thousand words can change dramatically depending on the choice of scale. Figure 20-3 shows a fictional set of temperatures that increase, ranging from 70–77 degrees Fahrenheit, over a 100-year time span. The rise in temperature is almost perfectly correlated with the year (r = 0.94); this fact can be either illuminated or obscured in the graphic presentation. Figure 20-3 certainly shows a strongly linear rise.
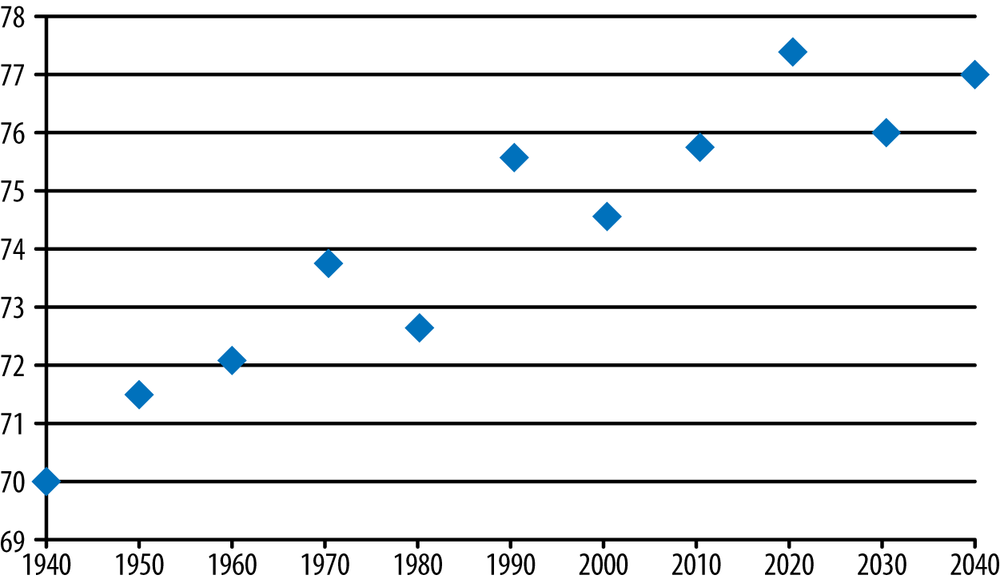
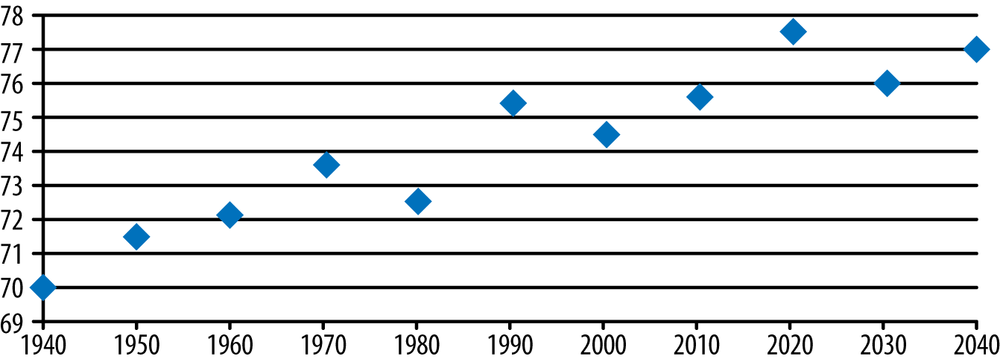
However, by stretching out the horizontal axis, suddenly the visual effect is of an overall slower rise in temperature, as shown in Figure 20-4.
Note that if the temperature scale is now adjusted to start at 0 degrees rather than 68, the relationship is even further flattened, and the two variables visually appear to be uncorrelated, as shown in Figure 20-5.

Of course, if you took the opposite view, you could always stretch the temperature axis vertically and make the temperature rise look even more dramatic, as shown in Figure 20-6.
You will seldom find graphs as misleading as Figure 20-5 and Figure 20-6 in scholarly publications, but it’s always wise to be alert to attempts to mislead the reader through peculiar choices of ranges, axes, or other tricks. Unfortunately, such deceptions are more common in the popular press, so you need to be particularly alert when interpreting graphical information from publications meant for a general readership.
A common tool used in marketing is extrapolation of a known relationship between two variables, outside a measured range, to forecast a trend. For example, if the S&P 500 index has increased by 10 points for each of the past 10 weeks, a gambler might feel some confidence in betting that the index might increase by 10 points during the following week. In this case, using simple linear extrapolation provides the best estimate possible—but because the stock market is subject to a lot of random variation, the index will not always rise in accordance with previous experience. If the system is not a linear one, linear extrapolation is not appropriate.
Looking at trends can be useful, and it’s a common practice in many fields. However, when the system under study is not deterministic, subject to random error, or chaotic, the usefulness of trending is limited and can give wildly inaccurate and potentially misleading results. Any forecasts reported in an article should be clearly identified as such and justified, as should any extrapolations beyond the range of the measured data.
So far, you have learned about key problems in research design and descriptive statistics that are often present in reports of statistical work performed. In some cases, deception might be behind the incorrect presentation of an analysis, and the omission of key statistics should raise your suspicions. With inferential statistics, you must also be alert to the incorrect or inappropriate use of some tests. The most significant problem is that the assumptions of multivariate tests are routinely ignored, and yet the results of these tests are extremely sensitive to any violation of the assumptions. A research article should explain clearly how the appropriate assumptions were tested and what remedies, if any, were taken before the data was analyzed.
Here are some typical violations of the assumptions of common statistical tests and mechanisms to test whether the assumptions are violated. If an article does not discuss how the appropriate assumptions were tested, you should be suspicious of the results.
Two-sample t -tests assume that the samples are unrelated; if they are related, then a paired t -test should be used. (t-tests are discussed further in Chapter 6.) Unrelated in this context means independent—you can test for linear independence by using the correlation coefficient. Serial correlation might become an issue if data is collected over a period of time.
t-tests are also influenced by outliers, so the article should mention whether the data was screened for outliers and, if any were found, what was done with them. Note that discarding outliers on the basis of sound statistical measures is an entirely separate activity from discarding data that happens to be unfavorable, and removing cases simply to strengthen the results is unethical.
t-tests assume that the underlying population variances of the two groups are equal (because the variances are pooled as part of the test), so the article should state that one of the tests for homogeneity of variance was used, what corrective measures were taken if necessary, or whether a test that does not rely on homogeneous variance (e.g., Welch’s t-test or a nonparametric test) was used instead of the standard t-test.
Normality of the distributions of both variables is another assumption of the t-test, unless sample sizes are large enough to apply the central limit theorem. Again, there should be some mention of how this assumption was tested and, if necessary, what corrective measures were taken.
ANOVA has a large number of assumptions that need to be met, which usually requires directly determining whether the assumption is met (rather than hoping that it is met or ignoring it). ANOVA (discussed further in Chapter 8 and Chapter 9) assumes independence and normality, but the most important assumption from a practitioner’s perspective is the equality of variances.
ANOVA is most reliable when the study is balanced (when the sample sizes are approximately equal) and when the population variances are equal; skewed distributions and unequal variances can make the interpretation of the F-test unreliable. An article using ANOVA should report how all these assumptions were tested and what remedial measures or adjustments, if any, were taken.
Linear regression (further discussed in Chapter 8 and Chapter 10) assumes the independence of errors in the independent and dependent variables. This assumption might not be met if there is a seasonal effect, for instance. (Sales of ice cream tend to be higher in hot months.) The article should describe how this assumption was tested (generally, through a residuals analysis) and what was done if nonindependence in the error terms was discovered (e.g., the use of time series analysis instead of linear regression).