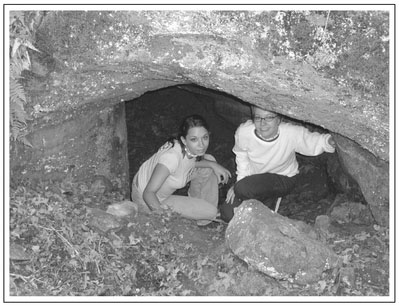
Figure 10.1. Photograph of a cave believed to have been visited by the outlaw Jesse James.
Ground penetrating radar is one of the most frequently applied geophysical tools for near-surface applications including archaeology. In fact, there is a book dedicated to this subject.1 It can yield spectacular results. However, its failure rate is also quite high. There are many reasons for frequent GPR failures and some of these area result of the complexity and subtleties of the method. Radargrams are difficult to interpret, and often features that are manifested in the data are not apparent to an inexperienced practitioner. Because there are many acquisition parameters that must be specified, there is a greater potential for failure through data acquisition errors than in any of the other methods considered thus far. The most common error is antenna selection (Sect. 9.6.3). This arises either by selecting an antenna center-frequency that is too high to achieve the necessary depth of penetration or too low to yield the desired resolution. Even when acquisition parameters are optimal, features that can be made 'visible' in a radargram are overlooked as a result of improper gain (Sect. 9.6.4).
Interpretation skills required for GPR are much higher than for gravity, magnetometry, and EMI because GPR is inherently a three-dimensional technique. To understand this three-dimensionality, consider the identification of a buried wall using both GPR and EMI. With EMI, data acquisition involves walking a series of parallel straight lines (Sect. 7.10.1). Acquired data is two-dimensional and can be displayed as a gray-scale plot (Sect. 7.10.2). Figures 8.10 and 8.13 are two examples of buried stonewalls as manifested in EMI measurements, and the horizontal locations of these walls are obvious in these EMI measurements. Each EMI measurement line is one-dimensional and, when many EMI measurement lines are taken collectively, the result is horizontally two-dimensional. In contrast, because time is explicit in GPR, each GPR measurement line is two-dimensional, one dimension being antenna position along a horizontal line and the other dimension being travel time which is related to depth. When considering multiple parallel GPR lines, the data set becomes three-dimensional where antenna position is defined in two horizontal dimensions and the third dimension is travel time. Each radargram is two-dimensional and is essentially a vertical slice through the subsurface below the line along which measurements are made. Figure 9.17c presents a stylized radargram (as a wiggle trace) of a wall. This radargram was created by first defining the wall and then determining ray paths for reflections (Figs. 9.17a and 9.17b). This is referred to as forward modeling since a subsurface structure is first defined and then the response is modeled. This is quite different from interpretation where there is no a priori knowledge of the subsurface. Given that a radargram has the appearance of Fig. 9.17c, itmightbe postulated that a wall is present. However, a wall has length and in general is a linear feature. Such linear features are immediately obvious in EMI data (Figs. 8.10 and 8.13); however, such recognition from GPR data requires the interpretation of many radargrams which is time consuming and tedious.
The above discussion has focused on situations where GPR will work. There are many situations, however, where subsurface conditions are not appropriate for the application of GPR. Usually, these occur when the host soil has a conductivity sufficiently high that the frequency required to achieve a desired resolution cannot penetrate to the depths of interest (Sect. 9.4.2). Even when sufficient penetration depth can be achieved, buried objects may be 'invisible' to GPR because they do not exhibit any difference in wave speed with respect to their surroundings. The strength of a reflected signal is proportional to the reflection coefficient (Equation 9.1), and when there is no wave speed difference, there is no wave reflection. An example of this is the buried stone walls at the Pre-Pottery Neolithic site (Sect. 8.4). Here, the buried walls were mapped with EMI (Fig. 8.10) because these walls have a difference in electrical conductivity with respect to the surrounding soil. Ground penetrating radar was also used at this site and, although the soil conductivity was sufficiently low to allow more than adequate penetration, it failed to reveal any subsurface architecture. The reason for this failure is that walls are composed of indigenous stone. The local soil was created by erosion of this stone so that soil and the stone have the same dielectric constant. Since electromagnetic wave speed depends on the dielectric constant (Equation 9.8), materials with similar dielectric constants will have similar wave speeds. The walls are clearly evident in the EMI measurements because there is a difference between the electrical conductivity of the soil and stone likely caused by differences in moisture content. Electrical conductivity will effect electromagnetic wave speed. However, this effect is secondary to that of dielectric constant. For example, a 100% change in dielectric constant will change the wave speed by about 40%. However, a 100% change in electrical conductivity will yield a minute change in wave speed.
The case studies in GPR presented here are selected to illustrate the interpretation of real data as well as difficulties that can arise in GPR interpretation.
Jesse James was an infamous outlaw who robbed banks and trains in the United Stated during the last half of the nineteenth century. Evidence is emerging that his exploits were directed not toward personal gain but were part of a post-Civil War conspiracy dedicated to the resurrection of the Confederacy. This conspiracy was planned by a subversive organization known as the Knights of the Golden Circle (KGC) and it is believed that the KGC buried large amounts of gold, silver, and arms in underground coded depositories throughout the South and Southwest. Some of the KGC treasure has been discovered in the former Indian Territory that is now the State of Oklahoma, which the James Gang was known to frequent in the decades following the Civil War. This treasure was found through the systematic deciphering of maps along with directions left behind as rock carvings.
In their book,2 authors Getler and Brewer detail the process by which Brewer was able to locate ajar containing silver coins dating from the mid-1800s to 1880 in southeast Oklahoma, based on his breaking of the code of an authentic treasure map drawn by Jesse James. Later, a cache of gold coins was found on the same site, again using the symbolism found on coded maps and rock carvings. Getler and Brewer believe that Oklahoma could have the greatest concentration of geometrically designed KGC depositories, and there are indications that hidden money bunkers were built across the southern tier of the United States from Georgia to California.
The study area is on a property where there is shallow limestone overlain by a thin soil cover. Limestone is water-soluble and, as a result, the infiltration of groundwater will dissolve limestone at its contact with the soil, producing an irregular surface. Groundwater will also pass into the limestone dissolving it from within, leading to internal voids. These voids are referred to as solution features and when a solution feature intersects a cliff face it becomes a cave. The property is cut by a stream that has created a deep valley with limestone faces on either side. Numerous caves are accessible on these faces and an example of one is shown in Fig. 10.1. This particular cave has inscribed in the rockthe initials 'JJ' and the date 1880. It is believed that this area was frequented by Jesse James and that there remains hidden at the site the spoils of his robbery efforts. Anecdotal evidence suggests that the Jesse James treasure consists of cast iron pots or glass jars containing gold coins that were placed in caves. It is also likely that these cave entrances were concealed.

Figure 10.1. Photograph of a cave believed to have been visited by the outlaw Jesse James.
The geophysical search for treasure was based on the assumption that treasure, if it exists, is within a solution feature. There are numerous symbols carved into rocks on the property, and treasure hunters believe that some of these carvings were left behind by Jesse James to aid in his recovery of the treasure. Since the property is quite large, with some areas covered by dense vegetation and other areas too steep to survey, a small survey region was established based on one treasure hunter's interpretation of rock carvings. This site sits atop the bluff shown in Fig. 10.2. The dashed line on this photograph indicates the approximate boundary between soil and limestone.
The area over which geophysical measurements were made is outlined in white on Fig. 10.3. To avoid dense vegetation, this area was divided into two abutting rectangles. Three geophysical techniques were employed in the treasure search—magnetometry, electromagnetic induction, and ground penetrating radar. Magnetometry was selected to directly identify the possible locations of iron pots since iron is a ferrous metal and can, therefore, be detected and located with magnetometry (Sect. 4.7). Voids in limestone, if air-filled, will appear in the quadrature component of EMI measurements (Sect. 7.7.2). Figure 7.39b is an example of a solution channel on this same property delineated by EMI measurements. The in-phase component of EMI can detect metal objects (Fig. 8.18) and, at the Jesse James treasure site, this metal could be an iron pot of coins. Ground penetrating radar was used as a complement to the other two methods. Provided that adequate penetration depth can be achieved for the desired resolution, GPR can map the top of the limestone, identify voids within the limestone, and reveal isolated reflectors such as a cache of treasure.
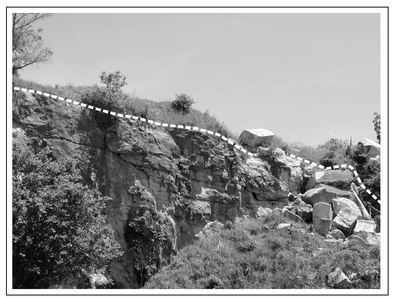
Figure 10.2. Photograph of a limestone face where the dashed line indicates the approximate boundary between soil and limestone. The area surveyed with geophysics lies on top of this bluff
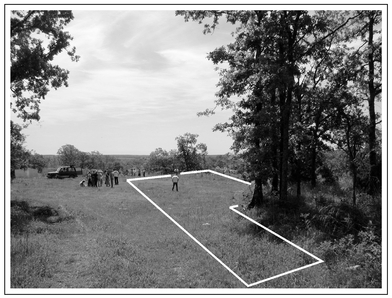
Figure 10.3. Photograph of the site showing the geophysical study area outlined in white.
The 15210 Hz quadrature component of the EMI data is shown in Fig. 10.4a and the expectation is that any solution features that exist will appear as a low response in quadrature (Fig. 7.39b). A low response (white) appears in Fig. 10.4 and is identified as air by annotation. However, this response is not from a buried void but rather is associated with the cliff face immediately to the left of the survey area (Fig. 10.2). Since EMI measurements represent an averaged response over a certain volume and air has essentially a zero electrical conductivity, the air just beyond the survey area results in a reduction in the volume-averaged response (Sect. 7.11.3). The area of increased response (black) likely represents thicker soil as discussed for Fig. 7.37. The in-phase EMI component is not presented because it failed to reveal any meaningful information, particularly a localized high response suggestive of buried metal.
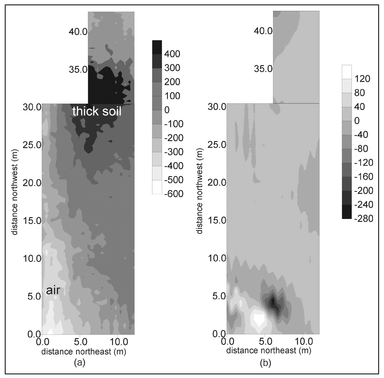
Figure 10.4. Gray-scale plots of (a) the 15210 Hz quadrature component and (b) the magnetic data at the Jesse James treasure site.
The failure of the EMI measurements to reveal any features indicative of buried treasure, either solution features or metal, might suggest that no treasure is present in the survey area. However, the magnetic data (Fig. 10.4) show a strong dipole that is definitive evidence of a buried ferromagnetic object. There appears to be a conflict between the EMI in-phase component and the magnetometer data; the EMI data indicate no buried metal is present while the magnetometer shows a ferromagnetic object. One possible explanation is that there is no metal present and the magnetometer has responded to a magnetic rock. This is not a likely scenario because strongly magnetic rocks are not indigenous to this area. A more plausible interpretation is that the feature that appears in the magnetic data is a ferrous metal object and its absence in the EMI in-phase component is a result of its small size (even a small object can have a large dipole moment, Sect. 4.3) or the size and orientation of the metal object is such that it manifests an EMI response that is too weak to be detected (Sect. 7.4). Although it is likely that the magnetic feature is buried metal, the EMI and magnetic data do not provide any means of distinguishing the object as either metal debris that was inadvertently buried or intentionally buried treasure. Clearly, had the EMI quadrature component revealed a solution feature coincident with the magnetic object, the likelihood of the magnetic object being associated with buried treasure would be greater. The reason for this is that it is difficult for an object to unintentionally find its way into a solution feature. There is a scenario by which a solution feature can exist but not be apparent in EMI measurements and this is illustrated in Fig. 10.5. A shallow isolated solution feature can be produced by natural forces and this void can be open to the ground surface as a result of the dissolution of the upper limestone surface by the infiltration of water (Fig. 10.5a). Numerous examples of such 'holes' occur on this property. This could be an obvious location for concealing treasure. This treasure could simply be placed in the open hole and subsequently filled with local soil (Fig. 10.5b).
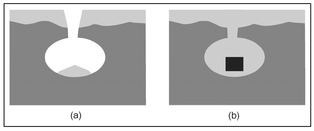
Figure 10.5. Illustration of vertical cross-sections of (a) a naturally occurring small isolated solution feature open to the ground surface and (b) the same cross-section after emplacement of treasure and backfilling.
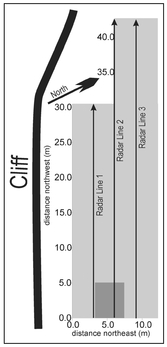
Figure 10.6. Illustration of the magnetometry and EMI survey area (light gray), the three radar lines surveyed in the first phase, and the follow-up GPR survey region (medium gray).
If the soil-filled void is relatively small, it would offer little contrast in electrical conductivity and would not be detectable with EMI. Provided that adequate penetration depth can be achieved at the survey area, GPR can be used to identify the backfilled hole and this should appear as a discontinuity in the soillimestone interface. When the antenna is not over the void, there will be a reflection from this interface. However, for measurement locations that are over the soil-filled opening to the solution feature, no such interface exists and there will be no reflected signal.
The geophysical studies at this site were executed in two phases. In the first phase magnetometry, EMI, and GPR data were acquired before any of the measurements were interpreted. The second phase was initially unplanned, consisted of only GPR measurements, and was motivated by the discovery of the magnetic object. Figure 10.6 displays the EMI and magnetometry survey region as light gray with three superimposed lines identifying the locations and direction of the radar lines surveyed during the first phase.
Three radar lines were surveyed during the first phase of the geophysical studies. Previous experience on this property suggested that surface soils are rich in clay. Because clay is electrically conductive and inhibits the propagation of radar waves, relatively low 100 MHz center-frequency antennas were used to maximize the depth of investigation. Figure 10.7a is an example of one of the three initial radar lines, Line 2 (Fig. 10.6), selected because this line passes over the region of the magnetic feature (Fig. 10.4b). The interpretation of this radar line is presented as annotations on the same radargram (Fig. 10.7). Perhaps the most noteworthy feature evident on this radargram is an irregular reflecting surface appearing at a travel time of about 20 nanoseconds. Assuming that the electromagnetic wave speed in soil is 0.1 m/ns, this travel time equates to a depth of 1 m. This reflecting surface is identified by the solid black line segments drawn on Fig. 10.7b. An irregular surface can be characteristic of limestone because of dissolution of the rock at its interface with soil and, for this reason, this interface is interpreted to be the top of the limestone. The dashed black line segment shown on Fig. 10.7 delineates an area along the radar line where this reflecting surface becomes deeper and weaker, or disappears entirely. This corresponds to the area of thicker soil evident in EMI quadrature data (Fig. 10.4a) and the weakening or loss of the reflection from this surface results from the loss of radar wave amplitude as it must propagate deeper through the attenuating clay. It is also possible that the absence of the reflecting surface in the radargram is associated with a soil-filled void in the limestone (Fig. 10.5b). However, at a length of about 20 m, this opening would be much larger than any known to exist on this property and, therefore, thicker soil is a more plausible interpretation. Evidence of soil-filled voids consistent with the scenario illustrated in Fig. 10.5b does appear in the radargram. These are small gaps in the reflecting surface at the beginning of the line and at a distance of 5 m along the line. Even with the 100 MHz center-frequency antennas, penetration was poor. Only multiples (Sect. 9.2.3) are evident at time greater than about 40 nanosecon ds (the dashed white line on Fig. 10.7b) indicating a maximum achievable GPR depth of about 2 m.
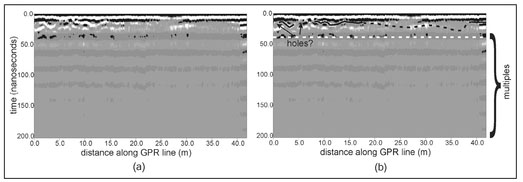
Figure 10.7. Radargram from Line 2 (Fig. 10.6) as (a) a gray-scale plot and (b) with interpretive annotation.
The magnetic feature (Fig. 10.4b) and GPR data (Fig. 10.7) from the first phase of the geophysical investigations present a 'picture' of the subsurface consistent with the possible buried treasure scenario depicted in Fig. 10.5. For this reason, a follow-up geophysical study was executed where only GPR measurements were made. In an effort to increase resolution (Sect. 9.4.4) 200 MHz center-frequency antennas were used and a small area around the magnetic feature was selected for more intensive GPR measurement. Specifically, twelve radar lines were surveyed, each in the same direction as the three identified in Fig. 10.6 and about 5 m long, spaced at intervals of about 30 cm over the medium gray region illustrated in Fig. 10.6. Aradargram of a 200 MHz center-frequency antenna radar line acquired directly over the top of the center of the dipole magnetic response shown in Fig. 10.4b is given in Fig. 10.8. As annotated, there appears to be a small gap in the top of the limestone surface as well as an isolated reflector suggestive of a buried metal object. The radargram for a parallel line about 1 m away from this line is shown in Fig. 10.8b. Here, the top of the limestone (dashed blackline) appears intact and this finding is further evidence to support the hypothesis that a small isolated soil-filled void exists within the limestone.
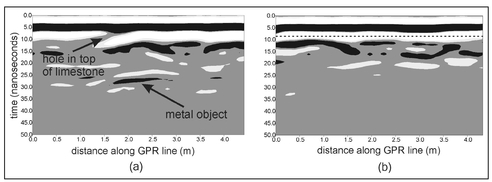
Figure 10.8. Gray-scale radargrams of (a) a radar line acquired directly over the center of the magnetic dipole (Fig. 10.4b) and (b) a radar line approximately 1 m away.
Based upon the interpretation of the geophysical data, an excavation was undertaken in the area of the magnetic feature (Fig. 10.4b and the medium gray area shown on Fig. 10.6). An illustration of the subsurface structure exposed by the excavation is shown in Fig. 10.9. The near-surface soil is actually a mixture of soil and rocks that is not naturally occurring but created by grading of the site to allow access to a once active limestone quarry about 100 m away from the excavation. What was interpreted to be an interface between soil and limestone is actually an interface between disturbed and undisturbed soil. Below the undisturbed soil, dense clay was revealed with the actual top of limestone below the dense clay. The presence of the electrically conductive clay prevented the radar waves from reaching the claylimestone interface so that there is no manifestation of the limestone layer in any of the GPR data. What was interpreted as a gap in the top of the limestone in the GPR data is actually an interruption of the disturbed/undisturbed soil interface caused by the presence of a large block of quarried limestone, examples of which are visible in the annotated photograph of the site (Fig. 10.3). The ferromagnetic object that appears in the magnetic data and is identified in the radargram as a metal object (Fig. 10.8a) is correctly identified by the geophysics. However, it is a length of steel cable rather than treasure buried by Jesse James. A search of historical records revealed a photograph showing that, in the early nineteen hundreds, a crane associated with quarrying operations was located on the study area. It is likely that the quarry block was intentionally buried to anchor the crane using steel cables,
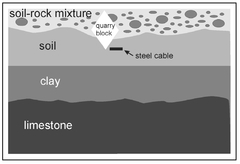
Figure 10.9. Illustration of the subsurface within a vertical cross-section as revealed by excavation.
The only apparent inconsistency between the GPR data and the actual subsurface conditions revealed by excavation is the absence of the quarry block (Fig. 10.9) in the GPR data. This is not actually an inconsistency but rather a rarely encountered situation where a buried object's shape and orientation make it 'invisible' to GPR. As illustrated in Fig. 10.10a, the slope of the sides on the quarry block, as oriented, are quite steep and, for most antenna positions, no reflected ray can be 'captured' by the receiving antenna. There is one exception to this situation and that occurs when the antenna pair is directly over the point of the diamond-shaped quarry block. In this position, a vertical transmitted ray is incident on the upper point of the object. When a ray is incident on a sharp point a special effect, known as diffraction, occurs. The term diffraction has multiple meanings but here its meaning is that a single ray incident on a sharp point 'explodes' into many reflected rays in different directions (Fig. 10.10b). The energy contained in this incident ray becomes distributed among many diffracted rays so that each diffracted ray contains only a small portion of the energy contained in the incident ray. Any diffracted rays that may reach the receiving antenna are typically too weak to be detected. This is why the quarry block, or other features of similar shape and orientation, may be undetectable by GPR.
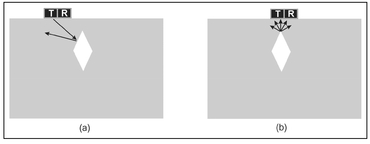
Figure 10.10. Illustration of how shape and orientation render a buried object undetectable by GPR. When the antenna pair is not directly over the top of these objects (a) reflected rays are never directed towards the receiving antenna. The only time a reflected ray can reach the receiving antenna is when the antenna is directly over the point of the object. In this position (b), diffraction renders the reflected rays too weak to be detectable.
The geophysical data acquired at the Jesse James treasure site is entirely consistent with both the hypothesis of treasure emplaced in a soil-filled limestone void (Fig. 10.5b) and the actual subsurface structure exposed by excavation (Fig. 10.9). The buried treasure interpretation is entirely a result of the assumption that the shallow interface evident in the radar is the top of the limestone, an assumption that proved false. From the geophysical measurements made at this site, there is noway to characterize the material properties within any layer and, because of this fact, the interpretation of the geophysical data was incorrect.
The application of geophysical methods, specifically magnetometry and EMI, to locate a possible mass grave was discussed in Sect. 8.3. The study area survey by magnetometry (Fig. 8.8) and EMI (Fig. 8.9) was also intensely surveyed with GPR. Because human bones are small and have only a small difference in dielectric constant with respect to most soil types, skeletal remains cannot be directly detected by this method. If graves can be detected by GPR measurements, it is indirectly as a result of relatively intact coffins or the disturbed soil left behind by the interment. The trench-like feature evident in the quadrature EMI data (Fig. 8.9) is believed to be disturbed soil from a mass grave.
The portion of the cemetery surveyed using magnetometry and electromagnetic induction was also surveyed with GPR using closely spaced lines in both the north-south and east west directions and with 100 MHz, 200 MHz, 500 MHz, and 1000 MHz center-frequency antennas. The presence of clay soil prevented even the 100 MHz antennas from providing penetration depths sufficient to reach probable depths of burial. Figure 10.11 is an example of the GPR data acquired at the cemetery. This radargram is along a line extending from east to west over the area of suspect disturbed soil (Fig. 8.9) and is from the 500 MHz center frequency antennas. There appears to be an interface at about 18 nanoseconds below which only noise is present in the data. This interface is likely the top of a clay Soil layer. Apart from some minor variations in the first several nanoseconds (depths less than 10 cm), the radargram is dominated by horizontal bands resulting from a number of horizontal interfaces. There is no visible evidence in this radargram of disturbed soil or isolated reflectors.
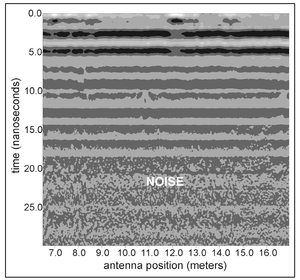
Figure 10.11. Gray-scale radargram of500 MHz center-frequency GPR data acquired over an area believed to be disturbed soil at a cemetery.
When conditions are such that radargrams are dominated by horizontal bands, there is a method to enhance subtle features known as average trace removal. Recalling that a trace is the variation in recorded wave amplitude as a function of time for a particular location of the antenna pair and that a radargram is composed of many traces associated with varying antenna pair positions (Sect. 9.2.2), it is clear that, for any radargram that exhibits only continuous horizontal banding, every trace is identical. A synthetic radargram for a circular reflector below a strongly reflecting horizontal interface is shown in Fig. 10.12. Here, the horizontal interface produces a strong reflection and the hyperbolas associated with the top and bottom of the circular object, although weak, are discernable.
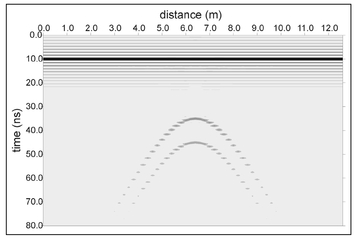
Figure 10.12. Synthetic gray-scale radargram for a horizontal interface above a circular reflector.
If the reflection coefficient (Sect. 9.1.2) of the layer is large or the reflection coefficient of the circle is small, the reflection from the circle could be too weak to be evident on the radargram. Figure 10.13 shows sequentially, from left to right, traces for the first, second, middle, next to last, and last antenna pair position. For each trace, the reflection from the horizontal interface is identified and the reflections from the hyperbolas associated with the top and bottom of the circular object are annotated for the center trace. It is important to note 011 this figure that (1) the reflections from the circle are much weaker than that from the horizontal interface, (2) the first two and last two traces are identical, and (3) the hyperbolas associated with the circular object are absent in all but the center trace.
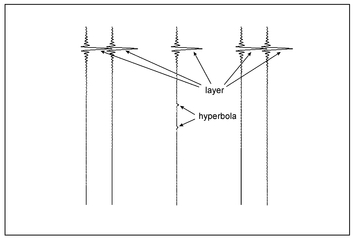
Figure 10.13. Line plots of the first, second, middle, next to last, and last traces from the radargram shown in Fig. 10.12.
The first, second, next to last, and last trace contains only the 'signature' of the horizontal interface and the contribution of the horizontal interface can be removed by subtracting any of these traces from all others. This is done on a time-point by time-point basis, in other words, subtracting the first time sample of trace 1 from the first time sample of all other traces, the second time sample from trace 1 from the second time sample from all other traces, and so on. Alternatively, an average of the first, second, next to last, and last trace can be defined as the average trace and this average trace can be subtracted from all traces to remove horizontal interfaces. An average trace can be defined in various ways, for example, the average of all traces, the first trace, the average of the first three traces,, depending on the character of the real radargram. Frequently, a number of definitions of the average trace must be tested before one that adequately suppresses unwanted features is established. Defining the average trace to be the first trace in the radargram shown in Fig. 10.12 and applying average trace removal to this data set yields the radargram shown in Fig. 10.14. Here, the horizontal interface has been entirely eliminated and the hyperbolas associated with the circular object have been substantially enhanced. This procedure cannot make the reflection from this object stronger, it merely changes the gray-scales used in the display. Grayscale displays such as those shown in Figs. 10.12 and 10.14 are constructed by dividing the full range of recorded wave amplitudes into a fixed number of shades of gray. For example, if 16 shades of gray are used and recorded amplitudes range between -800 and 800, each shade of gray will span a range of magnitudes of [800 -(-800)]/16 = 1600/16 = 100. This implies that an amplitude of 50 will be assigned the same shade of gray as an amplitude of zero and reflections this weak will not be apparent in the radargram. However, if the strongest reflections such as those from shallow horizontal interfaces are removed, the resulting wave amplitudes may only range from -80 to 80. For 16 distinct shades of gray, each shade will span a range of amplitudes of [80 —(—80)]/16 = 160/16 ' I! and there will be five shades of gray between zero and an amplitude of 50 so that amplitudes this weak will clearly be evident in the radargram.
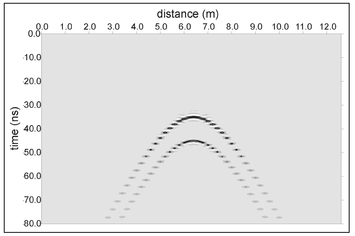
Figure 10.14. The same synthetic radargram shown in Fig. 10.12 after average trace removal to enhance the hyperbolas associated with the circular object.
Figure 10.15 is a gray-scale radargram of the GPR data shown in Fig. 10.11 after average trace removal has been applied. The portion of the radargram associated with short travel times is not shown in order to better highlight the three hyperbolas that are now visible. Two of these correspond precisely with the east and west boundaries of suspect trench evident in the EMI data (Fig. 8.9) and are annotated as diffractions, defined in Sect. 10.1 as manifestations of sharp corners (Fig. 10.10). The third hyperbola is believed to be some buried isolated object. A general interpretation of the vertical cross-section below this GPR line is shown in Fig. 10.16. There is no evidence of a reflection from the bottom of the trench shown in this illustration, either because this interpretation is wrong or, more likely, because the radar waves could not penetrate deep enough through the attenuating site soil to reveal this feature.
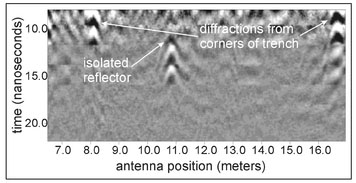
Figure 10.15. Annotated gray-scale radargram of the data shown in Fig. 10.11 after average trace removal.
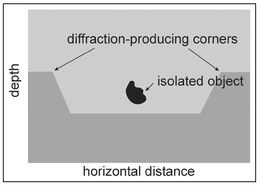
Figure 10.16. Illustration of the vertical cross-sectional structure as interpreted from the radargram (Fig. 10.15).