
Figure 8.1. Gray-scale display of the 7290 Hz EMI data acquired over a known tunnel in Guthrie, Oklahoma.
This chapter presents case studies that involve the application of electromagnetic induction. The purpose of this presentation is to demonstrate the uses for and results of EMI. Furthermore, these case studies will serve to enhance the understanding of the EMI concepts presented in the previous chapter.
Examples will be given here that demonstrate the use of EMI to detect and locate buried features that are both metallic and non-metallic and the role of the two measured EMI components, in-phase and quadrature, in data interpretations.
Guthrie, Oklahoma is a small town just north of Oklahoma City. Today, it can be described as quaint with numerous old buildings, having interesting architectures, which are filled with small restaurants and shops. This was not the case during the 'Ol' West' period of the late 1800s when it was reputed to be far wilder than it is now. There is an old tunnel on the outskirts of Guthrie. This tunnel is lined with bricks and stones and it is well known to residents because its entrance is fully open, making the tunnel both visible and accessible. This tunnel is at least 3 m wide and at least 2 m tall. Exploration of this tunnel reveals that it extends for a distance of at least 100 m and then abruptly dead-ends. Rumor has it that this tunnel was developed during the Ol' West period as a secret entrance to the town and, furthermore, this tunnel is part of a labyrinth of subterranean pathways beneath Guthrie. It is claimed that most of these tunnels were filled in during the town's more recent history making the above-described tunnel the only one that is known, and the remainder merely legend.

Figure 8.1. Gray-scale display of the 7290 Hz EMI data acquired over a known tunnel in Guthrie, Oklahoma.
In order to establish the efficacy of electromagnetic induction for the detection and mapping of tunnels, EMI studies were performed at the known Guthrie tunnel. Figure 8.1 presents the in-phase and quadrature components of the 7290 Hz data acquired over this tunnel.
The presence and location of the tunnel is clearly identifiable in the figure as the dark band extending almost completely across its center. The fact that this tunnel dead-ends is also evident in the figure. The location of the tunnel corresponds exactly to its known location and the sawtooth pattern is a manifestation of a variable walking speed during data acquisition. An interesting feature evident in the data is that the tunnel appears as a relative high with respect to the background. For an air-filled tunnel, it is expected that the tunnel would represent a relative low response in the quadrature component. There is no evidence of metal in the tunnel walls that could explain this uncharacteristic response. Figure 8.2 is similar to Fig. 8.1 except that this figure presents data acquired at 18210 Hz.

Figure 8.2. Gray-scale display of the 18210 Hz EMI data acquired over a known tunnel in Guthrie, Oklahoma.
At the higher frequency, the tunnel still appears as a relative in-phase high. However, a portion of the tunnel now appears, as expected, as a relative low in the quadrature component. In spite of the fact that this tunnel is accessible and has been inspected, there is no known reason for the tunnel to appear as a relative high in the in-phase component and the lower frequency quadrature component. Since lower frequencies penetrate deeper into the ground (Sect. 7.7.1), one plausible explanation is that this unexpected response, particularly at the lower frequency, is associated with conditions beneath the tunnel floor. It is possible that the roof, walls, and floor of the tunnel are sufficiently porous to allow the tunnel to act as a 'drain' for soil moisture so that water in the soil moves into the tunnel, percolates through the floor, and accumulates under the tunnel.
A second EMI field study was executed in downtown Guthrie several blocks north of the known tunnel site. The reason for this study was that a bath house once existed at this site and there is a rumor that, at one time, there was a secret entrance via the tunnel to this building. Figure 8.3 shows both the in-phase and quadrature components of the EMI data acquired at 18210 Hz. The gray strip extending north-south at about 5 m west is believed to be the tunnel. This is directly in line with, and north of, the known tunnel (Fig. 8.1), and these two surveyed areas are separated by a football stadium. It is also known that a portion of the tunnel was backfilled as part of the construction of the stadium. This is the reason why the tunnel shown in Fig. 8.1 abruptly terminates at its north end.
The location of the bath house is shown in Fig. 8.3. The quadrature display shows a number of features. First, there is dark band extending horizontally across the center of the plot. Because this feature is in-line with the known tunnel, it is believed to be a continuation of this tunnel and perhaps a main subterranean thoroughfare below the town. There is also a diagonal feature extending from the bath house location to this presumed main tunnel. This feature is quite likely the secret bath house entrance providing access from the main tunnel. There is also a weaker feature extending across the bottom. The survey region was over a road and, as annotated on Fig. 8.3, this is a known storm drain.

Figure 8.3. Annotated gray-scale display of the 18210 Hz EMI data acquired over a suspected tunnel in Guthrie, Oklahoma.
The in-phase data shows no evidence of the secret bath house entrance but do show the main tunnel and the storm drain evident along the bottom of the quadrature data. Another feature in the in-phase data, but absent in the quadrature component, is a connection between the storm drain and the suspect tunnel at about 43 m north. The dark spot appearing in the in-phase data is a manhole cover. The storm drain and its connection to the suspect tunnel offer some explanation as to why both the air-filled tunnel and the air-filled storm drain appear as highs in both the in-phase and quadrature components. By virtue of the apparent connection between the tunnel and the storm drain, it is clear that the tunnel has been integrated into the city's storm drain system. The tunnel, the storm drain, and the connector may have some metal reinforcements that cause them to have a higher average electrical conductivity. If this is not the case, the positive response of these features could be a result of their function. Because they are part of an integrated storm drain System, it is not unreasonable to assume that they are partly filled with water causing them to have an averaged electrical conductivity greater than air and, perhaps, greater than the surrounding soil.
William Kidd was an English businessman living on Wall Street in Manhattan. Seeking riches and adventure, he contracted with England as a privateer, a ship captain who would patrol the oceans to defend against acts of piracy. This arrangement allowed Captain Kidd to share in the spoils of this venture, splitting the treasure confiscated from ships belonging to the pirates and enemies of England with the British crown. Kidd began patrolling the shipping routes of the Indian Ocean in his ship the Adventure Galley. He and his crew achieved little success as privateers so they too became pirates. As a result of these acts and Kidd's murder of a member of his crew, he was a wanted man in England. In 1698, the Adventure Galley was irreparably leaking on its return to Isle St. Marie, a safe haven for pirates off the east coast of Madagascar. The Adventure Galley was scuttled just off a careening beach in the harbor of Isle St. Marie. This marked the end of Kidd's era as a pirate and he returned to New York where he was subsequently arrested and extradited to England to stand trial. William Kidd was convicted of murder and publicly hanged in 1699. A transcript of his trial remains as his legacy and in it he reveals his story. The trial transcript provided the starting point for the quest for the Adventure Galley.
As part of a project to locate and identify the remains of a pirate ship in the harbor of a small island in the Indian Ocean, ancillary electromagnetic induction surveys,1 were performed in an attempt to confirm a tunnel or a tunnel complex rumored to have been developed by pirates. While the Adventure Galley was the primary target of the geophysical effort, exploration of a small island ('Pirate Island') in the Isle St. Marie harbor revealed two partially collapsed, man-made vertical shafts in the host granite. There is evidence of pirate tunnel building activities elsewhere in the world so discovery of the vertical shafts raised questions as to whether pirate tunnels existed on Isle St. Marie. For this reason, a geophysical survey was conducted on this small island using electromagnetic induction in an effort to establish if the vertical shafts were associated with a tunnel complex.
The only relatively flat terrain on Pirate Island is its very top and, in some areas, narrow strips at the water line. The terrain and dense vegetation presented problems in acquiring data. The two previously discovered vertical shafts (Fig. 8.4) are on the ridge line and this was the primary area of focus for the EMI surveys. In order to acquire data here, walking lanes were cleared using machetes.

Figure 8.4. Annotated photograph of 'Pirate Island' showing the locations of two partially collapsed vertical shafts.
Electromagnetic induction data was acquired at frequencies of 4050, 7290, and 15210 Hz. Figure 8.5 displays an annotated gray-scale map of the 15210 Hz quadrature data acquired on the top of the island. The black circles indicate the locations of the shafts and it appears that the shafts are connected, at some depth, by a tunnel. In Fig. 8.5, the lowest quadrature responses are depicted as white and light gray. There is a clear linear, low conductivity feature extending between the two shafts. This is consistent with an air-filled tunnel. There also appear to be low conductivity areas transverse to the main tunnel suggesting that this may be a tunnel complex.

Figure 8.5. Gray-scale map of the 15210 Hz quadrature response over a small area of Pirate Island. The known vertical shafts are indicated by black circles.
A second EMI survey was conducted at the water line. This very limited survey (several lines) indicated a linear high conductivity feature in line with the two hilltop shafts and the suspect tunnel. Further explorations revealed another vertical shaft hidden by vegetation at the base of the hill and this shaft was also in line with the other tunnel-like features. The linear feature that appeared in the beach survey is of high conductivity relative to the background. If this is a tunnel, it must be water-filled. Anecdotal evidence from pirate tunnel complexes elsewhere suggests that pirate tunnel complexes have the capacity for flooding to prevent access to certain areas (Fig. 8.6). This may be the case on Pirate Island.

Figure 8.6. Illustration of the possible tunnel configuration on 'Pirate Island.' As shown, there is a room that is accessible only through a tunnel that occurs below the water line. Entry to this room could have been prevented by the flooding of the access tunnel.
Racial tension was quite high in Tulsa during 1921. A false accusation of rape made by a young white woman against a young black man provoked an attempted hanging that ended in a 'race riot.' The ensuing racial conflict resulted in the total destruction of that city's Greenwood section, and the number of deaths of black men, women, and children is estimated to be between 150 and 300, making it the worst racial episode in the history of the United States. Despite numerous accounts of wagon loads of corpses passing through the streets of Tulsa, a single body has yet to be discovered.
In 1999, an eye witness stepped forward. As a boy, this man watched a trench being dug at Tulsa's Oaklawn cemetery. He also saw several crates containing the bodies of African Americans. He was quickly forced away from the site and did not witness the interment. Based on this account, an area of Oaklawn cemetery was identified for geophysical studies2 in support of the activities of the state appointed Tulsa Race Riot Commission. Human remains are too small to be directly detectable by geophysical methods. Hence, it becomes necessary to identify a burial site through indirect evidence, either detectable (metal) items interred with the remains or disturbances to the soil caused by the original excavation.
A gray-scale plot of the in-phase component of the EMI data acquired at 15210 Hz is given in Fig. 8.7. The band appearing along the entire southern extent of this plot is an artifact associated with a wrought iron fence that is several meters south of the survey area and is parallel to its southern boundary. There is an isolated high response occurring at about 25 m east and 10 m north. This is believed to be buried metal objects.
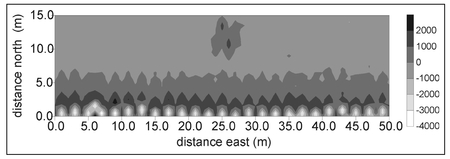
Figure 8.7. Gray-scale plot of the 15210 Hz in-phase EMI data acquired at a suspect mass grave site.
Case studies presented here and in Chapters 3 and 5 are intended to highlight applications of a specific geophysical technique. As established in Sects. 2.13, 4.13, and 7.12, the interpretation of geophysical data becomes more robust when multiple methods are applied. Although not all methods employed yield useful information at every site, it is difficult to completely assess the efficacy of a given method at a particular site prior to its application. For most of the case studies presented here, multiple methods have been employed. However, results of some of these methods are not presented because they did not yield results relevant to the buried targets of interest. At Oaklawn cemetery, magnetometry was another method utilized. The magnetic data acquired over the same region as that shown in Fig. 8.7 is provided in Fig. 8.8. The magnetic data shows the same artifact on the south side associated with the wrought iron fence and the isolated feature at 25 m east and 10 m north. A half-maximum depth estimation (Sect. 4.12.1) was applied to this feature to provide a depth estimate of about 1.5 m. Based on the magnetic and in-phase EMI response, it can be concluded that this feature is a ferromagnetic metal. While it might be associated with a mass grave, the area of anomalous response is too small to be direct evidence of a mass grave. Other isolated responses that appear in the magnetic data are headstones that contain ferrous metal reinforcements.
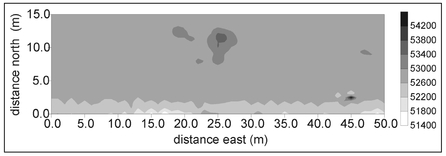
Figure 8.8. Gray-scale plot of magnetic data, in nT, acquired at a suspect mass grave site.
The best evidence of the existence and location of a mass grave comes from the 15210 Hz quadrature data (Fig. 8.9). The wrought iron fence appears in this component of the EMI data but the isolated ferrous metal object is absent. The most striking feature in this data is the approximate rectangular region of slightly elevated response extending in a north-south direction between about 9 and 16 m east. The east and west boundaries of this feature are relatively sharp and quite straight. Straight lines are not natural and usually such subsurface features are associated with human activities. It is believed that this area is one of disturbed soil, and this can be detected by geophysical methods long after the area has been excavated and backfilled. The reason for this is that the disturbed soil has not achieved the level of compaction of the surrounding soil. Since there is more void space in the disturbed soil, it can appear as a relative low response in the quadrature component of the EMI, provided that the soil voids are airfilled (air has a lower electrical conductivity than soil). If the voids are water-filled, the disturbed soil response will appear as a relative high because this area has a greater percentage of water compared to the surrounding compacted soil. The EMI survey was conducted shortly after an extended period of rain and, consequently, the area of elevated quadrature response is consistent with disturbed soil. This area is sufficiently large possibly to be a mass grave. It is of a shape inconsistent with utility excavation, and a records search has revealed no cemetery activities that can account for this feature. For these reasons, this small region is likely to be excavated by archaeologists in the near future.
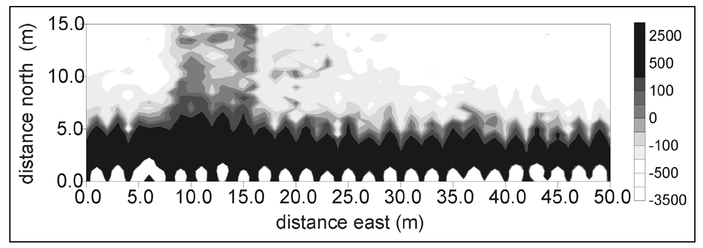
Figure 8.9. Gray-scale plot of the 15210 Hz quadrature EMI data acquired at a suspect mass grave site.
The Jebel Hamrat Fidan region lies in southwestern Jordan and the banks of the Wadi Fidan has had a long history of settlement dating from the Pre-Pottery Neolithic period (PPN) until early medieval times. One reason for this long occupation is that this area was a regional center for the production of copper, and the study of these sites can yield valuable information about early metallurgy, craft specialization, and social evolution.
Geophysical studies have been conducted at a number of sites in this region as a guide to archaeological excavations.3 Originally, three geophysical techniques—magnetometry (Chapter 4), EMI, and ground penetrating radar (Chapter 9)—were selected for use at these sites. Magnetometry and ground penetrating radar were expected to be the primary techniques for mapping buried architecture, while EMI was to be used for mapping seams of copper ore at formerly mined sites. For various reasons, magnetometry and ground penetrating radar failed to reveal any buried architecture. As a last resort, EMI was employed and, surprisingly, it provided a quite detailed map of buried wall structures. While EMI has successfully been used to locate and identify buried metal objects, voids, utilities, and disturbed soil, this is the first known application for delineating buried stone walls. In this initial field study at Wadi Fidan, buried walls at three sites were mapped using EMI. The results for one of these sites is presented here.
Figure 8.10 is a gray-scale plot of the 9210 Hz quadrature data acquired at the PPN site in the Fidan region. This site, known as Wadi Fidan A, is at the mouth of the Wadi where it empties into the Wadi Arabah. The site sits on a plug of monzogranite, and a small excavation at the site4 established stonewall construction typical of the late PPN.
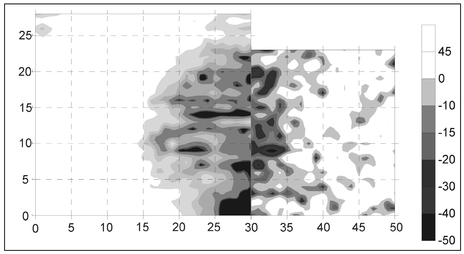
Figure 8.10. Gray-Scale plot of the 9210 Hz quadrature data acquired at a PPN site in Wadi Fidan, Jordan. Units of length are meters.
The relative low responses in Fig. 8.10 exhibit a linear and rectilinear pattern suggestive of buried wall architecture. Although the site had gone without rain for many months prior to the survey, it can be hypothesized that this extremely dry soil retains a small amount of moisture making it more electrically conductive than buried stone walls. This is also consistent with the pattern of lows shown in Fig. 8.10 being associated with buried stone walls. It is not the walls that are manifested in the EMI data but rather the absence of the slightly more conductive host soil. Variations in the magnitude of the responses apparent in this figure could be a result of variations in wall height and/or thickness.
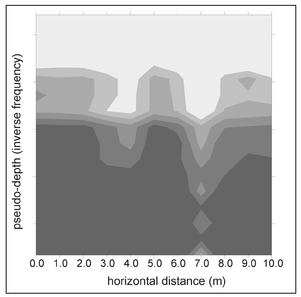
Figure 8.11. Gray-Scale plot of a vertical slice obtained by frequency sounding using quadrature data acquired at a PPN site in Wadi Fidan, Jordan.
In a subsequent geophysical study at Wadi Fidan A, EMI was applied to a limited area in an attempt to characterize the vertical structure of the buried walls5 indicated in Fig. 8.10. In this study, 16 frequencies were used to implement frequency sounding (Sect. 7.7.1). An out-of-focus image of a vertical slice through the survey region is presented as a gray-scale plot in Fig. 8.11. This presentation is conceptually similar to the synthesized result given in Fig. 7.19, but here the depth is indeterminate because the frequency has not been converted to skin depth. The frequency sounding has resolved the vertical wall structure and these appear as medium gray features extending upward from the underlying rock (black) into the overlying soil (light gray).
Wadi Fidan A was excavated in 1999, confirming the geophysical results and revealing massive walls (Fig. 8.12), in excess of 3 m tall with doorways and window openings.

Figure 8.12. Archaeologist Thomas Levy views Wadi Fidan A following its excavation.
Casinum was a Roman city on the Via Latina in the central hills of Italy between Rome and Naples. This site is now within the modern city of Cassino and it is overlooked by the famous abbey of Monte Cassino situated high on a mountain above. Three main structures have been excavated at Casinum—a theater, an amphitheater, and a mausoleum. The ancient city is likely of Volscian origin and is mentioned in the history of the Hannibalic War. Canisum is, perhaps, best known for a nearby villa where Mark Antony held frequent orgies.
Geophysical studies were performed at a relatively small flat site at Casinum where there was no knowledge of any subsurface architecture. As in the studies of Wadi Fidan A (Sect. 8.4), a number of geophysical methods were employed, but only EMI yielded any indication of the existence of buried walls and other features. Based on EMI experience at Wadi Fidan A, it was hoped that the EMI survey would be executed during an extended dry period. Otherwise, differential soil moisture content could mask the more subtle buried stone walls. This did not occur—in fact the EMI survey was performed immediately after a rainfall. For this reason, no useful EMI results were expected. In-phase and quadrature data were acquired at three frequencies at this site. From this data, only the 7290 Hz quadrature component (Fig. 8.13) yielded any information suggestive of buried features of archaeological significance. As annotated on this data, there is a strong low response (dark gray) extending westward across the survey area at its southern end, and this is interpreted to be a cobblestone road.
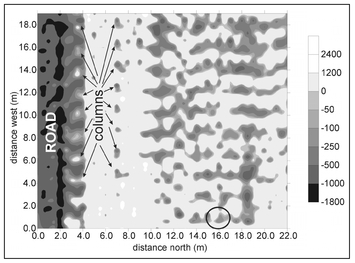
Figure 8.13. Annotated gray-scale plot of the 7290 Hz in-phase component of the EMI data acquired at the Casinum site after a period of rain.
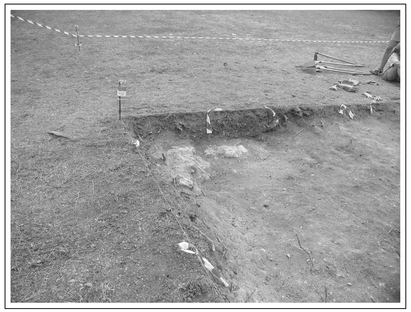
Figure 8.14. Photograph of a portion of the Casinum excavation displaying the exposed wall foundation.
Paralleling the road there is a sequence of isolated low responses at about 8 m north. These are spaced near-uniformly at intervals of approximately 2 m and could be a row of column bases. A similar pattern of isolated high responses occurs along the northern boundary of the road. These could also be associated with the presence of columns. However, they appear as high responses rather than low responses. One interpretation of these features is that these columns are gone, leaving behind holes in the roadbed that have filled with soil. The northern half of the survey area shows a pervasive pattern of linear and rectilinear features suggestive of buried walls. A small portion of this site (the northeast corner) has been excavated and this has revealed buried foundation walls consistent with those shown in Fig. 8.13. A photograph of a portion of this excavated area is shown in Fig. 8.14 and the light colored stone in this photograph is the corner within the circle indicated in Fig. 8.13.
Electromagnetic induction data was re-acquired approximately one week after the initial survey was completed. The survey area is the same as that shown in Fig. 8.13; however, there was no rainfall during the period between the two surveys. There is no evidence of buried architecture in either the in-phase or quadrature components at any of the three acquired frequencies. For comparative purposes, the 7290 Hz m-phase component is given in Fig. 8.15. In light of the findings at Wadi Fidan A (Fig. 8.10), two obvious questions are: Why did the walls appear in the in-phase component for Casinum and the quadrature component for Wadi Fidan A, and why didn't the walls at Casinum appear when the soil was dry rather than wet?

Figure 8.15. Annotated gray-scale plot of the 7290 Hz in-phase component of the EMI data acquired at the Casinum site after a dry period.
To answer the first question, it must be recalled that the relative proportion of an EMI response distributed between the in-phase and quadrature components depends on electrical conductivity. As the conductivity increases, the response manifested in the in-phase component will exceed that of the quadrature component (Sect. 7.7.2). At Wadi Fidan A, the soil was quite dry and it's response is expected to be much stronger in the quadrature component. Following the rain at Casinum, the soil was probably fully saturated. This increases the soil moisture sufficiently to raise the electrical conductivity of the soil to the point where its response is stronger in the in-phase component. The walls at Casinum appear as a much stronger EMI response than those at Wadi Fidan A. At both sites, it is not the walls that cause the response but the water in the soil. Since the soil at Casinum has a much higher moisture content, these walls exhibit a greater conductivity difference with respect to the surrounding soil. The soil at Casinum is likely saturated because there is no variation in the background soil response (Fig. 8.13) and the walls do not appear in the dry soil survey (Fig. 8.15) because this soil is not truly dry. The variations in response evident in Fig. 8.15 are likely a result of spatial variations in soil moisture caused by differential drying, and these variations mask the presence of buried architecture.
Khirbet en-Nahas (KEN) is an Arabic name meaning 'ruins of copper'. It is so named because this site is believed to have quite an important history related to copper metallurgy in the southern Levant. The site lies on the southern bank of the eastern reaches of the Wadi al Ghuwayb and, at approximately 10 hectares in size, it is one of the largest premdustrial copper working sites in the Levant. The main periods of occupation of this site are from the Iron Age to the Roman/Byzantine period.
A photograph of a portion of the KEN site is presented in Fig. 8.16. The most striking feature in this photograph is the remains of a large stone-walled fortress. Geophysical investigations were performed within the fortress and immediately outside of the fortress walls.6
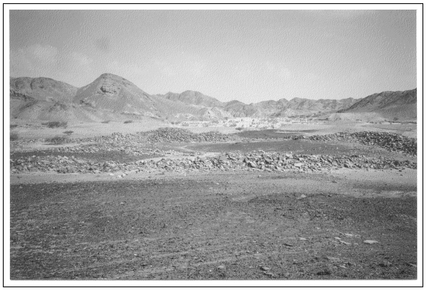
Figure 8.16. A photograph of a portion of the KEN site showing the remains of a large stone-walled fortress.
Figure 8.17 displays, as a gray-scale plot, the 15210 Hz quadrature EMI data acquired over a narrow strip immediately outside of the fortress. This area is in the foreground of Fig. 8.16. As annotated, this data exhibits a number of subsurface features. There are several linear and rectilinear patterns of relative lows that are annotated with solid black lines. These are believed to be buried stone walls. The near-circular relative low within the solid circle is believed to be a buried stone-walled tomb. The lowest quadrature response, indicated by the dashed circle, is a surface feature. A stone pile exists at the location and it is expected that these stones produce no EMI response.

Figure 8.17. Annotated gray-scale plot of the 15210 Hz quadrature EMI data acquired over a narrow strip just outside of the KEN fortress. All distances are in meters.
As discussed in Sect. 8.4, the buried stonewalls appear in the EMI data as an absence of a response. This is because it was assumed that the electrical conductivity of the stone is quite small and the only response is that manifested by soil. The relative low response of the surface stone pile is a result of elevating the measurement point above the conducting soil. This is a direct consequence of the fact that a measured EMI response decreases with distance between the measurement point and the conducting feature (Sect. 7.5). Had this stone pile not been noted at the time of the EMI survey, it could easily have been misinterpreted as a subsurface feature. If surface or buried stones are ferromagnetic, their response could quite likely be as relative highs rather lows (Fig. 7.40).
The in-phase component of the 15210 Hz EMI data acquired outside of the fortress is shown in Fig. 8.18. There is no evidence of the stone pile here. There are, however, several linear and rectilinear low responses in this area. The cause of these responses remains unclear. The most obvious feature in the inphase data is the isolated high response (black) in the same area as the suspect tomb evident in the quadrature data (the solid circle on Fig. 8.17). This region of high in-phase response is more localized than the relative low at this same location in the quadrature response. One possible interpretation of this feature is that it is a metal artifact within the tomb.

Figure 8.18. Gray-scale plot of the 15210 Hz in-phase EMI data acquired over a narrow strip just outside of the KEN fortress. All distances are in meters.
Figure 8.19 is a gray-scale plot of the 15210 Hz quadrature data acquired within the fortress. As annotated, there is some evidence of linear and rectilinear patterns as relative lows that are suggestive of buried stone walls. The area of the lowest response (white) is a large surface stone pile associated with the collapse of the upper right portion of the fortress wall.

Figure 8.19. Annotated gray-scale plot of the 15210 Hz quadrature EMI data acquired within the KEN fortress. All distances are in meters.
Magnetic data was also acquired within the fortress (Fig. 8.20). Eighteen well defined dipoles appear in the magnetic data and these are identified by circles. These isolated ferromagnetic objects exhibit a pattern that does not appear random indicating that their placement was intentional. These dipole locations also do not correlate with the possible walls identified with EMI (Fig. 8.19) suggesting that they are not associated with the wall construction.

Figure 8.20. Annotated gray-scale plot of the magnetic data acquired within the KEN fortress. All distances are in meters.
Finally, it should be noted that magnetic data was also acquired over the narrow strip outside of the fortress (Figs. 8.17 and 8.18). These data revealed no anomalous measurements suggesting that the linear and rectilinear features evident in the in-phase data (Fig. 8.18) are not ferromagnetic. More importantly, there is no magnetic response comparable to the high response apparent in Fig. 8.18 so that, if this feature is a metal artifact, it is not a ferrous metal.
1. A.J. Witten and I.J. Won, 'Expedition adventure part 1: overview and pirate tunnels', Proceedings of the Symposium on the Application of Geophysics to Engineering and Environmental Problems, 2002.
2. A.J. Witten, R. Brooks, and T. Fenner, 'The Tulsa Race Riot of 1921: a geophysical study to locate a mass grave', The Leading Edge (2001): 655-60.
3. A.J. Witten, T.E.Levy, R.B. Adams, and I.J .Won, 'Geophysical surveys in the Jebel Hamrat Fidan, Jordan', Geoarchaeology 15 (2000): 135-50.
4. R.B. Adams, 'The Wadi Fidan Project, Jordan', Levant 23 (1991): 181-83.
5. A.J. Witten, G. Calvert, B.R. Witten, and T.E. Levy, 'Magnetic and electromagnetic induction studies at archaeological sites in southwestern Jordan', Journal of Environmental and Engineering Geophysics 8 (2003): 209-15.
6. A.J. Witten, G. Calvert, B.R. Witten, and T.E. Levy, 'Magnetic and electromagnetic induction studies at archaeological sites in southwestern Jordan', Journal of Environmental and Engineering Geophysics 8 (2003): 209-15.