3
Indigenous Innovation during the IT Revolution
We Never Had It So Good?
Raicho Bojilov
ABSTRACT Based on the data and methodology presented before, we discuss recent trends in indigenous and imported innovation. Our results show that indigenous innovation in the US and the resulting total factor productivity (TFP) growth since 1990 are higher than in the 1970s and the 1980s, but still lower than what they used to be in the 1950s and the 1960s. The UK followed a similar path in recent times. In contrast, indigenous innovation in continental European economies and Japan slowed down even further in the period after 1990. Even worse, these latter economies were also slow in adopting innovations developed outside their borders. We conclude with a discussion of possible alternative explanations and an overview of the questions raised by our results but left for future research.
Introduction
The extended time span of the data that we use allows us to compare trends in productivity across countries and, most importantly, across very different time periods, from the pre-WWI era, to the period between the two world wars, to the post-WWII decades, to the years of the IT revolution. Our methodological approach enables us to recover the network through which indigenous innovation shocks propagate across the world and how the associated network structure changed from one era to the next. In this chapter, we focus on indigenous innovation and, in turn, productivity growth during the IT revolution. First, we compare the average growth rate of indigenous innovation for the period across countries and then examine the country-specific dynamics for the US, the UK, France, Germany, and Japan.
Our results show that there has been no structural change in the transmission network for the period after 1990 relative to the preceding post-WWII decades. Moreover, we see that the annual rates of indigenous innovation in the US and the UK have made only a partial recovery during the IT revolution: while higher than the rates for the period 1970–1990, they are still lower relative to the rates witnessed in the postwar years until the late 1960s. Also, our estimates show that the continental European economies and Japan have not experienced even such a moderate recovery. Interestingly, we find that unlike in the glorious 30 years after WWII, these economies have been rather slow in adopting the (IT) innovations originating in the US and the UK. We conclude the chapter with a discussion of the possible causes of the observed statistical patterns. In particular, we consider what may be the industry-level dynamics that stand behind the observed aggregate rates of indigenous innovation in the US.
1. Cumulative Indigenous Innovation after WWII
We start with an overview of the cumulative indigenous innovation in the US and the leading European economies after WWII. Figure 3.1 presents the cumulative indigenous innovation in the US, the UK, Germany, France, and Italy between 1946 and 2012. It points out a few noticeable facts. First, the US generated more cumulative indigenous innovation than any other major economy in the world during the period.
Second, Figure 3.2, which is the companion representation of the same data with linear predictions for the US indigenous innovation for the periods 1950–1970, 1970–1985, and 1985–2010, indicates the presence of a structural break in the indigenous innovation series for all countries around 1970. Third, the results show that the US witnessed a recovery in its rate of indigenous innovation in the mid-1980s. However, the new rate of accumulation appears smaller than its counterpart for the 1950s and the 1960s. The same figure shows that the main economies on the mainland of Europe also fell victim to a dramatic slowdown in the 1970s. Unfortunately for them, the estimates reveal that these economies never managed to experience a recovery of the type that the US enjoyed during the 1980s and the 1990s.
In fact, our point estimates for the cumulative growth of indigenous innovation in these economies are sometimes negative, but these somewhat puzzling negative rates are never statistically significant from zero. We are particularly cautious in our interpretation of the series for Germany because of the reunification of the country during the 1990s. Finally, the figure reveals that indigenous innovation in the UK followed a rather idiosyncratic path after WWII. The data suggest that the UK accumulated a lot of indigenous innovation during the 1950s but the process slowed down in the 1960s. Interestingly, since then its indigenous innovation appears to have grown at a more or less constant rate that is in the same ballpark as the US rate after the mid-1980s.

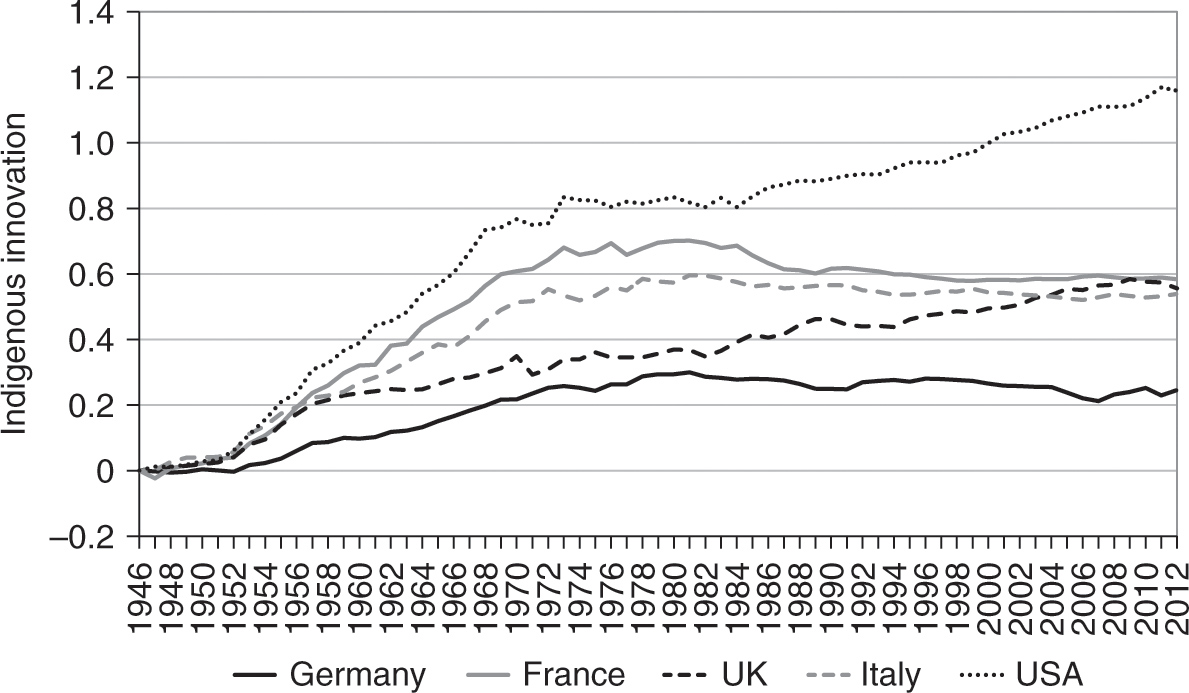
Figure 3.1. Cumulative indigenous innovation in the US, the UK, France, Germany, and Italy, 1946–2012


Figure 3.2. Cumulative indigenous innovation in the US, the UK, France, Germany, and Italy, 1946–2012, along with linear predictions for US indigenous innovation for the periods 1950–1970, 1970–1985, and 1985–2010
|
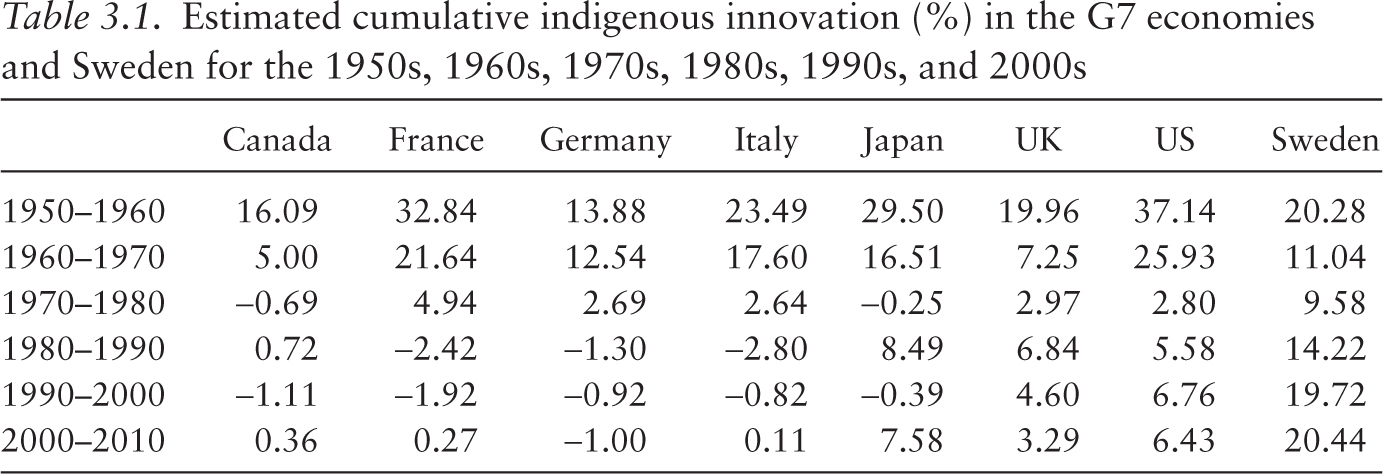
Table 3.1. Estimated cumulative indigenous innovation (%) in the G7 economies and Sweden for the 1950s, 1960s, 1970s, 1980s, 1990s, and 2000s |
||||||||||||||||
|
Canada |
France |
Germany |
Italy |
Japan |
UK |
US |
Sweden |
|||||||||
|
1950–1960 |
16.09 |
32.84 |
13.88 |
23.49 |
29.50 |
19.96 |
37.14 |
20.28 |
||||||||
|
1960–1970 |
5.00 |
21.64 |
12.54 |
17.60 |
16.51 |
7.25 |
25.93 |
11.04 |
||||||||
|
1970–1980 |
−0.69 |
4.94 |
2.69 |
2.64 |
−0.25 |
2.97 |
2.80 |
9.58 |
||||||||
|
1980–1990 |
0.72 |
−2.42 |
−1.30 |
−2.80 |
8.49 |
6.84 |
5.58 |
14.22 |
||||||||
|
1990–2000 |
−1.11 |
−1.92 |
−0.92 |
−0.82 |
−0.39 |
4.60 |
6.76 |
19.72 |
||||||||
|
2000–2010 |
0.36 |
0.27 |
−1.00 |
0.11 |
7.58 |
3.29 |
6.43 |
20.44 |
||||||||
Table 3.1 offers another cut of the data by comparing decade by decade the cumulative innovation of the world’s largest economies since the end of WWII. The results confirm the preceding observations. The US was the global innovation leader in the 1950s and the 1960s. During the same 20 years, France, Japan, and Italy were also generating a lot of indigenous innovation themselves. At the same time, the three major economies with the lowest rates of indigenous innovation were Canada, Germany, and the UK. The 1960s witnessed slightly lower rates of accumulation of indigenous innovation than during the preceding decade. Still, the US maintained its lead.
Figure 3.3 illustrates year by year this observation by plotting the accumulation of indigenous innovation in the US, the UK, France, Germany, and Italy from 1950 to 1970. Table 3.1 also shows that the generation of indigenous innovation dramatically slowed down in the early 1970s. In fact, during this turbulent period, France, Italy, Germany, and the UK managed to accumulate slightly more indigenous innovation than the US itself.
While the differences between the rate for the US and the rates for these countries are not statistically significant, this finding highlights the dramatic decline of indigenous innovation in the US during the 1970s. As Figure 3.4 shows, the US managed to regain its global leadership in the generation of innovation during the 1990s and the 2000s. However, the impressive relative performance of the US is due to both its own recovery and the dismal performance of the other major developed economies during the last two decades. The most intriguing aspect of our results is the stellar performance of Nordic economies since the 1970s, which is exemplified by the case of Sweden. As in all other economies, indigenous innovation in Sweden slowed down in the 1970s. However, it has steadily increased since then. In fact, cumulative indigenous innovation in Sweden increased by 20 percent during the 1990s, compared with only about 7 percent in the US, and by another 20 percent between 2000 and 2012, compared with only 6.4 percent in the US. Sweden is by no means an exception: we record a similar pattern for Finland, Denmark, and Iceland, too.

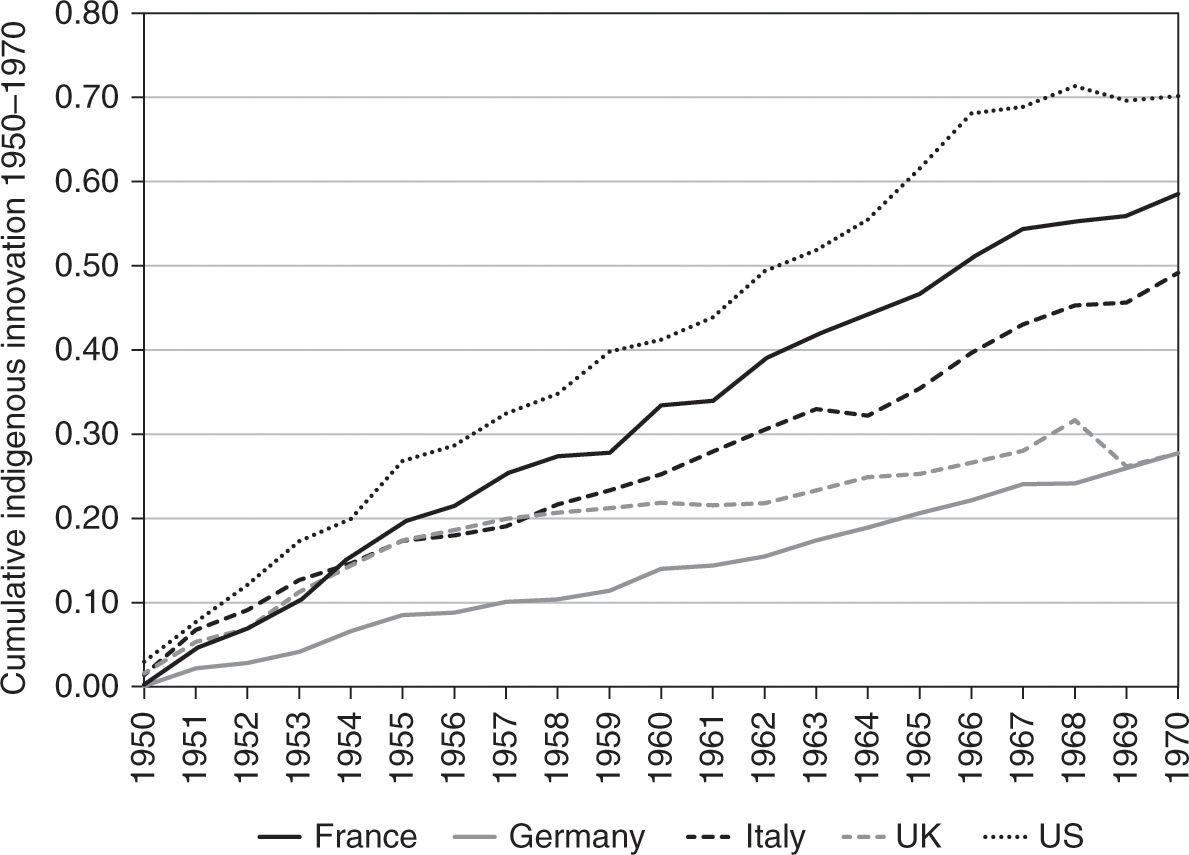
Figure 3.3. Cumulative indigenous innovation in the US, the UK, France, Germany, and Italy, 1950–1970

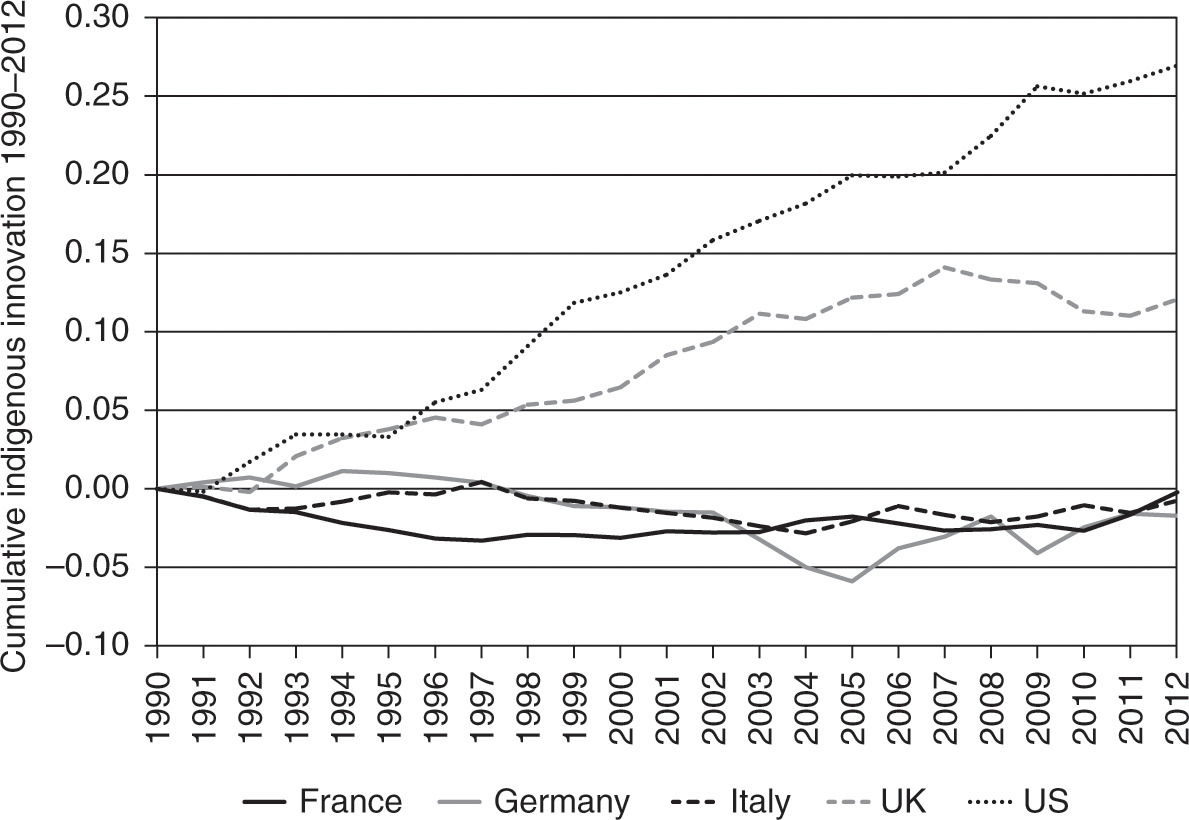
Figure 3.4. Cumulative indigenous innovation in the US, the UK, France, Germany, and Italy, 1990–2012
2. Comparison of Annual Rates of Indigenous Innovation during the IT Revolution
We continue by comparing recent trends in indigenous innovation and imported innovation across the developed world from 1990 to 2012. Table 3.2 reports the average annual indigenous innovation and imported innovation for the set of developed economies in our sample. It reveals that the average rate of indigenous innovation for the sample is higher for the period 1990–2012 than for the preceding period, 1970–1990. At the same time, we also find that the average rate of imported innovation for the sample is actually lower in the considered period than in the preceding two decades. Furthermore, we reject the hypothesis that there has been a structural change in the transmission network that allows innovation to propagate across the globe. Next, we discuss our estimates for the largest developed economies.
|
Table 3.2. Estimates of cumulative indigenous innovation and imported innovation (%) for 1990–2012 |
||||||||
|
Country |
Indigenous |
Imported |
|
ΔTFP |
||||
|
Australia |
0.42 |
0.16 |
0.58 |
0.57 |
||||
|
Canada |
0.11 |
0.12 |
0.23 |
0.34 |
||||
|
Finland |
0.32 |
0.39 |
0.71 |
0.87 |
||||
|
France |
0.03 |
0.03 |
0.06 |
0.02 |
||||
|
Germany |
0.08 |
0.03 |
0.11 |
0.03 |
||||
|
Italy |
0.00 |
0.00 |
0.00 |
0.05 |
||||
|
Japan |
0.08 |
0.02 |
0.10 |
0.03 |
||||
|
Netherlands |
0.23 |
0.24 |
0.47 |
0.41 |
||||
|
Norway |
0.07 |
0.24 |
0.31 |
0.16 |
||||
|
Spain |
0.09 |
0.11 |
0.20 |
0.09 |
||||
|
Sweden |
0.67 |
0.34 |
1.01 |
1.04 |
||||
|
United Kingdom |
0.35 |
0.26 |
0.62 |
0.66 |
||||
|
United States |
0.58 |
0.29 |
0.87 |
0.98 |
||||
|
Average |
0.26 |
0.17 |
0.43 |
0.37 |
||||
|
Schumpeterian |
0.02 |
|||||||
|
Notes: The first column reports indigenous innovation, while the second reports the contribution of imported innovation to TFP growth. The third column presents the sum of the first two, and the last one presents the actual TFP series. |
||||||||
Comparing the raw numbers, we find that the annual TFP growth rate between 1990 and 2012 is not higher than but very similar to the annual TFP growth rate for the first two post-WWII decades. Furthermore, accounting for short-term fluctuations and factors actually implies that the TFP growth rate in the earlier period was higher than the growth rate during the IT revolution. We explore these issues further by comparing indigenous and imported innovation during the IT revolution to their counterparts for the preceding decades. The average annual indigenous innovation in the US between 1990 and 2012 has been about three times higher than the average annual indigenous innovation between 1970 and 1990. At the same time, it is only about 60 percent of the average annual indigenous innovation for the period 1950–1970. We also find that the average annual imported innovation in the US for the period 1990–2012 is very similar to its counterpart for the period 1970–1990. Thus, imported innovation contributes about a third to the average annual growth in TFP during the IT revolution compared with about one-half for the preceding two decades.
The results for the UK are very similar. Comparing the average annual rates of TFP growth, we find that TFP growth in the immediate postwar decades is still a bit higher than in the years of the IT revolution. In more detail, we find that the average annual indigenous innovation in the UK increased more than two times after 1990 compared with the 1970s and even compared with the 1980s. Nevertheless, the British rate of about 0.36 percent, in the 1990s and the 2000s, is still less than half of what it was in the first decades after WWII. We find that, similar to the US, the average annual imported innovation in the UK since 1990 is lower than what it used to be for the period 1970–1990. As a result, indigenous innovation now accounts for about half of TFP growth in the UK. The only consolation for the UK is that the slowdown in its innovation after 1970s is relatively smaller than the slowdown in other European nations. Indeed, a comparison between the UK and France is quite revealing.
In the three decades after WWII, France experienced a spectacular TFP growth rate of more than 2.5 percent. Most of it, however, seems to have been associated with a rapid catching up to the best practices in the world, as witnessed by the high rate of imported innovation. In fact, the French annual rate of indigenous innovation between 1950 and 1970 was lower than those in the US and the UK. Our estimates show that both indigenous and imported innovation in France failed to recover in the 1990s and the 2000s from the slowdown of the 1970s. In fact, all sorts of innovation appear to have stagnated at rates that are indistinguishable from zero. The situation is very similar in Italy and Japan, which also experienced rapid productivity expansions in the first post-WWII decades. The case of Germany also appears very similar, but we are somewhat cautious in our interpretation because of the changing borders of the country and the associated adjustments in the growth accounting that were required to control for the effect of former East Germany.
The only other countries that have experienced a recovery in their indigenous innovation relative to the 1970s and the 1980s are the Scandinavian countries. In particular, Sweden and Finland have achieved very high rates of average annual TFP growth of around 1 percent since 1990. This performance compared favorably to the growth rates for the 1970s and the 1980s. In the case of Sweden, we record an increase in the average annual indigenous innovation from 0.46 percent for 1950–1970 to 0.69 percent during the years of the IT revolution. Both of these averages are much higher than the corresponding rate for 1970–1990. Interestingly, Sweden also improved in its ability to adopt innovations from abroad relative to the period 1970–1990. The evolution of innovation and productivity in Finland followed a similar path. On the basis of these findings, we make several conclusions.
Under the existing methodology for the estimation of TFP, there is no dramatic increase in productivity during the IT revolution despite all the anecdotal evidence that comes from industry- and microlevel studies. If anything, the average annual rates of indigenous innovation after 1990 are for the most part still lower than what they used to be during the first post-WWII decades, even for the US. While the US rate of indigenous innovation in the last two decades is higher than in the 1970s and the 1980s, it is still lower than its counterpart for the period before 1970. Similarly, the UK and the Scandinavian countries experienced a partial recovery in their rate of indigenous innovation. Our estimates also reveal that, in relative terms, the US is still the country with the highest rate of indigenous innovation, along with the Scandinavian countries and the UK. At the same time, the rates of indigenous and imported innovation in continental Europe ground to a complete halt in the years following 1990. In contrast, the Scandinavian countries continue to have much higher rates of indigenous and imported innovation than the rest of Europe, which has contributed substantially to their high productivity gains.
3. Dynamics of Indigenous Innovation in the Major Economies
One of the advantages of our empirical approach is that we allow each country to generate indigenous innovation, which at least in principle could be transmissible to all other countries. In the following paragraphs we review the post-WWII dynamics of indigenous innovation rates in the major developed economies with a focus on the last 30 years. We use the US as a benchmark in order to evaluate the evolution of indigenous innovation in other countries.
Figure 3.5 plots indigenous innovations in the US and the UK from 1950 to 2012. It illustrates that the 1950s are the decade with the highest indigenous innovation in the US, followed by the 1960s, usually in the range of 2 to 4 percent. The dynamics of indigenous innovation change in the early 1970s: the magnitude of the shocks declines sharply, while the persistence of the effect of the shocks increases significantly. In particular, the 1970s witnessed dismal indigenous innovation in the US that fluctuated between 0 and 0.5 percent on an annual basis. In turn, the US experienced only partial recovery in the 1980s as indigenous innovation lifted up a bit to the range of 0 to 1 percent.


Figure 3.5. Comparison between indigenous innovation in the US and in the UK after WWII
One of the big surprises of our results is that during the so-called IT revolution, we do not detect any peaks either in the raw data of productivity or in our decomposed series of indigenous innovation. In fact, it seems that the higher average rate of indigenous innovation in the 1990s and the early 2000s for the US is driven by higher realized minima rather than by some unprecedented positive innovation shocks. Furthermore, both the raw series themselves and our results show that the volatility in the innovation and productivity series declined over time until the onset of the Great Recession. Notably, these changes have been accompanied by an increase in the persistence of the effect of innovation shocks on US productivity. Consequently, the decline in the magnitude of the innovation shocks is somewhat offset by the duration of their positive impact on TFP growth. During the last years for which we have data, 2005–2013, we witness a dramatic slowdown in TFP growth to a range that has not been witnessed since the early 1980s. These findings run against the popular narrative that the US is in the midst of an unprecedented flowering of innovation.
In comparison, the UK experienced consistently lower rates of indigenous innovation in the 1950s and the 1960s. Interestingly, in the following decades, the differences between the indigenous innovation in the two countries decrease significantly, largely as a result of the slowdown in US indigenous innovation. In other words, the relative standing of the UK improved after the 1980s and the country retained a small but positive rate of indigenous innovation throughout the postwar era. Still, the UK also witnessed a dramatic slowdown in productivity just before the onset of the Great Recession. The extent of this decline seems to be even more severe than the one in the US.

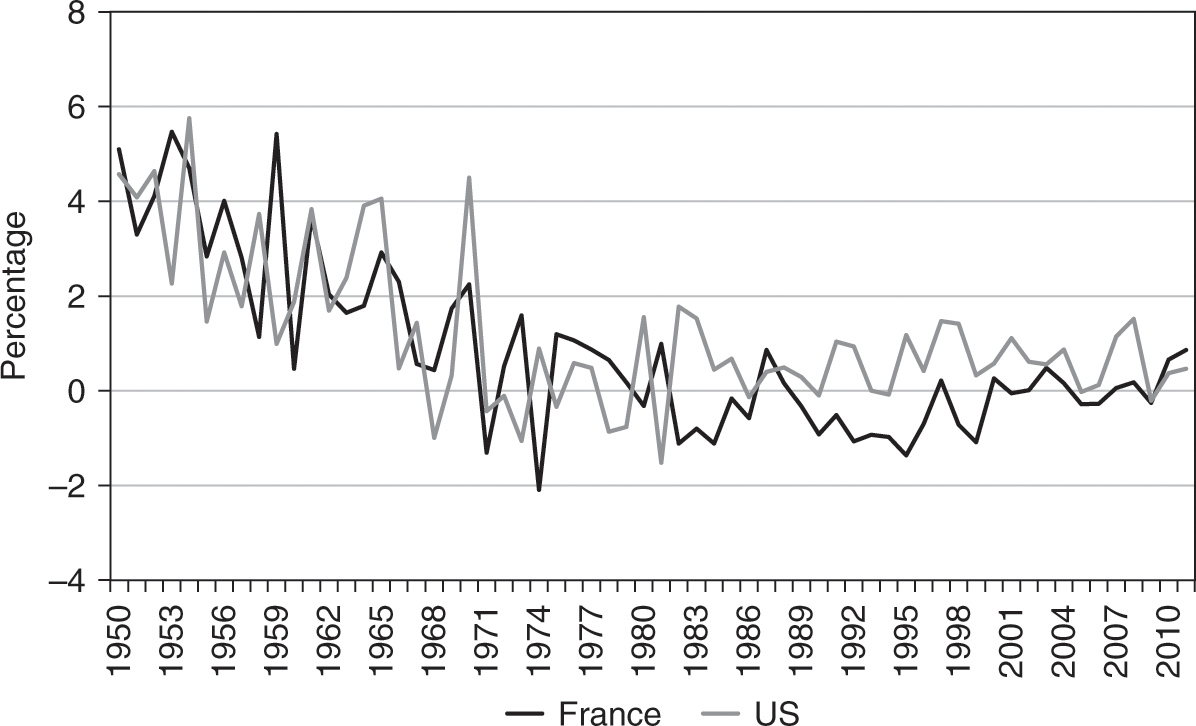
Figure 3.6. Comparison between indigenous innovation in the US and in France after WWII
The dynamics of indigenous innovation in France is very different, as illustrated in Figure 3.6. France experienced high but declining rates of indigenous innovation in the 1950s and the 1960, which were only slightly lower than the US ones. In the 1970s, France and the US actually had very similar rates of indigenous innovation. However, while in the 1980s and the 1990s the US experienced a partial recovery, French indigenous innovation continued to decline until it virtually reached zero in the 1990s and the 2000s. Figure 3.7 shows that the dynamics of indigenous innovation in Germany is very similar to that of France. The big difference between the two countries is that France appears to have consistently higher rates of indigenous innovation than Germany. Finally, Figure 3.8 reveals that indigenous innovation in Japan followed a very similar path to indigenous innovation in Germany, with the only difference being that Japan actually had higher rates of indigenous innovation than the US for a short time in the 1980s.

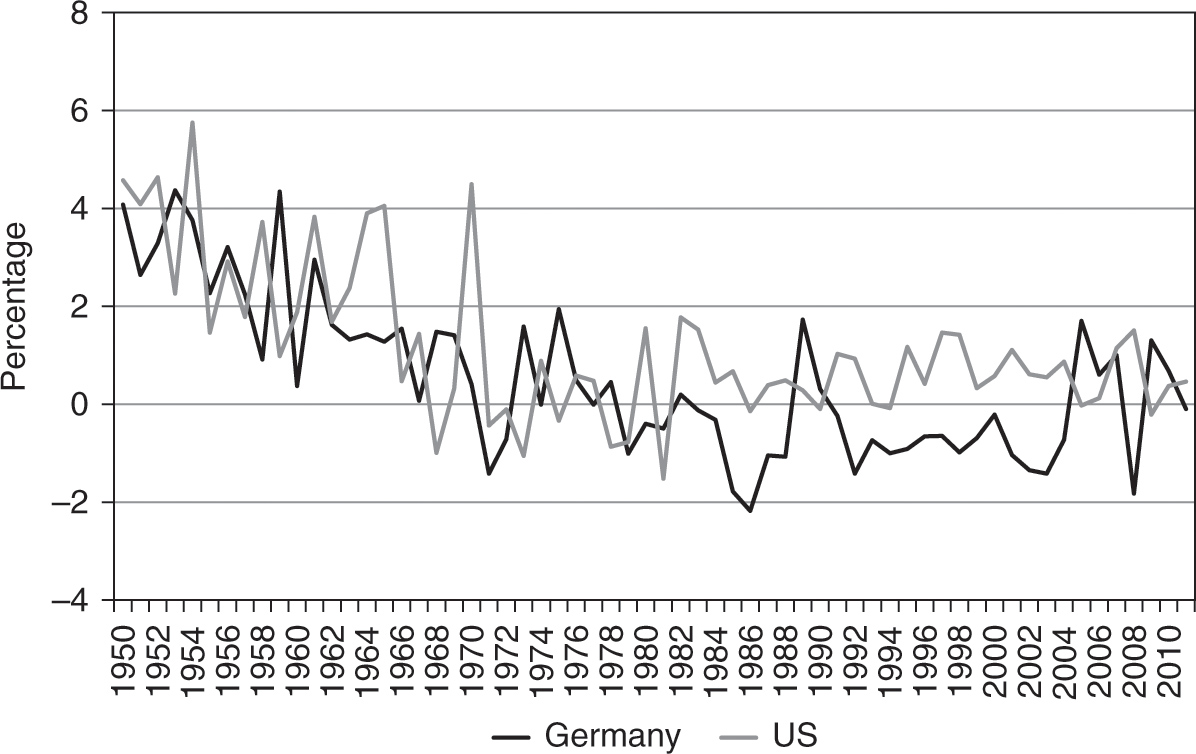
Figure 3.7. Comparison between indigenous innovation in the US and in Germany after WWII

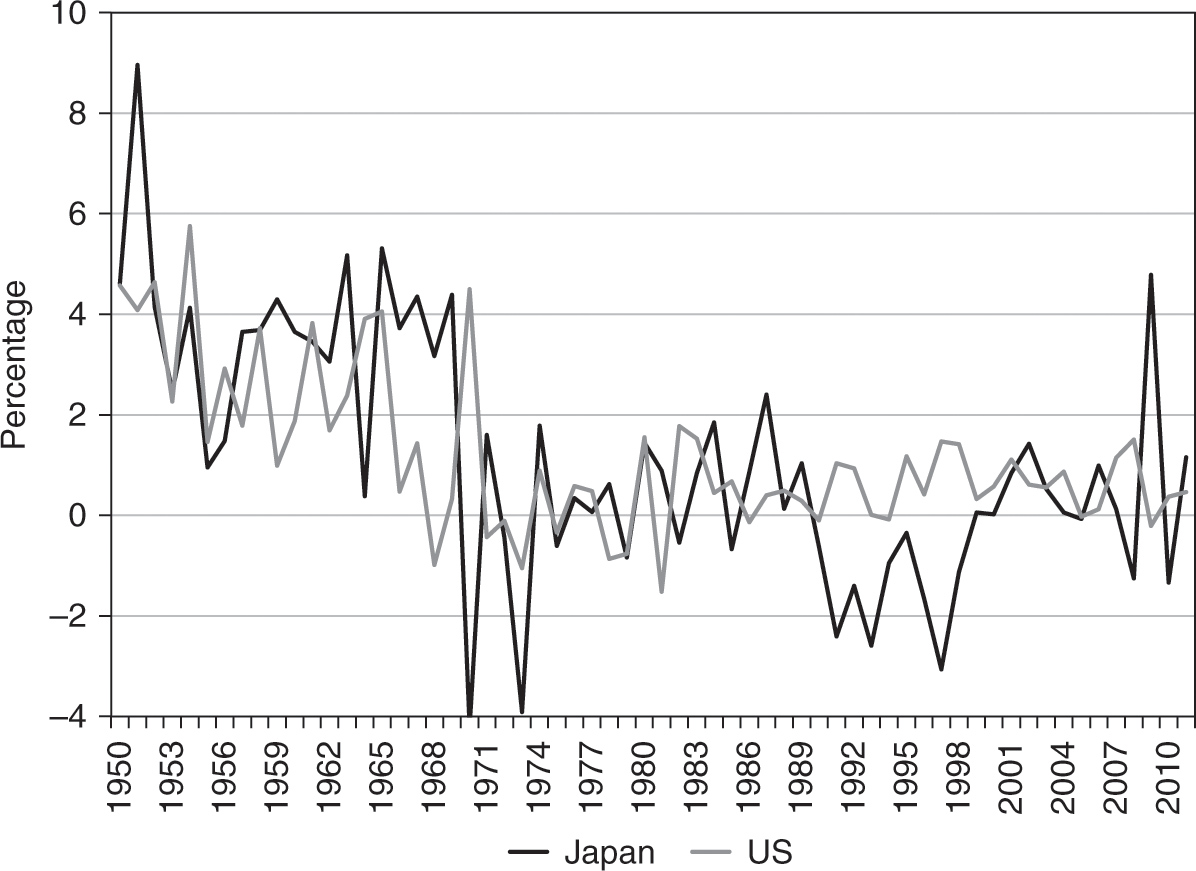
Figure 3.8. Comparison between indigenous innovation in the US and in Japan after WWII
4. Discussion: Choice of Measure and Possible Bias
There is no universally accepted measure of innovation, and all existing candidates have their pros and cons, depending on the investigated context. We have advanced so far a research agenda that aims at exploring the dynamics and spatial dependence of TFP, one of the existing measures, across countries and time to investigate how the dynamics of innovation has changed on a national level as a result of the IT revolution.
The main shortcoming of TFP as a measure of productivity is that it represents the disturbance term in a growth regression and, as such, it is a shadowy upper-bound estimate of innovation. At the same time, it incorporates innovation in all of its guises. Also, our data cover countries over long time horizons. The same, however, cannot be said about any of the other existing measures of innovation. At the same time, actual data on concrete measures of innovations have a number of advantages. One of them is that such measures refer to concrete economic phenomena, whose definition is unequivocal. In contrast, TFP measures offer at best a theater of shadows.
Another very important concern that needs to be addressed is the possibility that TFP growth understates productivity growth as a result of the specific nature of IT innovation. Existing measures of economic activity and the associated growth accounting were developed at a time when both production and consumption were not as dispersed in time and space as today. For this reason, the existing measures, the argument goes, likely understate the gains in efficiency and in individual utility.
We are sympathetic to such concerns about the relevancy of the existing methodology and practices in growth accounting. As the jury is still out, we consider our foregoing findings as one additional piece of evidence that will hopefully contribute to a better understanding of innovation during the IT revolution. Our view is that our findings at the very least provide a cautionary warning against the widespread euphoria about the great strides in productivity made during the IT revolution.
Moreover, a few observations make us discount the concerns that our results may suffer from a downward bias. Previous research based on microlevel data has indicated unequivocally that the US is the global leader in IT innovation. Thus, if the existing methodology in growth accounting were prone to underreport productivity and welfare gains, then one would expect that the raw TFP series for the US to be more affected than the TFP series in other developed economies. In other words, the presence of such a bias is likely to understate the differences in productivity growth between the US and, say, continental Europe. To the extent to which innovation in the IT sector is largely responsible for efficiency and welfare gains in the US over the last 30 years, this line of thinking implies that the gap between the US and economies that are less affected by IT innovation should be shrinking. The data do not appear to lend much support to such an argument.
5. A Possible Explanation
Understanding the sources of innovation and how it propagates across economies is of primary importance to understanding the economic forces that have shaped the trends in indigenous innovation that we have discussed here. The patterns that we have uncovered may appear at first sight puzzling and in contradiction to a plethora of microlevel and anecdotal evidence. We believe that an understanding of indigenous innovation in the IT industry and how it relates to innovation and productivity in the other industries is of primary importance. In what follows, we provide some evidence to support this claim, which also motivates much of the work reported in the following chapters.
Indisputably, the US economy defined the technological frontier in the first years after the end of WWII. Most European countries and Japan, however, managed to catch up with the US by adopting the best practices defined in the US. Moreover, these economies also successfully generated their own innovation that propagated across the globe. Thus, by the early 1970s, the technological differences between the US and the rest of the developed economies had shrunk considerably. Following the structural shocks of the 1970s, the aggregate productivity growth in the US recovered somewhat. Nevertheless, the productivity growth since 1990 has been lower than the productivity growth for the period 1950–1970.
A cursory review of cumulative productivity growth rates across major industries in the US since the mid-1980s reveals that productivity gains have been very unequally distributed across industries (see Figure 3.9 and Figure 3.10). The IT industry has been the undisputed innovation leader in the US since the mid-1980s, and that is reflected in its high productivity growth. Figure 3.9 shows clearly that the productivity in the IT sector during the IT revolution has increased more than twelvefold. Such gains dwarf the productivity growth in any other US industry.
Thus, it may seem at first sight that Figure 3.9 conforms to the accepted wisdom about the economic impact of the IT revolution. This is not the case. If innovations and the resulting productivity gains in the IT industry had such a profound and transformative effect on the economy, then one would expect to see the productivity gains in the IT industry spill over to the other industries of the economy. Yet Figure 3.9 casts a shadow on the story about the revolutionary and transformative nature of IT innovations: neither manufacturing nor services experienced productivity gains of nearly the same magnitude as the IT industry. Moreover, Figure 3.10 shows that productivity in the US manufacturing industries has been growing faster than productivity in service industries, in particular retail trade.

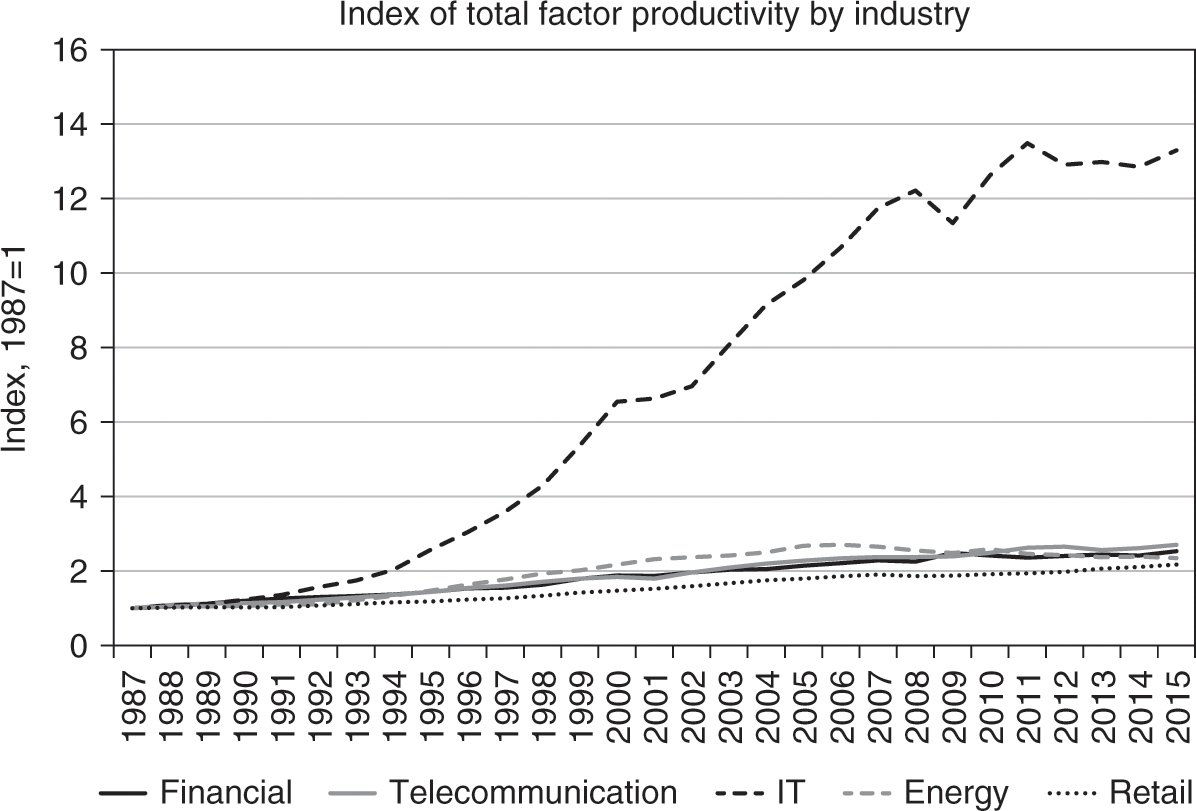
Figure 3.9. Divergence of productivity growth rates across industries in the US since the mid-1980s. Data source: Bureau of Labor Statistics.


Figure 3.10. Heterogeneity in productivity growth rates across major industries, excluding the IT industry. Data source: Banque de France.
Somewhat surprisingly, we do not witness, even with a lag, a major pickup in the productivity growth in other industries that are directly and indirectly connected to the IT industry. One would expect that if the IT industry were the engine of the US economy that generates the products, technologies, and techniques of the future, then the other industries would eventually experience a jump in productivity rates to levels comparable to those of the IT industry. Thus, one may wonder why aggregate productivity in the US has not grown much more in accordance with the innovations and major productivity gains that have been achieved in the IT industry.
These observations raise the possibility that the observed dynamics is due to the equilibrium interaction between innovation in the IT industry and the rest of the economy. To fix ideas, let us consider an economy with two sectors. The first is a traditional, mature sector. It is characterized by industries with high levels of market concentration, low rates of innovation, and, in turn, low rates of productivity growth. The second sector, called the “IT sector,” captures the features of emerging young and innovative industries. This sector is characterized by very high levels of innovation and productivity growth, as well as a high degree of competition. As usual, there are two factors of production, capital and labor, and we consider different scenarios for the intensity of the production process in each of the sectors. This setting reflects salient features of the US economy, for example. The setting that we explore follows in the footsteps of several recent advances in the endogenous growth literature, which tries to incorporate innovation and automation.
The ultimate objective is to characterize the steady states of such an economy and the transitional dynamics that results from a large innovation shock in the IT sector, such as the internet boom of the late 1990s and the early 2000s. The key dynamics that is captured in such a model involves the interaction between innovation and relative prices. An innovation shock in the competitive sector has two effects on the economy: one direct and one indirect. The direct effect is to boost productivity, increase wages, and attract more labor in the affected sector. The indirect effect operates through prices. In our setting, the companies that dominate the traditional sector may be able, under certain conditions, to maintain the relative high prices of their products by abusing market power in the form of high price markups. As a result, innovation can drive down the price of goods in the young, emerging sector relative to the goods in the established, mature sector. The implication is that the innovative companies face a declining revenue stream while their real labor costs are on the rise. As a result, labor compensation is depressed and workers move from the high-productivity sector to the low-productivity sector. Meanwhile, the dampened profits in the innovative sector tend to discourage the realization of innovation that under the old prices would have been marginally profitable.
The resulting dynamics is of paramount importance to the prospects of the economy. In the worst possible case, the vicious cycle of falling relative prices and falling innovation would end when the rates of innovation in the investment and manufacturing goods sector go down to the same low level as in the mature sector. Within our model framework, the initial effect of a strong innovation shock would undoubtedly be to immediately depress labor compensation. In the real world, frictions could smooth the effect of the shock, leading to a prolonged period of stable or declining labor compensation. What the resulting new steady state of the economy would be is hard to tell without formally solving the model. For this reason, we postpone further discussion until Chapter 10.
6. Conclusions
The empirical evidence presented in this chapter shows that in terms of aggregate productivity gains, the IT revolution hardly qualifies as a time with an unprecedented peak in innovation.
Our results show that the transmission network through which innovation shocks propagate across countries has not changed. While indigenous innovation in the US, the UK, and the Scandinavian countries has picked up some steam since 1990 relative to the 1970s and the 1980s, it is still either lower or just below what it used to be in the 1950s and the 1960s. Another key finding is that continental European countries failed to experience even such a moderate recovery of indigenous innovation. These results, particularly in the context of the US and the UK, run against the accepted common wisdom.
We also explored possible explanations for the observed data pattern. One simple explanation is that the growth-accounting methodology that is used to come up with the TFP series is outdated. To be sure, we recognize the limitations of national-level TFP data. Still, such an explanation cannot account for the differences in innovation in the US and, say, the continental European economies. Moreover, it also does not square with the fact that much of the productivity gains in the US that led to the observed divergences in relative productivity can be traced back to IT innovations. In combination with our macrolevel findings, the huge divergence in the productivity gains across US industries suggests that one possible explanation for the observed data patterns may be related to the interplay between prices and IT innovation in equilibrium. The following chapters investigate this hypothesis in some detail, along with some alternative explanations for the results reported so far.