 C H A P T E R S I XC H A P T E R S I X
CORPORATIONS CONSIST OF A COLLECTION of divisions and business units that may compete in different industries, have different customers, and employ different strategies. Executives in the corporate office must determine how they add value to their collection of business units so that the whole is greater than the sum of its parts. The Balanced Scorecard provides a framework for clarifying the value created by the corporate headquarters, as the synergies generally can come from any of the four perspectives on the Balanced Scorecard. Figure 6-1 shows a spectrum of corporate synergies that we have observed in practice.
A conglomerate, such as FMC Corporation, creates few synergies across its diverse business units. The corporate role is primarily financial, creating synergy by operating an efficient internal capital market. FMC exploits the private information it has about the units’ market opportunities, technologies, processes, and competencies to allocate capital to its most productive use. A corporate scorecard for FMC would stress cash flow, working capital efficiency, return on capital (or shareholder value metrics), and productivity of capital investments.
Organizations, such as the consumer banking groups of Citigroup, Inc., and Chase Manhattan Corporation, create synergies by providing customers with one-stop shopping for a broad set of financial products and services—credit cards, checking and savings accounts, mortgages, personal loans, brokerage, and investments. Each product or service is delivered by a different strategic business unit. Johnson & Johnson consists of more than 150 companies worldwide, all operating in the health and personal care field. Many of these operating companies share common customers—hospitals, health care delivery organizations, physicians, pharmacies, supermarkets, and general retailers—that deliver or sell health care products and services to consumers. For such broad suppliers of financial or health care products and services, each SBU benefits from the entire customer base of the organization. The corporate role should create synergies through the sharing of customers across SBUs, and its scorecard should emphasize themes such as share of customers’ wallet, cross selling, and integrated products and services.
Figure 6-1 Spectrum of Corporate Synergies
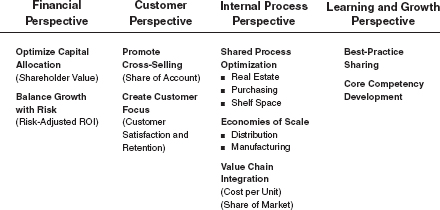
Many organizations share common business processes and require a corporate role to ensure their most effective use. Take the case of The Limited, an apparel retailer whose eight retail divisions include Victoria’s Secret, Express, and Abercrombie & Fitch, each with its own targeted customer group and chain of retail stores. The company’s real estate division, which acquires and manages retail properties, provides a single organization with deep expertise in its field that can be deployed to the benefit of each of the eight retail divisions. Also, The Limited has one division that manages the relationships with factories in low-labor-cost parts of the world that supply products for all eight retail divisions. It is both more effective and more efficient to concentrate the expertise in a single shared services division (a real estate division, a worldwide supply organization) than to have each of the eight operating companies develop its own capabilities in a critical area.
Many companies, particularly consumer goods companies, may have a single distribution division that supports multiple product and brand divisions. Customers—retailers and wholesalers—typically prefer to deal with a single organization for supply rather than have to negotiate directly with as many product divisions as the company has chosen for its internal organization. In this case, having the distribution function handled by a single shared service group enhances customer service and satisfaction.
Procurement is also often a shared business process. By aggregating the demands from diverse product and operating divisions, the company can enjoy the benefits of discounted prices and special supplier attention because of its purchasing volumes. A central procurement function also can invest in deeper and more specialized knowledge about the critical materials, components, and supplier performance than could separate purchasing units in each business unit.
Some company SBUs share common technologies and knowledge. Honda Motor Co., Inc., for example, uses its superb capabilities in engine design and manufacture to produce superior products in different market segments: motorcycles, automobiles, power lawnmowers, and power generators. NEC Corporation used capabilities in microelectronics and miniaturization to become a leader in televisions, computers, and telecommunications.1
The corporate scorecard should articulate the theory of the corporation, the rationale for having several SBUs operating within the corporate structure, rather than having each SBU operating as an independent entity, with its own governance structure and independent source of financing. A corporate scorecard can clarify two elements of a corporate-level strategy:
The following case studies illustrate some applications of these ideas.
While we advocate that the Balanced Scorecard be driven from corporate strategy, often a formal corporate strategy does not exist. In a conglomerate (unrelated diversification) form of organization, the corporate office creates value by its ability to manage capital and people across its diverse business units, not by creating synergies and integration among them.
One of the first implementations of the Balanced Scorecard started at FMC Corporation in 1992. FMC was a collection of more than two dozen operating companies in diverse lines of business, including agricultural chemicals, industrial chemicals, food machinery, airport equipment, defense, gold, and lithium. Because the corporation generated its synergies through financial and people policies (not through customers or operating synergies), FMC did not build a corporate scorecard. Rather, the corporate office established a corporate theme that each operating company had to formulate a growth strategy that would then be expressed in its own Balanced Scorecard. The corporate executives would then monitor the performance of each company against its scorecard.
Some people wonder about the confusion from having different measures across divisions and operating companies. They search for a common set of measures that all divisions could use so that they can have a common reporting format. But we believe that FMC took exactly the right approach. With diverse operating units and diverse strategies, FMC would have been wrong to impose a standard reporting framework on its operating companies. The customized scorecards enabled senior FMC executives to focus their monitoring and reviews on the particular strategies being deployed by their companies, not on checking their companies’ adherence to corporate-mandated indicators that may not have been central to their strategy. An FMC senior manager noted:
We have three businesses, three different processes, all of which could have elaborate systems for measuring quality, cost, and time but would feel the impact of improvements in radically different ways. With all the diversity in our business units, senior management really can t have a detailed understanding of the relative impact of time and quality improvements on each unit. 2
The scorecard gave corporate executives a new and powerful parenting tool for managing the operating companies. Before, as long as the operating company presidents delivered excellent financial performance, no one questioned their strategy very closely. Now financial performance alone was not sufficient; the company presidents had to deliver against their Balanced Scorecard strategic objectives and measures.
FMC executives also felt that they now had ownership of the operating companies’ strategies. Company presidents could not switch strategies without extensive dialogues with the corporate executive team. And when new company presidents were appointed, they were expected to continue the strategy already authorized. The company presidents could adapt the existing strategy, but then they had to propose a modified Balanced Score-card measurement and accountability system for the new strategy and convince the corporate team of the desirability of switching to the new strategy.
FMC has continued to use the Balanced Scorecard with its operating companies. The general managers of about one-third of the companies felt it was not the right tool for them, and they were allowed to drop the score-card for performance reporting to corporate. The remaining two-thirds of the companies have continued to use it aggressively to link their strategy to operations.
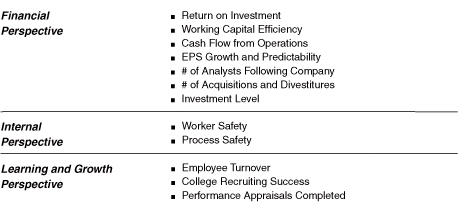
In 1998, FMC conducted a benchmarking study of the characteristics of best-performing NYSE corporations. The results from this study led (in mid-1999) to FMC’s first “corporate-level” scorecard. The corporate scorecard (see Figure 6-2) contained measures in the financial, internal, and learning and growth perspectives. Apparently the relevant customer measures varied sufficiently across FMC’s diverse operating units so that corporate-level reporting on customers could not be standardized. The corporate scorecard did not provide details on corporate strategy. It focused on the corporate responsibility to shareholders (creating shareholder value through the wise use of capital and the management of operating results) and on two simple process themes—safety and human resources development—to be implemented by all operating companies. The corporate scorecard communicated the high-level measures that FMC would use to assess its performance and, therefore, that the operating companies should be cognizant of when managing their own operations.
Figure 6-2 FMC’s Corporate Scorecard for 1999
In summary, at FMC, a diversified holding company, the Balanced Scorecard served as a linkage mechanism between corporate and the operating companies to ensure better communication and accountability, and ultimately better judgments, about the strategies and performance of individual operating companies.
At Mobil, the first Balanced Scorecard was developed in the North America Marketing and Refining (NAM&R) Division. As we presented in Chapter 2, this Balanced Scorecard described a strategy to succeed with three targeted customer segments—Road Warriors, True Blues, and Generation F3—and to create win-win relationships with its dealers. The strategy required Mobil’s dealer-operated stations to deliver a “fast, friendly serve” buying experience to attract consumers in the three targeted segments, even when gasoline was sold at a per-gallon price $0.06 to $0.08 higher than that offered at nearby, discounted gasoline stations. Mobil stations would need to be large, with sufficient space to contain a great convenience store as well as many gasoline pumps so that consumers would not have to wait in line to obtain gasoline. Each pump would have a credit card reader so that consumers in a hurry would not have to wait in line to pay.
Mobil NAM&R did not launch its Balanced Scorecard project by asking its eighteen geographical business units—such as New England, the Midwest, Florida, Texas, and California—that were actually closest to the customer to construct scorecards for their regions. Consider the problems that might have arisen if each regional business unit developed a strategy based on its local characteristics. The New England region, containing its legendary thrifty people, might want to focus on the Price Shopper segment. Texas, with its vast expanse, could opt for the Road Warriors. And California, with its youth-oriented culture in Hollywood and the Silicon Valley, could emphasize Generation F3. Such an outcome, however, would be chaotic. Mobil would mean something different in each local market. Consumers accustomed to seeing low prices in New England might be shocked to encounter premium prices in another market. And loyal customers from the Midwest, expecting Mobil stations with a dozen gasoline pumps and an extensive convenience store, would be disappointed when buying gasoline in New England, with long lines for a single set of pumps and no convenience store. Mobil would also encounter difficulties with a national dealer organization as it attempted to explain the different value propositions desired in different states. Having a common strategy for the entire country enabled a consistent message to be delivered to consumers and dealers throughout the United States. The Balanced Scorecard at the division level articulated the common strategy that each Mobil station, each buying experience, would deliver.
In addition to the common message for the customer perspective, Mobil NAM&R wanted common themes in each region for the internal business process perspective. In its primary operations—refining, storage, and distribution—Mobil wanted each region to emphasize the following:
 Low cost
On specification, on time
Environmentally friendly, healthy, and safe operations
Effective asset utilization
While the strategy was articulated at the national level, NAM&R allowed each regional business unit to formulate its own Balanced Scorecard, as long as it delivered the high-level divisional themes. Each of NAM&R’s geographical business units was asked to develop its own Balanced Score-card.3 These scorecards were to be customized to local circumstances—competitors, market opportunities, and critical processes—based on the high-level divisional scorecard. Ed Lewis, the project leader at NAM&R, described the philosophy: “We used the [NAM&R] scorecard as a guiding light, but that’s all it was, a light. When [a business unit] developed a score-card, it was their scorecard and they would live by it.”4
In general, it is not critical or even desirable for all measures on the lower-level scorecards to add up to measures on the high-level scorecard. We have found it preferable for the lower-level unit to have the discretion to customize the measures to their own circumstance, rather than receive a drill-down component from a higher-level scorecard. The local units should feel empowered to choose appropriate measures that can influence higher-level objectives, not have to use measures that can add up to a division or corporate-level measure. As described in Chapter 2, Mobil’s New England region developed its own strategies and measures to build win-win dealer relationships, and its dealer measures differed from those used in other business units.
Many organizations have business units that operate at different points along their customers’ value chain. The interfaces between the units that make up the value chain are generally filled with inefficiencies. Each business unit builds its own buffers, has its own systems and standards, and may follow different strategies (operational excellence, product leadership, or customer intimacy). A company can create significant strategic advantage by better integrating its business units along the value chain. Such integration, however, typically cannot happen without active corporate intervention.
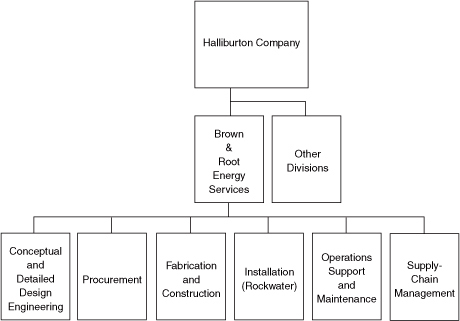
The Brown & Root Energy Services Division of the Halliburton Company used the Balanced Scorecard to implement a value-chain integration strategy across its six previously independent companies. These companies each supplied a different service for marine construction: engineering, purchasing, fabrication, installation, operations, and logistics and service (see Figure 6-3). Rockwater, a company we discussed briefly in Chapter 1, was the subsea-installation company in this division. Customers, typically large oil and gas companies, contracted individually with each operating company to perform a particular function. While most of the operating companies had many customers in common, neither the customer nor the Brown & Root companies had attempted to gain benefits from such relationships.
Figure 6-3 Brown & Root Energy Services
When Norm Chambers, Rockwater’s president, was promoted to become head of the Energy Services Division, he noted the inefficiencies, duplications, and confusion that existed at the interfaces of the Brown & Root companies. Each company was paid for the inputs it provided to customers: a ton of fabricated steel pipe, a man-hour of engineering. Such work was subject to fairly intense price competition.
Chambers and his senior management team believed that by combining efforts, the Brown & Root Energy Services Division could provide a unified and integrated—even turnkey—service. Chambers wanted Brown & Root to supply solutions and be paid for the outputs it produced, not the inputs it supplied. In its most complete form, Brown & Root could design the structure (such as a drilling rig), produce the critical parts for the structure, install the parts, operate the structure, and service the structure; it would offer, in effect, a cradle-to-grave service for the customer. If all of the business were of this turnkey type, then the rationale for having six independent companies would not be compelling. But much business, at least in the short run, would still be individual operating company bidding to perform a specific piece of work.
Chambers wanted the six companies to learn to work together so that they could offer a better integrated service for key customers, who could then be persuaded to outsource major parts of their noncore business. In effect, the new strategy would shift Energy Services from being a low-cost supplier to being the supplier that could best lower its customers’ costs. With front-end investments of $1 billion to $2 billion required to bring a new undersea field into production, savings to the customer from a lower-cost integrated strategy could be substantial.
Brown & Root Energy Services expressed its strategic intent for more integrated strategies at the operating-company level by including, in the division-level scorecard, a strategic theme for integrated service delivery (see Figure 6-4). The financial perspective for this theme identified a new objective: increase revenue from services that involved multiple operating companies. This objective communicated a goal of obtaining new business by providing integrated and turnkey services to customers.
Figure 6-4 Brown & Root Energy Services’ Balanced Scorecard
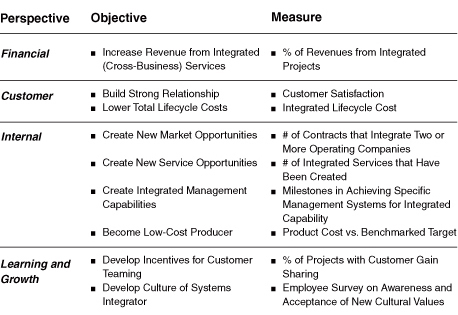
The two objectives in the customer perspective were:
The second objective was measured by the lifecycle per barrel cost as a percentage of what independent companies, operating without collaboration, could achieve. This outcome measure reflected by how much the total cost curve could be lowered through its integrated operations. Brown & Root wanted to shift its mix of business away from being paid by the inputs it provided to customers (engineering and fabrication man hours, tons of steel fabricated) and toward producing outputs—lower costs—for its customer by becoming more focused on providing complete solutions. Internal and learning and growth objectives and measures were then defined that would enable the financial and customer objectives to be achieved. The cultural changes in the learning and growth perspective should not be underestimated. The engineers and the fabricators (construction people) had different backgrounds, spoke in different languages, and generally had very little communication between them. For Brown & Root to offer integrated solutions, cultural, national, and professional barriers would have to be broken down.
Each of Brown & Root’s operating companies, when building their Balanced Scorecards, could now include objectives that reflected how they were contributing to the division-level theme for increases in integrated operations. The individual company scorecards signaled to organizational employees the importance of gaining new capabilities for integrated service delivery and measured the progress in winning the business and delivering cost-effective services in conjunction with the other Brown & Root companies.
In its first year of operating with the new, integrated service strategy, Brown & Root increased its revenues by 33 percent, and the total percentage of these revenues from integrated contracts rose from 11 percent to 30 percent. As one example of an early success from the new strategy, British Petroleum (BP) chose Brown & Root to manage an integrated team of seven different companies (four Brown & Root companies, three independent companies) to bring the new Andrew development field in the North Sea on-stream. Using the Balanced Scorecard as an integrating framework to align the objectives of all the alliance companies, Brown & Root succeeded in completing the new field development six months in advance of the twenty-five-month original schedule and $150 million under budget. As one example of the savings, the Brown & Root integrated team developed a creative approach for hookup of a new well in the Andrew field, a process that normally took about 90 days at a cost of $250,000 per day. With the new approach, the process was completed in 1.5 days. The total savings on the project were shared between BP and the alliance companies, with several of the companies receiving performance awards totaling 20 percent of the previous year’s annual income.
Public sector organizations at the city, state, and federal level can also achieve integration and synergy across their diverse operating units. Once Charlotte, North Carolina, had developed its city-level scorecard (see discussion in Chapter 5), the city manager asked all operating units—such as police, fire, solid waste services, planning, community development, and transportation—to develop their own Balanced Scorecards. As at Mobil NAM&R, the operating unit scorecards reflected both the unit’s operating performance and objectives and measures that linked to one or more of the city’s five strategic themes. The process of building operating unit score-cards enabled the individual departments’ objectives and strategy to contribute to the city’s five strategic themes. As Deputy City Manager Del Borgsdorf observed:
Most cities are really just federations of operating units. The Balanced Scorecard became the vehicle to integrate across departments. It enabled us to ask, “What are you doing that either contributes to or subtracts from the ‘strengthen neighborhoods’ objective?” The score-card enabled us to shift the city council agenda from departments and tactics to the five strategic themes. 5
The Charlotte Department of Transportation (CDOT) identified objectives in the four perspectives of the city’s balanced scorecard that were most relevant for its operations (see Figure 6-5). In the customer perspective, this naturally included “availability of safe, convenient transportation.” The team also felt that “improve service quality” represented an important objective for their department. The team then expanded the city’s transportation and service quality objectives to a departmental Balanced Scorecard. From this template, the team constructed lead and lag measures for the objectives in each perspective of the proposed CDOT Balanced Scorecard (see Figure 6-6). With this process, the CDOT developed a balanced set of lead and lag performance measures that were linked to higher-level city objectives and were consistent with the department’s mission and strategy.6
Figure 6-5 City of Charlotte’s Scorecard
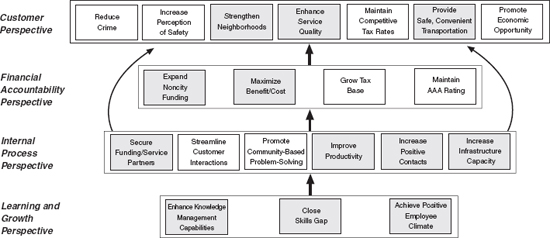
 Corporate objectives affected by the Department of Transportation. This was based on the original Charlotte Scorecard.
The Police Department also developed its departmental-level Balanced Scorecard (see Figure 6-7).7 The deputy chief for administrative services commented on the benefits from having a departmental Balanced Score-card: “Before, each district had a long list of objectives and measures. People were just going through the motions to produce reports. The balanced scorecard is simpler and more meaningful. Our business plan connects to the scorecard measures. And the police officer in the street … will know more about the departmental objectives.”8
The emphasis on some measures changed dramatically. The Police Department had historically been measured by the length of time taken to respond to emergency (911) calls. Surprisingly, their analysis revealed that rapid response time was relevant for less than 1 percent of the calls they received. Even when a crime had been committed, the criminal had usually left the premises, and victims were typically satisfied if the police arrived, as promised, within an hour, rather than within two minutes. The police also observed that there was no correlation between response time to a call and the crime rate. The Police Department, consistent with the total quality movement in the private sector, shifted its resource to preventing crimes rather than responding to defects (committed crimes) after they had occurred. The police chief commented that the department had been trying for several years to deemphasize response times as a performance measure but had been concerned about getting second-guessed by City Council. The Balanced Scorecard gave police the freedom to move away from the traditional response time measure and challenged them to find more meaningful measures, focused on community policing and long-term problem-solving.
The Police Department, however, felt that the crime rate would not be a reliable indicator by itself. With community policing, neighborhood police would observe and report more crimes. Also, citizens would develop increased confidence that local police were responsive and skillful, leading to an increase in the number of crimes they reported to the police. Thus the number of crimes reported could increase even while the actual incidence of crimes was decreasing. Alternatively, the crime rate could be reduced by overzealous enforcement, leading some citizens to feel less safe because of aggressive police action.
Figure 6-6 City of Charlotte Department of Transportation’s Balanced Scorecard
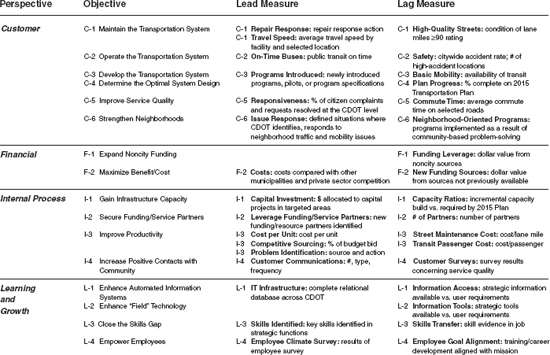
Figure 6-7 Charlotte Police Department’s Balanced Scorecard Objectives

The Police Department worked to develop a survey that would produce an index of the community’s perception of safety. The police chief thought that this measurement was so critical to his organization’s performance that he subsequently asked the Gallup Organization to refine and administer the survey to individuals in the city’s neighborhoods. Using an experienced, trusted, and independent organization like Gallup would give the safety perception measurement added credibility. The 1999 Gallup survey indicated that 85 percent of Charlotte’s citizens felt that the police officers in their community were service oriented; 84 percent indicated that they trusted the police officers in their community.
Another objective on the city’s Balanced Scorecard was to strengthen neighborhoods. The police chief noted that an unusually large number of alcoholic beverage outlets in a neighborhood could not only contribute to a high local crime rate but also inhibit other types of businesses from operating in the community. He helped to form an interdepartmental team—consisting of a police officer and people from the zoning office and the Neighborhood Development Department—that could provide the documentation needed to revoke the liquor license of an alcoholic beverage outlet that had been the subject of numerous nuisance complaints. This integration across various city departments would have been difficult to accomplish without the shared understanding of the city objectives across departments.
For the learning and growth perspective, the department set an objective for all police officers to have access to a laptop computer. This would enable them to query the information base from their car as they were traveling to their destination or before questioning the driver of a car stopped for a traffic violation. In summarizing his experience to date with the score-card, the chief noted, “When we first started with the training for the Balanced Scorecard, I thought ‘Oh no, not another textbook program!’ Now it’s a relief to have the scorecard. Knowing exactly what outcomes the city is trying to achieve, we can be much more confident about how to set priorities, reallocate resources, and change the way we operate.”
The discussion so far in this chapter describes aligning high-level score-cards down to decentralized organizational units. Some organizations have used the scorecard not just for actual organizational units but for strategic themes that cut across multiple units.
Continuing the City of Charlotte story, City Manager Pam Syfert was not comfortable just having all of her departments (such as transportation and police) aligned to the city’s scorecard, as described earlier. She wanted to highlight performance along the city’s five strategic themes. Syfert established cabinets for each of the city’s five strategic themes. Each cabinet met monthly to discuss progress in improving performance for the theme’s strategic objectives. A cabinet consisted of the department heads whose departments could affect or influence the strategic theme. The cabinet provided a mechanism to assemble key operating people with a common interest in a strategic theme.
For example, the chief of police was an obvious member for, and in fact chaired, the Community Safety Cabinet. Initially, however, he had avoided membership in the four other cabinets, not wishing to have yet another set of meetings to attend. The chief soon noticed, however, that more people were being injured and killed in traffic accidents than in homicides and aggravated assaults. Also, many of the calls to the department were complaints about unsafe drivers. In response, the police chief decided to join the Transportation Cabinet. Chief Nowicki, with other Transportation Cabinet members, formed a Traffic Safety Advisory Committee, a collaborative effort among various city departments, such as police and transportation, as well as corporate communication and community organizations. The committee would conduct an extensive public information campaign to improve traffic safety, and to measure its impact.
Chief Nowicki described why he subsequently decided to join the Economic Development Cabinet as well.
Shortly after I arrived in Charlotte, an important retail store, in a brand new building, left a shopping mall. Did it leave because of a high local crime rate? I didn’t know, but I should have known. Becoming more involved in the Economic Development Cabinet presented an opportunity to be more involved in that arena. Public safety is important for attracting businesses to locate and remain in our city, and for them to recruit our citizens to work in their urban locations.
Likewise, it is helpful to have executives from other departments participate in the Community Safety Cabinet meetings. The Police Department doesn’t have all the tools to solve all the city’s safety problems. The Fire Chief and the heads of the Neighborhood Development and Solid Waste Services Departments now share responsibility for community safety. These other departments and agencies can mobilize additional resources to contribute to crime reduction activities 9
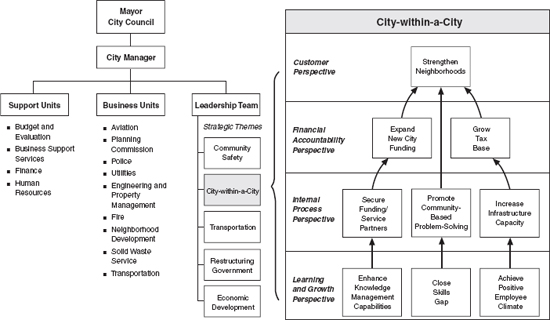
Each cabinet developed its own Balanced Scorecard for its strategic theme (see scorecard for the city-within-a-city theme in Figure 6-8). No manager “owned” this scorecard or was evaluated against it. Rather, the cabinet Balanced Scorecard provided the framework that brought department heads together once a month to assess progress made to date, along with plans for new initiatives in the future to strengthen neighborhoods. The cabinets used their scorecards for framing the discussion of the impact of major city projects—such as a new convention center, new highway construction, or airport improvements—on their cabinet’s strategic theme.
Figure 6-8 City of Charlotte: Defining the Balanced Scorecard for Strategic Themes
Early successes from the partnerships created through the common goals, involvement, and integrated processes of the cabinets’ virtual organizations included the following:
A new transit-land use plan that combined strategic planning with appropriate changes in zoning regulations
New “brownfields,” inner-city developments accomplished with much lower regulatory and compliance costs. The brownfields
were facilitated by active cooperation of the Planning, Engineering, and Transportation departments, working closely with
private sector investors. A specific example was the transformation of an abandoned warehouse into a new design center.
Community problem-oriented policing, involving, of course, the Police Department, but also the Neighborhood Development
and Housing departments
As this book goes to press, the State of Washington is developing Balanced Scorecards for all cabinet agencies, and for the state’s most pressing initiative: salmon recovery. The federal government has mandated, through enforcement of the Endangered Species Act, that the state make dramatic improvements in the quantity of salmon in the ocean and rivers around the state. But no single agency has complete control over all aspects of the environment that affect conditions that would lead to protection of salmon. Several relevant agencies are not even under the direct control of the governor, and some of the intervention has to be done in other governmental units such as neighboring states (Oregon), countries (Canada), and local counties and municipalities (King County, where Seattle is located). Left on their own, state agencies could set measurable objectives for outputs under their control that influence salmon production. Yet the decentralized efforts would likely fail because of lack of coherence across different organizational units.
The solution being implemented is to build a Balanced Scorecard for the strategic theme “preserve and enhance salmon,” even though no czar of salmon exists. By getting each agency to agree, via a Balanced Scorecard about the general model for increasing the supply of salmon, the individual agencies could see how they could contribute to the high-level strategic theme. Their scorecards would include not only actions under their direct control, but also, and perhaps even more important, what linkages they would have to make with other government organizations, private citizens, and other entities for the entire effort to be a success.
The City of Charlotte and State of Washington illustrate how scorecards can be created for strategies even though a single organizational unit does not exist to implement the strategy. We encountered this situation in the private sector as well with an insurance company that was organized functionally, with central departments for underwriting, marketing, sales, and operations. Each department handled the full line of insurance products. The strategy for the company, however, involved multiple customer segments, each with its own marketing, distribution, and servicing requirements. The company struggled with developing a scorecard because of the diverse customer base and the different strategies required for each segment. The process became much simpler when they first developed separate scorecards for each customer segment. The scorecards described the strategy for a virtual organization—in this case a customer-focused business segment—that did not really exist in the company. But once the strategies could be expressed in a separate scorecard for each customer segment, each functional department developed scorecards that described how their internal processes would deliver the value proposition to the targeted customers in each segment. So the scorecard for the virtual customer-based strategic units provided the insight and direction to guide the operating strategies for the functional units.
The case studies in this chapter have illustrated a broad spectrum of approaches used by organizations to achieve synergy across their units. For FMC and Mobil, the initial scorecards were developed below the corporate level. Mobil’s NAM&R Division developed an explicit strategy—a sales growth in premium products that is faster than industry average, targeted consumer segments, win-win dealer relationships, and so forth—that it wanted each of its geographical and product business units to implement when developing their strategy and scorecards. Therefore the initial score-card was developed at the NAM&R level and subsequently rolled out to its business units. Each business unit implemented the strategy in ways that were appropriate for its particular market and competitive situation.
In the case of Brown & Root Energy Services Division, the leadership team had an explicit strategy. They wanted the individual operating companies to work closely together to create value-added solutions that would reduce total lifecycle cost for shared customers that could not be achieved by allowing the business units to operate independently. The Energy Services scorecard explicitly identified the role for integration and used the objectives and measures in the Brown & Root scorecard to communicate the integration strategy across the business units. In the City of Charlotte, each functional department developed a scorecard that enabled it to integrate the city’s five strategic themes into its daily responsibilities.
In general, there are many opportunities for coordination or integration. Many companies—for instance, Brown & Root Energy Services and the City of Charlotte—share common customers (or citizens) across diverse business units. For example, shared customers occur in financial institutions, consumer products companies, and pharmaceutical and medical device companies. In these cases, the customer perspective of the corporate/divisional scorecard must clearly identify the targeted customer and market segments. And it must articulate the value proposition that it wishes the business units, individually and collectively, to deliver to the customer. This will enable the business units to deliver more complete solutions to the customer with common corporate themes. The customer will understand that it is dealing with one integrated company, not an uncoordinated collection of diverse businesses.
Other companies achieve integration through shared internal processes. This occurs when economies of scale and the advantages of specialization and differentiation lead to the centralized provision of important business functions. For example, a company may have a single R&D division that supplies new product and process technologies to its individual operating groups. Another might have a manufacturing division that supports several business groups (usually organized by customer groups and marketing channels). Other examples of centrally provided goods and services include purchasing, real estate, distribution, and maintenance. We will discuss these situations in the next chapter.
The City of Charlotte and State of Washington cases illustrated how scorecards can define strategies even for virtual organizations. The score-card provides the discipline to describe important strategic themes (in effect, a virtual organization). The scorecard contains both the outcomes desired (How would we measure success for the strategic theme?) and the performance drivers (especially in the internal processes and learning and growth) required for the outcomes of the strategic theme to be achieved. Individual organizational units then define their own strategies and score-cards that include their respective contributions to the objectives articulated in the strategic theme’s scorecard.
1. Examples taken from C. K. Prahalad and G. Hamel, “The Core Competence of the Corporation,” Harvard Business Review (May-June 1990): 79-91.
2. R. Kaplan and D. Norton, “Implementing the Balanced Scorecard at FMC Corporation: An Interview with Larry D. Brady,” Harvard Business Review (September-October 1993): 145.
3. The experience of building two business unit Balanced Scorecards is described in R. S. Kaplan, “Mobil USM&R (B): New England Sales and Distribution,” 9-197-026 (Boston: Harvard Business School, 1996), and “Mobil USM&R (C): Lubricants Business Unit,” 9-197-027 (Boston: Harvard Business School, 1996).
4. R. S. Kaplan, “Mobil USM&R (A): Linking the Balanced Scorecard,” 9-197025 (Boston: Harvard Business School, 1996), 6.
5. R. S. Kaplan, “City of Charlotte (A),” 9-199-036 (Boston: Harvard Business School, 1998), 6.
6. R. S. Kaplan, “City of Charlotte (B),” 9-199-043 (Boston: Harvard Business School, 1999).
7. The Police Department scorecard is also described in Kaplan, “City of Charlotte (B).”
8. Ibid., 4.
9. Ibid., 6.