C H A P T E R F I V EC H A P T E R F I V E
IN 1996, THE MIGRATION OF THE BALANCED SCORECARD to the nonprofit and government sectors was in its embryonic stages. During the next four years, the concept became widely accepted and adopted in such organizations around the world. As we have reviewed the scorecards produced by these organizations, we have gained additional insights into effective use of the Balanced Scorecard in nonprofits and government agencies. In this chapter, we provide examples of how the Balanced Scorecard has been applied in government, nonprofit, and health care organizations.
In our experience, nonprofits and government agencies typically have considerable difficulty in defining clearly their strategy. We have seen “strategy” documents running upwards of fifty pages. And most of the document, once the mission and vision are articulated, consists of lists of programs and initiatives, not the outcomes the organization is trying to achieve. These organizations must understand Michael Porter’s admonition (quoted in Chapter 3) that strategy is not only what the organization intends to do, but also what it decides not to do—a message that is particularly relevant for nonprofits and government departments.
Most of the initial scorecards in the nonprofit and government sector feature an operations excellence theme. These organizations take their current mission as a given and try to do their work more efficiently—reduce costs, incur fewer defects, and do it faster. Often the project builds off a recently introduced quality initiative that emphasizes local process improvement. It is unusual to find nonprofit organizations focusing on a strategy that can be thought of as product leadership or customer intimacy. As a consequence, their scorecards tend to be closer to the KPI scorecards described at the end of Chapter 3 than true strategy scorecards.
The City of Charlotte, North Carolina, however, followed a customer-based strategy by selecting an interrelated set of strategic themes to create distinct value for its citizens. The United Way of Southeastern New England, a nonprofit, also articulated a customer (donor) intimacy strategy. Other nonprofits—the May Institute, Inc. and New Profit, Inc.—selected a clear product leadership position. The May Institute uses partnerships with universities and researchers to deliver the best behavioral and rehabilitation care. New Profit introduces new selection, monitoring, and governing processes that are unique among nonprofit organizations. Montefiore University Hospital uses a combination of product leadership (in its centers of excellence) and excellent customer relationships—through its new patient-oriented care centers—to build market share in its local area. So government and nonprofit organizations can be strategic and build competitive advantage in ways other than pure operational excellence. But it takes vision and leadership to move beyond improving existing processes to a strategy that highlights which processes and activities are the most important to implement.
Most nonprofits and government organizations had difficulty with the original architecture of the Balanced Scorecard, where the financial perspective was placed at the top of the hierarchy. Given that achieving financial success is not the primary objective for most of these organizations, the architecture can be rearranged to place customers or constituents at the top of the hierarchy.
In a private sector transaction, the customer both pays for the service and receives the service. The two roles are so complementary that most people don’t even think about them separately. But in a nonprofit organization, donors provide the financial resources—they pay for the service—while another group, the constituents, receives the service. Who is the customer—the one paying or the one receiving? Rather than have to make such a Solomon-like decision, organizations can place both the donor perspective and the recipient perspective at the top of their Balanced Score-cards. They develop objectives for both donors and recipients and then identify the internal processes that will deliver desired value propositions for both groups of “customers.”
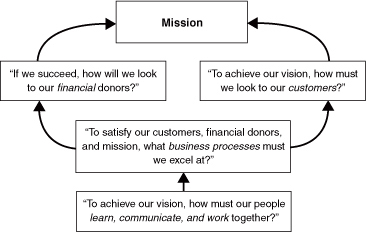
In fact, nonprofit and government agencies should consider placing an overarching objective at the top of their scorecard that represents their long-term objective: for instance, a reduction in poverty or illiteracy or improvements in the environment. Then the objectives within the scorecard can be oriented toward improving such a high-level objective. For a private sector company, financial measures provide accountability to the owners, the shareholders. For a nonprofit or government agency, however, the financial measures are not the relevant indicators of whether the agency is delivering on its mission. The agency’s mission should be featured and measured at the highest level of its scorecard. Placing an overarching objective on the Balanced Scorecard for a nonprofit or government agency clearly communicates the organization’s long-term mission (see Figure 5-1).
Figure 5-1 Adapting the Balanced Scorecard Framework to Nonprofit Organizations
Even the financial and customer objectives, however, may need to be rethought for governmental organizations. Take the case of regulatory and enforcement agencies that monitor and punish violations of environmental, safety, and health regulations. As such an agency does its job—detecting transgressions and fining or arresting those who violate the laws and regulations—can it look to its “immediate customers” for satisfaction and loyalty measures? Clearly not; the true “customers” for such organizations are the citizens at large, who benefit from effective but not brutal or idiosyncratic enforcement of laws and regulations. Figure 5-2 shows a modified framework in which a government agency has three high-level perspectives:1
Figure 5-2 The Financial/Customer Perspectives for Public-Sector Agencies
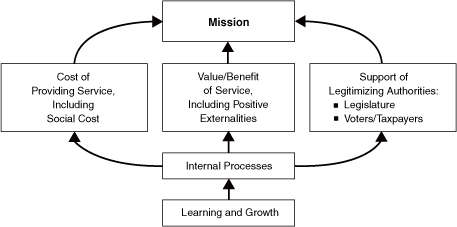
Thus a public sector organization may have three high-level objectives it needs to satisfy if it is to accomplish its mission: create value, at minimal cost, and develop ongoing support and commitment from its funding authority. From these three, the agency proceeds to identify its objectives for internal processes and learning and growth that will enable it to achieve the objectives in its three high-level perspectives.
With this background, we can now illustrate some of the principles with examples drawn from the public and nonprofit sectors.
In 1990, the City of Charlotte already had a mission and a vision statement that communicated the city’s desire to provide high-quality services to its citizens that would make it a “community of choice for living, working, and leisure activities.”2 But the City Council was unsure about how to implement the mission and vision; funding was incremental and spread across all operating departments. Pam Syfert, then deputy city manager, felt the need to establish a strategy and set priorities for city initiatives. Rather than continue with business as usual, Syfert wanted the city to focus its limited resources on those initiatives that would have the greatest impact on achieving its vision.
In the early 1990s, senior city staff, the mayor, and the City Council used their annual retreat to choose a few themes that would guide resource allocation and departmental programs for the next decade. The staff presented the mayor and City Council with fifteen possible focus areas.3 The group debated the themes and eventually selected the following:
 Community safety
Transportation
City within a city (preserving and improving older urban neighborhoods)
Restructuring government
Economic development
To implement these five themes effectively, Syfert formed a core project team to translate the five themes into strategic objectives for a city Balanced Scorecard. The team decided to place the customer (citizen) perspective at the top of its scorecard. It established seven customer objectives (see Figure 5-3), two objectives each for community safety and restructuring government, and one each for the other three strategic themes.
As the team worked on the five strategic themes, it realized that many financial, internal, and learning and growth objectives were common across several themes. The team therefore built its initial scorecard for all five themes (as shown in Figure 5-3). The top-line—customer perspective—captured aspects of the five strategic focus areas, slightly renamed. Its objectives represented the key services the city was delivering for its citizens. The financial objectives became the enablers for helping the city achieve its customer objectives. It measured delivering the city’s services at a good price, securing external partners for funding and services, and maintaining its solid tax base and credit ranking to fund high-priority projects. The internal and learning and growth objectives then supported both the financial and the customer objectives. The internal objectives encouraged the city to change and improve the way it delivered services, especially by forming partnerships within communities, and improving productivity. And the learning and growth objectives identified whether the city was maintaining technology and its employee training and skills so that it could continually improve. The team developed descriptive statements for each of the nineteen objectives on the corporate scorecard.4
Figure 5-3 City of Charlotte City Council’s Strategy Map
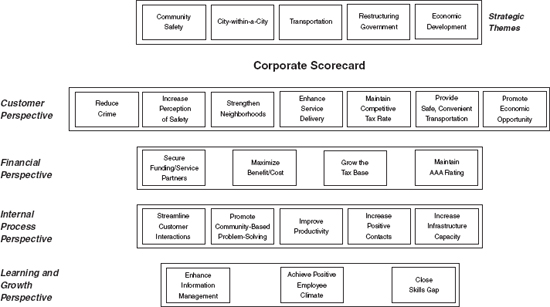
Source: Adapted from R. S. Kaplan, “City of Charlotte (A),” 9-199-036 (Boston: Harvard Business School, 1998), 12. Reprinted by permission of Harvard Business School.
Figure 5-4 Strategic Theme: City-within-a-City
Mission: This focuses on comprehensively dealing with the economic development and quality of life issues in Charlotte’s older, urban neighborhods, including residential and business areas.
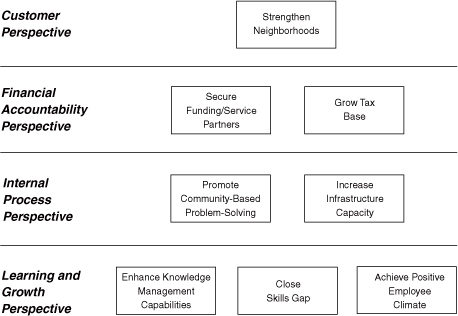
Source: Adapted from R. S. Kaplan, “City of Charlotte (A),” 9-199-036 (Boston: Harvard Business School, 1998), 115. Reprinted by permission of Harvard Business School.
The strategic nature of the scorecard was highlighted when some departments—such as Fire, Wastewater Treatment, and Solid Waste Services—expressed disappointment that their activities did not appear on the corporate scorecard. Syfert told people in these departments that their work remained vitally important for the city and that their performance would be measured against departmental objectives. But she emphasized that each of these departments should also think how their operations could contribute to one or more of the city’s top-level objectives:
“The ultimate goal is to make Charlotte a city where residents of all neighborhoods enjoy personal safety, decent and affordable housing, good jobs, adequate infrastructure, ready access to shopping, educational and recreational amenities, and effective representation through community-based organizations.”
“Neighborhoods are this city’s greatest asset.”
Partnering with private and other funding sources extends and makes more effective the city’s use of its resources.
Growing a neighborhood’s tax base by attracting new businesses and encouraging the expansion and retention of existing ones is important to its economic vitality.
Promoting “community-based” problem-solving:
Empowers neighborhood residents
May reduce the level of city involvement to solve a problem
Reduces duplication of effort
Enhances delivery of city services
To succeed, we must support employees with the training and technical resources to facilitate solutions.
While focusing on the city’s older urban neighborhoods, this problem-solving model will be shared as a best practice for managing similar issues in other city areas.
The corporate scorecard does not and cannot represent every important service delivered. For example, basic city services such as fire suppression, garbage collection or animal control are not represented individually on the corporate scorecard. These basic services are more appropriately addressed at a department or division level score-card. The focus areas identify services the organization wants to improve or enhance to make Charlotte a community of choice for living and working. 5
With the citywide scorecard now established as a template, the team then identified the relevant strategic objectives for each of the five themes and built separate scorecards for each theme (Figure 5-4 shows the scorecard for the “city-within-a-city” theme). The scorecards for the five strategic themes then became the basis for active discussions among city managers, from many different departments, about how these cross-departmental objectives could be achieved. We continue the Charlotte story later in the text, discussing in Chapter 6 how the city linked the corporate scorecard to individual departments and strategic themes and in Chapter 12 how the Charlotte scorecard was used interactively for reporting and learning.
Scorecards are being developed by many U.S. government agencies, including units in the Department of Defense. The Balanced Scorecard concept has been endorsed by the National Partnership for Reinventing Government:
Why should you as a government leader try to achieve a balanced set of performance measures? …Because you need to know what your customer’s expectations are and what your employee needs to have to meet those expectations. Because you cannot achieve your stated objectives without taking those expectations and needs into account. Most importantly, because it works, as can be seen from the success of our partners. 6
An early success occurred at the Veterans Benefit Administration (VBA) in the U.S. Department of Veterans Affairs. Initially the VBA formed a committee to determine how to comply with the Government Performance and Results Act (GPRA). The discussions soon evolved to the Balanced Scorecard and how this could help the agency both comply with the GPRA and become more effective. The VBA spent considerable time developing a consensus about its objectives, which was a challenge, as historically its five subbusinesses considered themselves to be quite different from one another. The committee learned that its existing measurement system ignored three important constituents: veterans (the beneficiaries), employees, and taxpayers. The committee developed a simple Balanced Scorecard. Even with only five measures, the scorecard provided a more balanced view of the VBA’s mission and strategy:
Previously, VBA offices had been compared only on speed of processing. Now the scorecard enabled the comparison across the five scorecard measures, including customer satisfaction, which had not been measured before. A director concluded:
The scorecard is the basis for determining whether we meet our short-term and long-term strategic goals. It will ultimately be linked to our performance appraisal and rewards and recognition systems. All of our organizational design choices must be linked if we are to have a clear line of sight. The scorecard is the linchpin behind all of those choices.
In 1996, the Procurement Division in the U.S. Department of Transportation (DOT) was one of the first government agencies to adopt the Balanced Scorecard.7 Lori Byrd, the project leader, reported that since then processing times have dropped dramatically and satisfaction measures have increased across the board:
The BSC has been recognized throughout the DOT as an important tool for facilitating culture change and promoting innovation within the Department. The procurement BSC served as an important pilot program that other major program areas have adopted and adapted. The procurement BSC has been a catalyst for the department at all levels and all programs.
Many other federal agencies, including the Federal Aviation Agency Logistics Center and the National Reconnaissance Office, have adopted the scorecard to align their organization to a strategy and become more accountable for performance.
The city of Brisbane, Australia, followed a process essentially identical to that of Charlotte to produce a comprehensive citywide Balanced Scorecard program. In early 2000, the Australian cities of Cockburn and Melville won awards for their Balanced Scorecard performance measurement systems. Also in Australia, the government established in 1997 Centrelink, a new organization to provide a single source for information, assistance, and payments (such as social security) that previously were handled by a myriad of government departments and agencies. Centrelink immediately adopted the Balanced Scorecard as the mechanism for measuring progress in achieving its six high-level goals:
Richard Magnus, the chief judge from the Singapore District and Magistrates’ Courts, returned from attending a Harvard Business School executive program to lead the establishment of the Balanced Scorecard in the District and Magistrates’ Courts system, one with 84 judges, 500 administrators, and 400,000 cases per year. The scorecard was piloted in the Small Claims Tribunal, probably the first application to the judicial sector in the world.8
After the scorecard was successfully piloted in the Small Claims Tribunal, the concept was rolled up to the Subordinate Courts, where it became the cornerstone of the management system there, and will be deployed to all the other subsidiary courts and administrative departments. The Subordinate Courts have started to link recognition and reward, but not actual monetary compensation, for excellent performers by presenting plaques and certificates, overseas study trips, and conference opportunities.
These experiences testify to the applicability and success of the score-card across a wide range of governmental organizations.
The Balanced Scorecard has become widely adopted in nonprofit organizations as well as government. We can provide a few examples.
The United Way of Southeastern New England (UWSENE) was among the first to develop a Balanced Scorecard for a nonprofit organization.9 United Way organizations enable individual donors to contribute, in an annual consolidated campaign at their workplace, to a wide range of human service programs in their communities.
Doug Ashby, chief professional officer (the CEO) of the UWSENE, felt that his current planning process was not sufficiently integrated with the organization’s operations and looked to the Balanced Scorecard to provide the missing linkages. Much debate occurred about who were the customers of the UWSENE, what were the drivers of customer satisfaction, and which were the internal business processes that would deliver the products and services valued by customers.
Several different constituencies could have been represented in the customer perspective: donors, volunteers, employees, agencies, and the individuals who were the ultimate recipient or consumer of agency services. Ashby framed the strategic choice faced by the organization:
United Ways have three primary choices. They can be donor-focused, agency-focused, or community-focused.
Each of the three strategies is good, with the potential to yield positive end results… . Many United Ways switch strategies, say to meet specific community needs, for very good reasons but then are surprised when their agencies and donors get upset. UWSENE has definitely become a donor-focused organization, believing that if the donors are satisfied, then agencies will be provided for. That is why we chose the donor as the primary customer on the scorecard. 10
Ashby’s choice made the objectives for donors on the customer perspective relatively straightforward to articulate. The team then formulated initial internal business process objectives that would deliver the financial and customer objectives. Because the United Way functioned as a financial intermediary, collecting funds from a broad population of donors and disbursing the funds to community-based agencies, the team left the financial perspective at the top of the scorecard.
The UWSENE team discussed whether the four perspectives of a forprofit Balanced Scorecard were adequate and appropriate for its scorecard. Some suggested adding additional perspectives—say, for volunteers and for the agencies it funded to supply needed services to communities. Ashby, however, felt that the four basic perspectives had sufficient flexibility to include objectives that would address the organization’s relationship with agencies and volunteers. This choice did bother some in the organization, who felt that the agencies were so critical to the mission of the UWSENE that they would have liked them to be featured with a separate perspective.
After several months, the team produced the scorecard shown in Figure 5-5. Reactions to the scorecard were favorable. One middle manager said, “You can relate to the BSC. It shows where you fit in the organization. You can see how you contribute to the customer or financial needs of the organization, and to staff advancement.”11 A member of the project team noted the enthusiasm among the staff for the Balanced Scorecard:
We used to have strategic plans handed down from on high, and there wasn’t the buy-in we now have from the BSC. It should start to change behavior.
In the past, … those departments not involved with fund-raising didn’t get any recognition for the success of the organization. Now we will look to all the BSC measures to assess our success in reaching our goals.12
The May Institute, a Massachusetts nonprofit institution, is one of the country’s largest providers of high-quality behavioral health care, education, and rehabilitation programs for children and adults. It has 2,000 employees and serves more than 8,000 individuals and family members each year through its nonprofit network of 160 programs in New England and the Southeast. The May Institute is also an active center of research and training, maintaining associations with more than forty universities and medical centers throughout the United States and several other countries.
The May Institute launched a Balanced Scorecard project to guide its expansion and to manage its increasing scope of operations. Chief Operating Officer Kathleen Bradley Kapsalis wanted to be able to evaluate where new projects fit within May’s network of services and to evaluate new opportunities. Initially, the scorecard project struggled as it became imbedded with operational improvement projects and information technology initiatives. Existing project managers and technology consultants wanted to adapt the scorecard to support their local, continuous improvement initiatives, rather than to specify a strategic path for the future. Fortunately, the external Balanced Scorecard consultant kept the project team directed at the organization’s higher-level strategic objectives. This project reinforced the difficulty that many nonprofit organizations have in distinguishing strategy from the myriad of initiatives they always have under way.
Figure 5-5 United Way of Southestern New England’s Balanced Scorecard
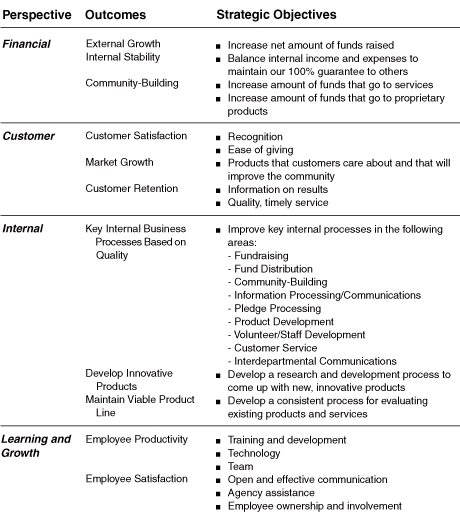
Source: Adapted from R. S. Kaplan and Ellen L. Kaplan, “United Way of Southeastern New England (UWSENE),” 9-197-036 (Boston: Harvard Business School, 1996), 14. Repinted by permission of Harvard Business School.
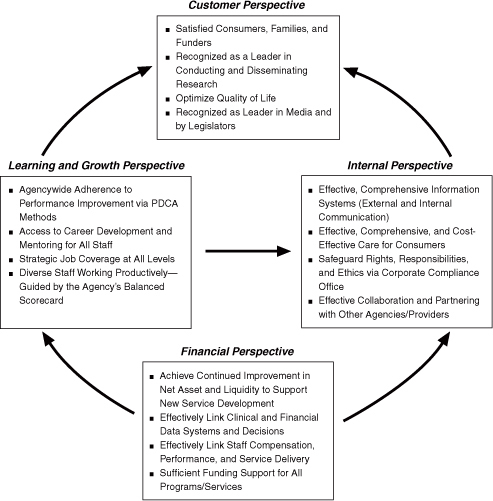
The May Institute did place its customer perspective at the top of its scorecard hierarchy. Reflecting the multiple constituencies of most nonprofit organizations, the May Institute recognized several different types of customers in this perspective:
Consumers (patients) and families
Funders
Academic community
Media
Legislators
Directly beneath the customer perspective, the May Institute placed the learning and growth perspective, feeling that the quality of its staff had the greatest impact on helping it to achieve its customer objectives.
The internal perspective featured several critical processes:
To offer effective, comprehensive, and cost-effective care for consumers
To safeguard rights, responsibilities, and ethics via the corporate compliance office
To effectively collaborate and partner with other agencies and providers
A fourth process featured the important role of information systems for internal and external communication.
The financial perspective promoted the viability of the organization and developing performance-based compensation practices. The scorecard is portrayed in Figure 5-6.
Kapsalis emphasized how the Balanced Scorecard has been a wonderful teaching tool for her organization. Most of the May Institute’s personnel give direct patient care and human services. The scorecard helped them to understand the importance of the business aspects of the organization, especially budgets and marketing activities. In contrast, May’s board consisted mostly of businesspeople who understood finances well. For them, the scorecard communicated the role for human services and personnel development and allowed for more balanced discussions at board meetings. Beyond its communication role, the scorecard was used to highlight the importance of human resources processes, particularly retention and recruitment, in a tight job market.
Figure 5-6 The May Institute’s Balanced Scorecard
Our Mission:Provide excellent Services, Research, and Training and meet the highest possible standards of behavioral health care and rehabilitation to our consumers, who face the challenges of autism, brain injury, mental retardation/developmental disabilities, and other physical and mental health issues.
Working together we seek to contribute to every individual’s independence and promote maximum community integration.
A novel Balanced Scorecard application was at the heart of a new nonprofit organization, New Profit, Inc. (NPI), a Boston-based venture capital philanthropic fund.13 Vanessa Kirsch, founder of NPI, wanted to create a performance framework for the nonprofit sector. The new venture philanthropy fund was structured similar to that of a for-profit venture capital firm. Kirsch and her general partners, funded by a small percentage of the fund’s size, actively managed a portfolio of social enterprises.
NPI specified three principles to guide the fund’s investment strategy:
Kirsch felt that the Balanced Scorecard would be critical for implementing her performance-based philanthropy fund: “The Balanced Score-card will become our agreement with the portfolio organizations as to what will be measured to evaluate performance. We will have a firm agreement and will be able to say that if you’re not on this page, you are on the wrong page.”14
Kelly Fitzsimmons, Kirsch’s general partner, reinforced the centrality of the scorecard for NPI: “The scorecard will align all our stakeholders for creating social innovation and social returns. That means the boards, investors, fund managers, foundations, and social entrepreneurs can bring all their resources to bear in the right ways to strategic applications.”15
The NPI project team, like the UWSENE, retained the financial perspective as its high-level objective: raise adequate capital and operating funds and use them in an efficient and sustainable manner. For the customer perspective, the team identified the investors in the fund as the primary customers. Thus the customer perspective would feature investor satisfaction as an important outcome measure.
Like the UWSENE debate about the role of agencies on their scorecard, the NPI team debated whether portfolio organizations were customers or part of the internal business processes that needed to be managed. After several iterations, the team finally decided that portfolio organizations warranted their own perspective because they were so critical to the success of NPI. The success of the portfolio organizations was central for investor satisfaction. Extending this principle, the team proposed that the scorecards from each portfolio organization should include a perspective to represent its contribution to NPI’s strategic objectives. The scorecard approved for initial use at NPI is shown in Figure 5-7.
Kirsch also asked NPI’s initial four portfolio organizations to develop their own Balanced Scorecards. These scorecards would have to demonstrate how the portfolio organizations contributed to NPI’s mission for growth, scalability, and social impact.16
Beyond its role in managing internal operations and relationships with portfolio organizations, the Balanced Scorecard was used as the primary communication tool with NPI’s board of directors and donors. One board member commented:
The BSC allows the board to be up-dated in a brisk way about what is happening across the organization, factoring in a breadth of issues ranging from those of the balance sheet to the softer aspects involving people and their knowledge. It gives us board members a framework so that discussions don’t become monolithically focussed on how much money was raised. 17
For potential investors, Kirsch used the Balanced Scorecard of NPI and its portfolio organizations to illustrate a highly attractive product-leadership value proposition. NPI would offer a unique (for the nonprofit sector) performance management system, along with active fund managers who would search out the best opportunities for investing and would work with the portfolio organizations to improve performance against stated objectives. An early investor enthusiastically endorsed the concept, made a significant financial commitment, and promised to give more based on performance: “Do well and you will get more.”18
Figure 5-7 New Profit’s Balanced Scorecard
Mission: New Profit, Inc., is a nonprofit venture philanthropy firm. Our goal is to affect large-scale social change by applying venture capital practices to philanthropy.
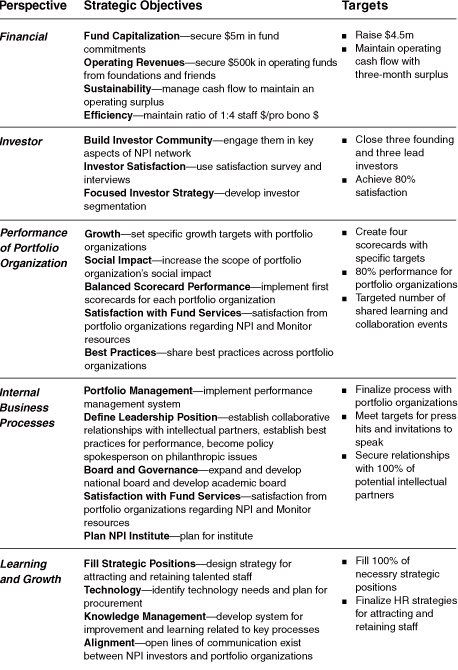
Source: Adapted from R. S. Kaplan, “New Profit Inc.: Governing the Nonprofit Enterprise,” 100-052 (Boston: Harvard Business School, 1999), 15.
The complexities of developing and implementing strategy in health care institutions are quite obvious. To date, two of the scorecard’s best strategic applications to health care have been instituted at Duke Children’s Hospital in Durham, North Carolina, and Montefiore Hospital in the Bronx, New York.
We reported in Chapter 1 on the successful results from the Duke Children’s Hospital (DCH) program. Dr. Jon Meliones, head of Pediatrics Intensive Care Unit, launched that project after identifying several burning platform issues:19
The organization was confused about which services were the most important to provide.
There was no shared purpose among administration, staff, and physicians.
The communication and coordination with referring pediatricians was poor.
There were competitive threats to the organization’s market position.
The organization had great difficulty in balancing quality care, patient satisfaction, staff satisfaction, and education
and research with its financial objectives.
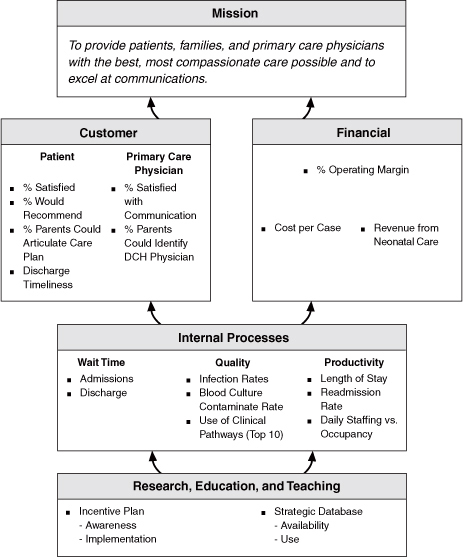
First, DCH’s leadership team developed mission and vision statements. This involved self-examination of institutional goals so as to ensure compatibility with the entire Duke Medical Center, benchmarking against national data, and defining centers of excellence based on existing strengths and projected needs. The vision became, “to provide patients, families, and primary care physicians with the best, most compassionate care possible, and excel at communication.” The strategy hypothesized that with better communication and care, referrals and revenues would increase. In addition, the strategy wanted to reduce costs and length of stay to restore financial viability.
A multidisciplinary team at an executive workshop reviewed the mission, vision, and strategy and started to develop the scorecard for the strategy. After iterations, interactions, and active communication, the team reached consensus on the first scorecard (see Figure 5-8).
The team renamed the learning and growth perspective to research, education, and teaching, as this mission was so central for a health care unit in an academic medical center. The objective in this perspective was to involve the staff in the change process and to advance the field of children’s care.
Once the scorecard had been communicated and accepted, the hard work began: how to make it happen. Employees generated many ideas to improve customer satisfaction. Meliones defined a two-dimensional grid to screen the initiatives: Effort involved (time and money) and potential impact on customer satisfaction. Only initiatives that could be of high impact were considered further; of these, DCH first assessed the low-cost ones and then the higher-cost ones. Soon people only generated ideas likely to be of high impact and, mostly, of low cost.
A whole range of new processes were implemented: care providers held a discussion each day about every patient to be discharged that day, the family was educated about treatments before a patient was released, and the primary care physician was informed about in-patient treatment and recommended treatment after discharge. Physicians received their monthly cost/case statistics and patient and referring physician satisfaction scores, benchmarked against the total physician population. They could now compare themselves against their colleagues and peers and search for ways to improve.
As described in Chapter 1, within three years and with an increase in case mix complexity, DCH’s cost per case and average length of stay dropped by 25 percent, and satisfaction and loyalty increased among the hospital’s customers—patients and physicians.
Montefiore Hospital, with an annual budget over $1 billion, is the university hospital for the Albert Einstein College of Medicine. It consists of two large Bronx, New York-based hospitals, a network of twenty-six primary care satellites, a large specialty-focused faculty practice, and 400,000 Home Care visits.
Figure 5-8 Duke Children’s Hospital’s Balanced Scorecard
Montefiore’s two hospitals, four miles apart, operated as separate divisions for over thirty years but were merged into a single operating division in 1996. The medical center faced the challenge of delivering health care to largely Hispanic, African American, and elderly people in the Bronx who had high rates of poverty and disease, while also striving to be a leader in education and research.
Appointed senior vice president responsible for the newly consolidated Acute Care Division in 1996, Elaine Brennan inherited an organization built around functional silos—hospital operations, clinical, and academic—and had no real authority. She participated in a planning process at the medical center to formulate a new strategy for Montefiore, GRIP:
Grow: volume and market share
Rebalance: academic and clinical staff
Infrastructure: information systems, state-of-the-art technology
Performance: setting targets and achieving them
The growth theme reflected two simple strategies:
The challenge was how to realign the bureaucratic, fragmented organization so that two formerly distinct and competitive hospital systems could pull together to implement the strategy.
Brennan decentralized the organization. She formed five clinical care centers, each of which would focus on the needs of a particular patient population, and three support centers. For example, the Heart Care Center would provide all cardiac-related services. Each care center was multidisciplinary, bringing together nursing, physician, and managerial personnel into a single organization. The care center would have control over a majority of services delivered to its inpatient and ambulatory customers and be jointly run by an executive-level manager, physician, and nurse. It would be responsible for outcomes along a variety of dimensions: revenue, cost, quality, service, work environment, employees. Brennan, of course, faced the problem of how to measure performance for the new care center organization. With Montefiore’s existing system, 90 percent of the hospital’s measurements were financial.
Brennan and her management team worked from October 1998 to June 1999 to define the architecture and content of a Balanced Scorecard management system using a nation-state-city metaphor. In this model, the nation would be the Montefiore’s Acute Care Division; the states would be each of the eight care centers, and the cities would be individual services (cost centers). The group worked initially to build the Balanced Scorecard for the nation, and then moved into their care centers, based on the experience and the high-level strategic themes, to develop scorecards for their states and cities.
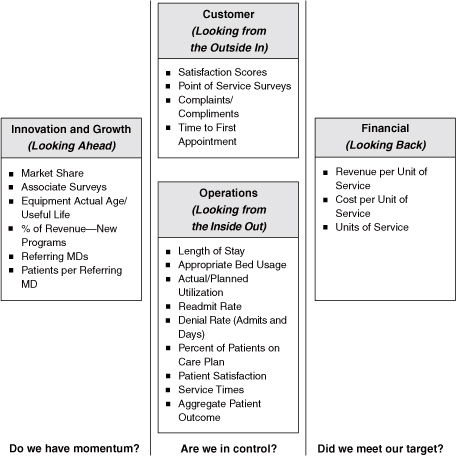
Figure 5-9 shows a simplified version of Montefiore’s initial Balanced Scorecard. Like the one used at Duke Children’s Hospital, it focused on patient satisfaction and clinical and administrative processes designed to produce benefits for patients. Most of the measures seem operational, designed to focus people’s attention on improving processes for dealing with and treating patients and improving cost, quality, and timeliness. The strategic measures that were used to position Montefiore for the future are in the innovation and growth perspective. The volume and market share measures would reflect the “G” in the GRIP strategy to increase penetration in its immediate capture area, the Bronx, and to attract customers from neighboring areas—northern Manhattan and southern Westchester County—through its specialty centers and patient-oriented care centers. The measure on equipment’s average life was a proxy that came from a market survey indicating that state-of-the-art equipment and innovation contributed to a referring physician’s hospital choice. The percentage of revenue from new programs and the number of referring physicians reflected the success of the strategy to expand reach, penetration, and lines of service.
At the time of writing, while early signs are favorable, it is too soon to draw conclusions. Program growth has occurred in the Heart Care Center; the capacity to serve and the number of cases have increased; new alliances and joint ventures are being formed to implement the strategy; and recruitment efforts for physician and staff have been successful. Perhaps the most significant early success indicator has been the enthusiasm of the staff, both clinical and managerial, to the new organization, the clarity of the strategic objectives, and the new measurement and management system that fosters local decision-making and accountability. Brennan reflected on the changes she helped to launch: “If you teach a bear to dance, be prepared to keep dancing until the bear wants to stop.”
Figure 5-9 Montefiore Hospital’s Balanced Scorecard
It is interesting to compare Brennan’s experience at Montefiore with the experiences of McCool and Baker at Mobil. Montefiore and Mobil were both large, highly functional, centralized, and financially troubled entities that had lost touch with their customers. Both launched new strategies to become more efficient, to be more customer-focused, and to grow through increased market share and new products and services. The leaders implemented a massive reorganization, replacing the functional organization with decentralized, customer-focused units. The challenge was to take the leaders of the new decentralized units, whose professional careers had been within a narrow, functional organization, and give them a general management perspective and new management tools.
The Balanced Scorecard provided a mechanism for the new unit heads to participate in the initial high-level discussion to make the division/ nation-level strategy explicit and show their commitment to the strategy. Both entities subsequently used the Balanced Scorecard as a mechanism to communicate and implement the strategy within the decentralized units. Mobil and Montefiore deployed the strategy by having each decentralized unit build its own Balanced Scorecard based on the high-level objectives established on the division/nation-level scorecard.
The fundamental principles to create a Strategy-Focused Organization are applicable across all sectors. In addition to the private sector applications described in Chapters 3 and 4, this chapter has shown how organizations in national and local governments and a variety of nonprofit and health care organizations have deployed the scorecard effectively and gained benefits from it. The principal difference in these sectors has been a more careful consideration of customers. Customers become elevated to the top of the Balanced Scorecard strategy maps as, ultimately, effective delivery of services to customers explains the existence of most government and nonprofit organizations. Also, the financial perspective may be portrayed at the top of strategy maps, concomitant with the customer perspective, to signal the importance of satisfying the donors and citizens who provide funding for the services that the organization delivers. Once these modifications have been made, managers in government and nonprofit organizations have used the scorecard to gain agreement on the strategy and then align the organization to deliver it effectively, much like their private sector counterparts.
1. This framework was developed collaboratively with Professor Dutch Leonard of Harvard’s Kennedy School of Government.
2. The Charlotte story is described in more detail in R. S. Kaplan, “City of Charlotte (A),” 9-199-036 (Boston: Harvard Business School, 1998).
3. Two obvious choices, education and social services, were under the jurisdiction of the county government, not the city. Hence they were not on the list.
4. Originally the city had twenty-one objectives. Over time, one internal objective was dropped and another was consolidated into the financial perspective.
5. Kaplan, “City of Charlotte (A),” 4.
6. Balancing Measures: Best Practices in Performance Management (Washington, DC: National Partnership for Reinventing Government, August 1999), 6 (publication available at http://www.npr.gov/library/papers/bkgrd/balmea-sure.html).
7. Robert S. Kaplan and David P. Norton, The Balanced Scorecard: Translating Strategy into Action (Boston: Harvard Business School Press, 1996), 181-82.
8. We don’t have space to document all the interesting scorecard applications occurring in government agencies around the world. One application in an enforcement agency has been implemented by the Swedish National Police Board.
9. The UWSENE operates in Rhode Island and adjacent communities in Connecticut and Massachusetts. The UWSENE story is described in more detail in R. Kaplan and E. Kaplan, “United Way of Southeastern New England,” 9-197-036 (Boston: Harvard Business School, 1996).
10. Ibid., 4.
11. Ibid., 8.
12. Ibid., 7-8.
13. R. Kaplan and J. Elias, “New Profit, Inc.,” 100-052 (Boston: Harvard Business School, 1999).
14. Ibid., 8.
15. Ibid., 8-9.
16. Details on one organization, Jumpstart, can be found in Kaplan and Elias, “New Profit, Inc.”
17. Ibid., 10-11.
18. Ibid., 11.
19. Material taken from J. Meliones et al., “A Three-Year Experience Using a Balanced Scorecard to Practice Smarter” (Durham, NC: Duke Children’s Hospital, 1999).