C H A P T E R T H R E EC H A P T E R T H R E E
WHEN WE FIRST FORMULATED THE BALANCED SCORECARD in the early 1990s, we built strategy scorecards from a clean sheet of paper. We let the story of the strategy emerge onto the four perspectives through executive interviews and interactive workshops. We have now analyzed the hundreds of strategy scorecards built since that time and have mapped the patterns into a framework that we call a strategy map. A strategy map for a Balanced Scorecard makes explicit the strategy’s hypotheses. Each measure of a Balanced Scorecard becomes embedded in a chain of cause-and-effect logic that connects the desired outcomes from the strategy with the drivers that will lead to the strategic outcomes. The strategy map describes the process for transforming intangible assets into tangible customer and financial outcomes. It provides executives with a framework for describing and managing strategy in a knowledge economy.
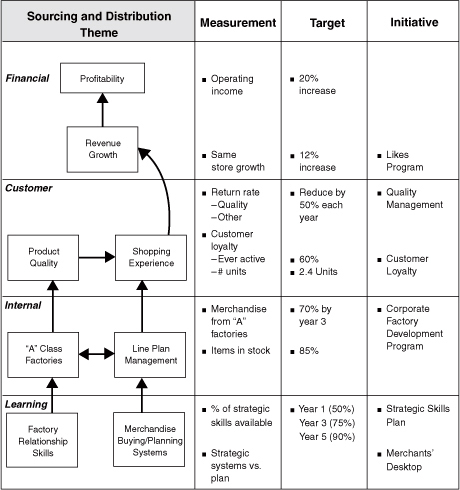
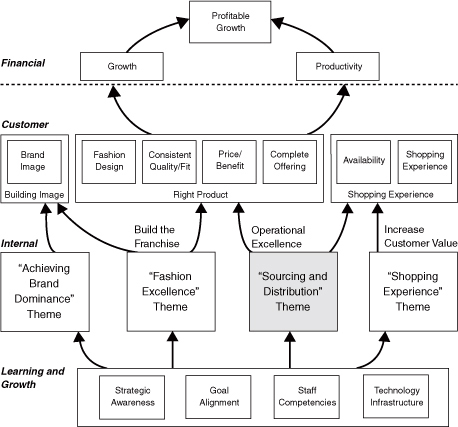
A Balanced Scorecard strategy map is a generic architecture for describing a strategy. As an example, the left-hand diagram in Figure 3-1 illustrates the architecture of a strategy map for a retail firm specializing in women’s clothing. The cause-and-effect logic of this design constitutes the hypotheses of the strategy. The financial perspective contains two themes—growth and productivity—for improving shareholder value. The value proposition in the customer perspective clearly emphasizes the importance of fashion, fit, and a complementary product line for the growth strategy. Four strategic themes in the internal perspective—brand dominance, fashion excellence, sourcing and distribution, and the shopping experience—deliver the value proposition to customers and drive the financial productivity theme. The right-hand diagram in the figure shows the detailed strategy map and Balanced Scorecard for one of the four strategic themes: sourcing and distribution. The diagram shows how this theme affects the customer objectives of product quality and product availability that, in turn, drive customer retention and revenue growth. Two internal processes—the factory management program and the line planning process—also contribute to these objectives. The former determines the quality of the factories used for manufacturing the product, and the latter determines the quantities, mix, and location. New skills and information systems support both of these processes. The strategy map and scorecard for the sourcing and distribution theme define the logic of the approach to improving product, quality, and availability. The cause-and-effect relationships on the strategy map—and the measures, targets, and initiatives on the scorecard—comprise the strategy for this theme.
Figure 3-1 A Fashion Retailer’s Strategy Map
| The Revenue Growth Strategy | The Productivity Strategy |
| “Achieve aggressive, profitable growth by increasing our share of the customer’s closet” | “Improve operating efficiency through real estate productivity and improved inventory management” |
Strategy maps help organizations see their strategies in a cohesive, integrated, and systematic way. Executives often describe the outcome from constructing this framework as “the best understanding of strategy we have ever had.” And beyond just understanding, strategy maps provide the foundation for the management system for implementing strategy effectively and rapidly.
The Balanced Scorecard overcomes the limitations of purely financial measurement systems by clearly portraying the value-creating processes and critical roles for intangible assets. The scorecard describes the multiple indirect linkages required to connect improvements in an organization’s intangible assets—the ultimate drivers of knowledge-based strategies—to the tangible customer and financial outcomes from the strategy. The customer value proposition defines the context for how the intangible assets create value. For example, if “fashion and design” are part of the customer value proposition, then an intangible asset, such as merchandising skill, is necessary for the strategy to succeed. The strategic themes describe the “recipe” for combining the intangible ingredients of skills, technologies, and organizational climate with internal processes, such as sourcing and distribution, to create tangible outcomes—customer loyalty, revenue growth, and profitability. In this way, the Balanced Scorecard provides the measurement and management framework for knowledge-based strategies.
Strategy does not (or should not) stand alone as a management process. A continuum exists that begins in the broadest sense, with the mission of the organization. The mission must be translated so that the actions of individuals are aligned and supportive of the mission. A management system should ensure that this translation is effectively made. Strategy is one step in a logical continuum that moves an organization from a high-level mission statement to the work performed by frontline and back-office employees.
If we are to build a consistent architecture for describing strategy, we must have a consistent way of positioning it relative to other management processes. Figure 3-2 presents a view of strategy that we have found effective in practice. The overarching mission of the organization provides the starting point; it defines why the organization exists or how a business unit fits within a broader corporate architecture.
Figure 3-2 Translating a Mission into Desired Outcomes
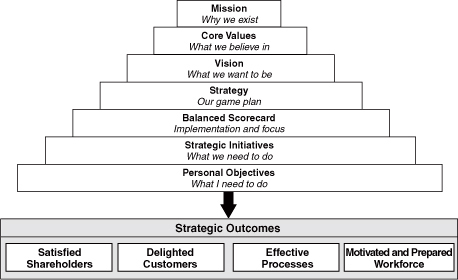
The mission and the core values that accompany it remain fairly stable over time. The organization’s vision paints a picture of the future that clarifies the direction of the organization and helps individuals to understand why and how they should support the organization. In addition, it launches the movement from the stability of the mission and core values to the dynamism of strategy, the next step in the continuum. Strategy is developed and evolves over time to meet the changing conditions posed by the real world.
Gerry Isom accepted the presidency of CIGNA’s Property & Casualty Division in 1993, inheriting an organization on the brink of failure. Business losses had been mounting. By 1998, the company’s profitability positioned it strongly within the industry, with many of its businesses exhibiting top-quartile performance. Isom had to create a clear picture of what this organization could become over the next five years. He used the term specialist to define the basic change in strategy that could create a success. “Top quartile” defined a level of success that, while difficult to comprehend when the organization was on the brink of bankruptcy, implied an organization that people could be proud to be working for. The “five-year” goal gave a sense of perspective to the statement.
The vision creates the picture of the destination. The strategy defines the logic of how this vision will be achieved. Vision and strategy are essential complements. At CIGNA, the vision was appealing but lacked credibility until a strategy was developed to show how this vision would be accomplished. Isom used a very simple but clever technique to accomplish this; he “quantified” his vision. The insurance industry uses a measure called combined ratio as a surrogate for profitability. The ratio divides the expenses of the organization—claims paid plus operating expenses—by its revenues from premium income. In an ideal world, this ratio should be less than one (operating revenues exceed expenses). But because the cash from premiums received is invested until it is required for claims, top-quartile performers can have combined ratios of around 103, with the investment process providing an additional source of income to generate profitability.
In 1993, the Property & Casualty Division’s combined ratio was nearly 140. The high-level strategy to achieve a top-quartile combined ratio is shown in Figure 3-3. The strategy had four themes:
A. Manage producers (agents)
B. Focus geographically
C. Upgrade the underwriting process
D. Align the organization
Figure 3-3 CIGNA P&C’s Strategy for Becoming a Top-Quartile Performer
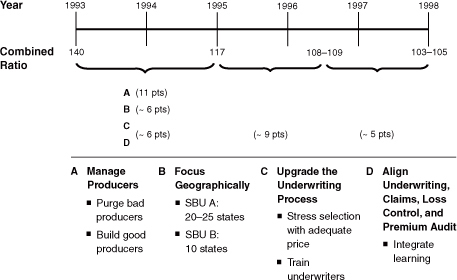
A timeline was established, and rough goals for the reduction in the combined ratio were identified for each component of the strategy. In this way, the seemingly impossible goal of a 35-point reduction in the ratio was broken into pieces and then spread over time. Instead of one giant, impossible leap to the top quartile, the vision was decomposed into a strategy that comprised a series of smaller steps. The organization could now see how Isom’s vision could, in fact, be accomplished. As Isom reported, “The structure of the scorecard helped us clarify our strategy and kept the organization focused on making our vision a reality.”
The strategy specifies general directions and priorities. Translating the strategy into action is the next step in the continuum. For this to occur—for the strategy to drive the actions of thousands of people and the investment of millions of dollars—the language of the strategy must be made more specific. Strategy maps and the Balanced Scorecard provide the tools to translate general strategic statements into specific hypotheses, objectives, measures, and targets.
Michael Porter describes the foundation of strategy as the activities in which an organization elects to excel: “Ultimately, all differences between companies in cost or price derive from the hundreds of activities required to create, produce, sell, and deliver their products or services…. [D]if-ferentiation arises from both the choice of activities and how they are performed.”1
The essence of strategy is choosing to perform activities differently from competitors so as to provide a unique value proposition. A sustainable strategic position, in Porter’s view, comes from a system of activities, each of which reinforces the others.
The Balanced Scorecard—a descriptive and not a prescriptive framework—builds a view of strategy that, while developed independently of Porter’s framework, is remarkably similar. The Balanced Scorecard design process builds upon the premise of strategy as hypotheses. Strategy implies the movement of an organization from its present position to a desirable but uncertain future position. Because the organization has never been to this future position, its intended pathway involves a series of linked hypotheses. The scorecard enables the strategic hypotheses to be described as a set of cause-and-effect relationships that are explicit and testable. Further, the strategic hypotheses require identifying the activities that are the drivers (or lead indicators) of the desired outcomes (lag indicators). The key for implementing strategy is to have everyone in the organization clearly understand the underlying hypotheses, to align resources with the hypotheses, to test the hypotheses continually, and to adapt as required in real time.
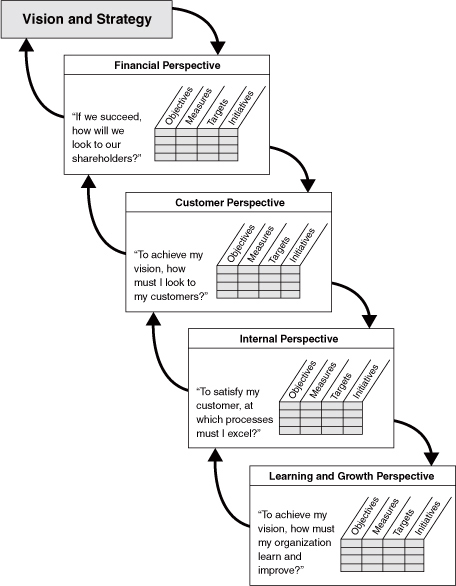
Figure 3-4 illustrates the architecture of a Balanced Scorecard. The scorecard defines the set of near-term objectives and activities, the drivers, that will differentiate a company from its competitors and create long-term customer and shareholder value, the outcomes. The process begins in a top-down fashion, clearly defining strategy from the perspective of the shareholder and customer. It asks, “What are the financial objectives for growth and productivity? What are the major sources of growth?” Once the financial objectives have been specified, the process continues by asking, “Who are the target customers that will generate revenue growth and a more profitable mix of products and services? What are their objectives, and how do we measure success with them?” The customer perspective also should include the value proposition, which defines how the company differentiates itself to attract, retain, and deepen relationships with targeted customers. Financial and customer objectives are desired outcomes, but they don’t explicate how to achieve them. The internal business processes—such as product design, brand and market development, sales, service, and operations and logistics—define the activities needed to create the desired customer value proposition and differentiation, and the desired financial outcomes.
The fourth perspective recognizes that the ability to execute internal business processes in new and differentiated ways will be based on the organization infrastructure; the skills, capabilities, and knowledge of employees; the technology that they use; and the climate in which they work. We refer to these as the learning and growth factors.
Thus the architecture of the Balanced Scorecard has a top-down logic, starting with the desired financial and customer outcomes and then moving to the value proposition, business processes, and infrastructure that are the drivers of change. The relationships between the drivers and the desired outcomes constitute the hypotheses that define the strategy.
Figure 3-4 Defining the Cause-and-Effect Relationships of the Strategy
In our experience, executives almost always separate their strategies into several focused themes. For example, an insurance company built its strategy around three strategic themes:
An agribusiness firm defined four themes:
These focused themes allowed the organizations to deal with the conflicting priorities of long-term versus short-term or growth versus profitability.
In general, strategic themes reflect what the management team believes must be done to succeed. The themes do not reflect financial outcomes such as “improved shareholder value” or customer outcomes such as “higher customer retention” and “higher market share.” The strategic themes reflect the executives’ view of what must be done internally to achieve strategic outcomes. As such, the themes typically relate to internal business processes.
Strategic themes provide a way to segment the strategy into several general categories.
Each of the four strategic themes provides a “pillar” for the strategy (see Figure 3-5) and contains its own strategic hypothesis, its own set of cause-and-effect relationships, and, occasionally even, its own scorecard. The architecture based on strategic themes is so transparent that many executive teams, as we later discuss, use the themes to assign accountability for managing the execution of the strategy.
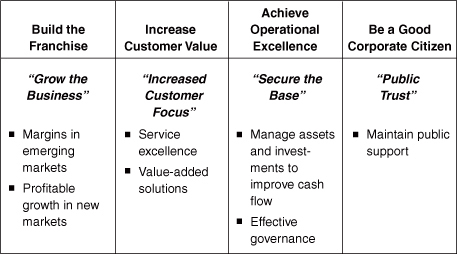
As further examples of strategic themes, consider a chemical company that was attempting to reposition itself by building full-service relationships with its customers. It defined one simple objective for each of its four strategic themes (see Figure 3-6). A utility company defined four strategic themes as it prepared for deregulation, consolidating its core businesses while simultaneously moving into more customer-focused businesses (see Figure 3-7).
Figure 3-5 Architecture of a Strategy Map
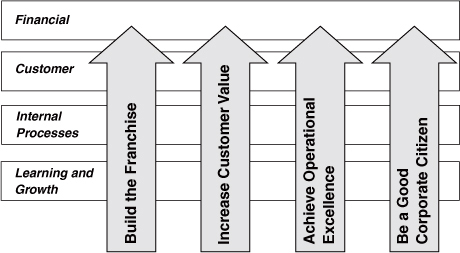
Figure 3-6 A Chemical Company’s Strategic Themes
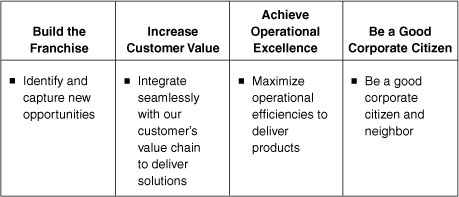
Figure 3-7 A Utility Company’s Strategic Themes
The strategic themes define long-term (“build the franchise”), mid-term (“increase customer value”), and short-term (“operational excellence”) value propositions for targeted customers. Balanced Scorecard strategy maps portray the cause-and-effect relationships of how the strategic themes drive improved customer and financial outcomes.
We can illustrate the construction of strategy maps with Store 24, a New England-based convenience-store company. Store 24 has approximately 100 stores located in urban neighborhood settings—a “mature market” environment. Store 24 wants to create higher growth rates by increasing the amount of business from the young adult population, which is growing at higher than average rates.
The typical convenience store attempts to compete through “operational excellence” strategies, offering fast, friendly service, clean surroundings, good quality, and product selection tailored to its target customers. Store 24 seeks to differentiate itself by creating an interesting and enjoyable shopping experience, such as by offering innovative in-store promotions. In effect, Store 24 is attempting to shift the value proposition from operational excellence to customer intimacy.
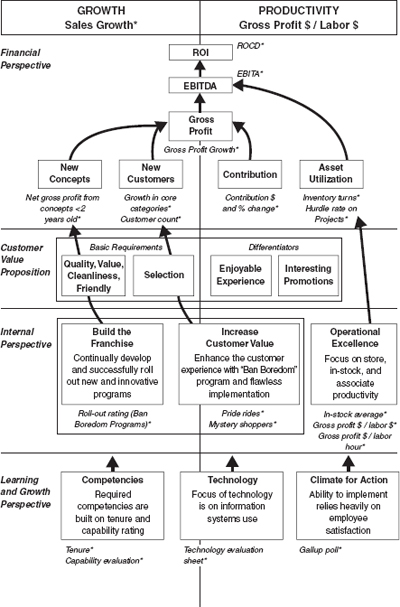
The financial perspective of the strategy map (see Figure 3-8) shows how the high-level objectives (return on investment and earnings) are based on simultaneously managing growth and productivity. Growth arises from successful promotions that increase customer loyalty and sales in core categories. Productivity will be achieved by using standard industry approaches to improve labor productivity and increase inventory turnover.
Store 24 plans to differentiate itself in customers’ eyes by providing “entertaining and unexpected fun” during the shopping experience. The company motto, posted in all stores, is “Store 24 Bans Boredom.” A typical in-store promotion during the Halloween season finds toy spiders hanging from the ceiling, spooky background music, and employees wearing costumes.
Store 24’s strategic themes are linked to key internal processes. To support its customer intimacy strategy, Store 24 must pay close attention to the in-store shopping experience. Accordingly, the company has made significant investments in staff training programs to ensure that this strategy is executed at the point of customer contact (the customer-management process). The innovation process focuses on the development of new promotions and layouts that will deliver on the promise to ban boredom. And the operations process is linked to a focus on cost and inventory management needed to meet productivity objectives.
Figure 3-8 Store 24’s Strategy Map
*Measures
The learning and growth strategy is aligned with the requirements for strategic business processes and customer differentiation. Because Store 24’s strategy is totally dependent on the behavior of store personnel at the point of sale, the learning and growth strategy calls for retention of experienced store personnel who can sustain customer relationships. It also requires significant training for the staff, complemented by ongoing evaluation programs. The employee satisfaction measure on the scorecard shows that Store 24 recognizes that the employee is a true partner in the overall strategy.
The Store 24 strategy as described above is unique in the industry. We will elaborate on it and on Store 24’s scorecard later in this chapter. In Chapter 12, we will describe how the strategy evolved and how the score-card changed over time.
The development of a strategy map proceeds in a top-down fashion (as shown in Figure 3-4). It begins with the high-level financial strategy for growth, profitability, and shareholder value.2 Creating shareholder value is the outcome that every strategy seeks to accomplish. A company will typically choose a single overarching or “dominant” objective as its long-term indicator of success. Historically, some version of the DuPont return on investment (ROI) or ROCE measure has been used as the overarching financial objective. More recently, companies have adopted various shareholder and value-based-management metrics such as EVA, cash-flow ROI, and variations of discounted cash flow.3
EVA’s contribution as a financial metric is to go beyond accounting net income by recognizing an explicit capital charge for a business. The capital charge is calculated by applying a business-specific (and perhaps asset-specific) cost of capital to an organization’s recorded assets. Thus EVA equals the (accounting) net income less the capital charge.4 Businesses that are earning above their risk-adjusted cost of capital are said to be creating shareholder value, whereas businesses earning less than their cost of capital are destroying shareholder value. EVA addresses the defect in the ROI calculation of discouraging businesses from investing in projects that return above their cost of capital but below the (apparent) average cost of capital calculated by dividing net income by assets employed. EVA also addresses the defect in a pure accounting income calculation that ignores the cost of assets employed to generate accounting profits.
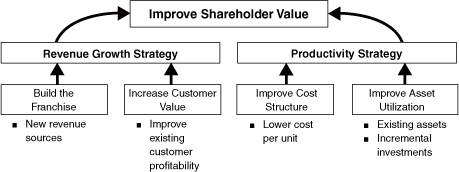
Whether companies use ROI, ROCE, EVA, or some other value-based metric as the high-level financial objective, they have two basic strategies for driving their financial performance: growth and productivity (see Figure 3-9). The revenue growth strategy focuses on developing new sources of revenue and profitability. It generally has two components:
Store 24, for example, focused on revenues generated from innovative promotions and the expansion of revenues from target segments as its growth strategy.
Figure 3-9 Building the Strategy Map: The Financial Perspective
The productivity strategy features the efficient execution of operational activities in support of existing customers. Productivity strategies focus on cost reduction and efficiency. Like the revenue growth strategy, the productivity strategy generally has two components:
Store 24 focused on inventory turnover and labor productivity as the key financial indicators for its productivity strategy.
The productivity strategy generally yields results sooner than the growth strategy. But one of the principal contributions of the Balanced Scorecard is to highlight the opportunities for enhancing financial performance through revenue growth, not just by cost reduction and asset utilization. Also, the balancing helps to ensure that cost and asset reductions do not compromise a company’s growth opportunities. In fact, companies whose strategy features only the productivity element are likely to gain less benefit from the Balanced Scorecard. Financial metrics, such as process costs (available from a well-functioning, activity-based costing system), and productivity ratios provide an adequate language and reporting framework for a pure productivity strategy.
The link to strategy in the financial perspective arises as organizations choose a balance between the contradictory levers of growth and productivity. Companies that are in early-stage startup mode or see opportunity for extremely rapid growth will emphasize objectives and measures from the revenue growth strategy. Cost and productivity will be subservient, as these organizations spend heavily to develop and introduce new products and services and to extend into new markets and applications. Companies in the mature end of their lifecycle will emphasize the cost reduction and asset utilization components, as limited opportunities remain to find new customers or expand into new markets. Most companies are in the middle of their life cycle and therefore employ a “profitable growth” strategy that requires a balance of the contributions from revenue growth and from cost reduction and productivity. These companies will have a balance of measures across the two generic financial strategies.
Note also how the strategic themes, introduced earlier in the chapter, relate to the two financial strategies. Typically, the “building the franchise” and “increasing customer value” themes will drive the financial growth strategy, and “achieving operational excellence” will drive the productivity strategy. But the relationship is not one-to-one. Expanding the customer base can contribute to lower unit costs, and operational excellence can contribute to a better customer buying experience.
We now turn to the customer perspective that drives the revenue growth (financial) objective. We also discuss how to link customer outcomes to value propositions and the organization’s strategic themes.
The core of any business strategy—connecting a company’s internal processes to improved outcomes with customers—is the “value proposition” delivered to the customer. The value proposition describes the unique mix of product, price, service, relationship, and image that the provider offers its customers. The value proposition determines the market segments to which the strategy is targeted and how the organization will differentiate itself, in the targeted segments, relative to competition. A clearly stated value proposition provides the ultimate target on which the strategic themes of critical internal business processes and infrastructures are focused. We have found that approximately 75 percent of executive teams do not have a clear consensus around the customer value proposition. The development of this layer of the strategy map forces the team to clarify its understanding of the customer and is one of the most valuable parts of a Balanced Scorecard design process.
As we reviewed the value propositions of successful Balanced Score-card users, we found that they matched well with the three different strategies, described by Treacy and Wiersema, that an organization uses to differentiate itself in the marketplace.5
The claim (and good supporting evidence) is that successful companies excel at one of these three dimensions of value while maintaining “threshold standards” on the other two. For example, The Home Depot differentiates itself through the superior knowledge and helpfulness of its sales staff, a customer intimacy strategy. The company must still have excellent product selection, high-quality inventory management, and reasonable prices, but these are not the primary reasons for its targeted customers to shop there. Costco, on the other hand, provides the lowest cost to the consumer by selling items in bulk, at low prices, in a warehouse environment, which is an operational excellence strategy. The sales staff must be well trained, and the products offered must be recognized as high quality, but customers shop at Costco for convenience and low price, not the uniqueness of the product selection or sales support. Intel, Sony, and many pharmaceutical companies succeed by offering the best product for their customers’ needs. Prices of product leadership companies are generally high and service is adequate but not necessarily exceptional. Customers purchase the products from these companies because of their unique capabilities and functionality.
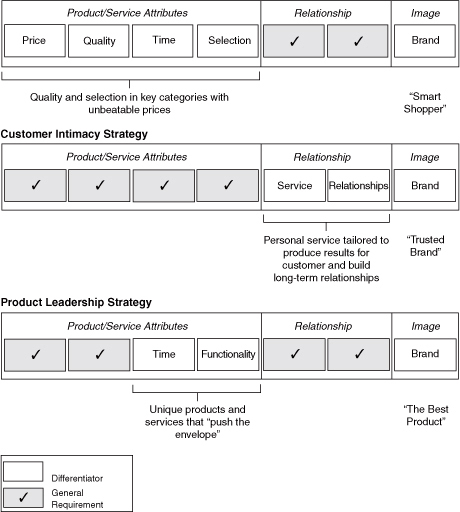
Figure 3-10 shows the template that translates these generic strategy concepts into the strategy maps used for Balanced Scorecard design. Notice that different aspects of the value proposition become more crucial depending on the strategy. Companies following an operational excellence strategy need to excel at measures of competitive price, customer-perceived quality, and lead time and on-time delivery for purchasing. Companies following a product leadership strategy must excel at the functionality, features, and performance of their product or service. And companies following a customer intimacy strategy will stress the quality of their relationships with customers and the completeness of the solution offered to customers. For example, Store 24’s customer intimacy strategy (recall Figure 3-8) used a value proposition based on three differentiators: an exciting shopping experience, friendly employees, and interesting promotions. Product quality, price, and selection were basic requirements but not differentiators.
Figure 3-10 also provides a diagnostic check on whether an organization’s Balanced Scorecard measures matches its strategy. We often encounter companies that espouse a strategy of product innovation or “value-added customer relationships.” Yet their customer measures relate to customer satisfaction on operational dimensions such as defects, lead times, and price. No objectives or measures relate to the espoused strategy of product leadership or customer intimacy. By using the template of Figure 3-10, companies can detect when their measures are misaligned with their strategy.9
Figure 3-10 Building the Strategy Map: The Customer-Value Proposition
Operational Excellence Strategy
The value proposition enables companies to define their targeted customers. Most markets consist of heterogeneous customers. Some customers value innovation the most, others value the close partnering relationships with their suppliers, and still others prefer low price, consistent quality, and ease of purchase. Strategy is about choice. As it selects the value proposition at which it will excel, a company also selects the customer segment or segments for whom that value proposition will be the differentiator, causing them to do business with the company. Targeted customers are those who place the highest importance, in their buying decision, on the attributes of the value proposition offered by the company.
It is important to identify clearly the company’s targeted customers. They become the focus of the customer outcome measures in the company’s Balanced Scorecard. The generic customer measures—satisfaction, acquisition, retention, account share, market share, and profitability—should be measured for targeted customers. Companies that choose a product leadership or customer relationship strategy will disappoint price-sensitive customers. Conversely, companies that offer standard products and services, at the lowest prices, will disappoint customers who value innovation or personalized service. For the scorecard to faithfully represent the strategy, the customer outcomes should be measured for the targeted customers who, the strategic hypothesis claims, most appreciate the value proposition selected by the company.
The idea of selecting some customers as more important than others may be unfamiliar and uncomfortable for many companies. But selection is about choice. Michael Porter expresses this position eloquently: “Strategy renders choices about what not to do as important as choices about what to do. Indeed, setting limits is another function of leadership. Deciding which target group of customers, varieties, and needs the company should serve is fundamental to developing a strategy. But so is deciding not to serve other customers or needs and not to offer certain features or services.” 10 Strategy is reflected in the customer perspective of the Balanced Scorecard through the emphasis of a particular value proposition and the measurement of outcomes for targeted customers.
The value proposition connects upward in the strategy map to the measurement of customer outcomes and then to the financial objectives. It also connects downward to the critical internal processes that enable the company to deliver its value proposition to targeted customers.
The customer value proposition and how it translates into growth and profitability for the shareholder is the foundation of strategy. But the customer value proposition and financial outcomes are the outcomes that organizations want to achieve. Strategy must not only specify the desired outcomes; it must also describe how they will be achieved. Again referring back to Porter, “The essence of strategy is in the activities—choosing to perform activities differently or to perform different activities than rivals.”11 Porter claims that “activities are the basic units of competitive advantage” The art of developing a successful and sustainable strategy is ensuring alignment between an organization’s internal activities and its customer value proposition.
The activities of an organization are embodied in the internal business processes that comprise its value chain. We have found it useful to segment the value chain into four sets of business processes, corresponding to the four strategic themes introduced earlier in the chapter, as shown in Figure 3-11.
All of these processes are important and must be performed well by every organization. But companies must excel at the one process that has the maximum impact on its customer value proposition. The other two or three processes are supportive, not primary (see Figure 3-12).
A product leadership strategy would require a leading-edge innovation process that created new products with best-in-class functionality and brought them to market rapidly. Customer management processes might focus on rapid acquisition of new customers to consolidate the early mover advantage that a product leader creates.
A customer intimacy strategy, on the other hand, requires excellent customer management processes such as relationship management and solution development. The innovation process would be motivated by the needs of targeted customers, focusing on those new product developments and service enhancements that contribute to better customer solutions.
Figure 3-11 A Generic Organization’s Value Chain
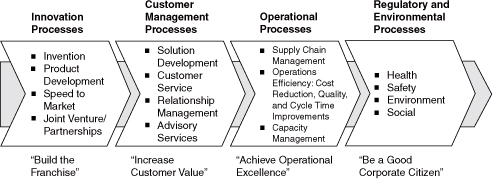
Figure 3-12 Identifying Strategic Internal Business Processes
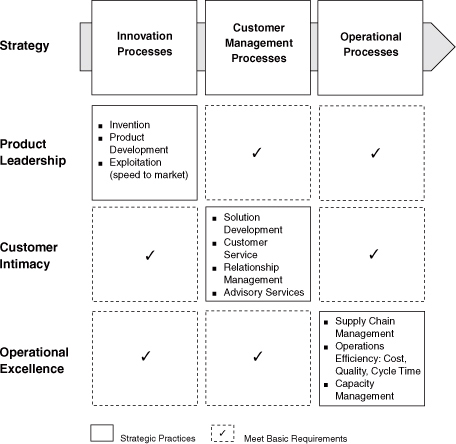
A strategy for operational excellence emphasizes measures of the cost, quality, and cycle time of operating processes, excellent supplier relationships, and speed and efficiency of supply and distribution processes.
Many companies, unfortunately, espouse a strategy of innovation or developing value-adding customer relationships but choose internal business processes measurements that focus on cost and quality of manufacturing processes. These companies have a complete disconnect between their measurements and their strategy. It is not surprising that so many companies have difficulty implementing new growth strategies when their primary measurements emphasize cost reduction, standardization, and efficiency. Figure 3-12, like Figure 3-10, provides a diagnostic for companies to validate that the objectives and measures they select for their internal business process perspective match the priorities of their strategy.
Companies also can identify two new constituents in the internal business process perspective—suppliers and the public—that may be important for their strategy. The success of many companies—retailers such as Sears, Roebuck and Co., The Limited,Inc.,and Wal-Mart Stores, Inc.; electronics manufacturers such as Hewlett-Packard Company and Sun Microsystems, Inc.; and automotive firms—depends on having great suppliers and great relationships with their suppliers. When outstanding supplier relationships are critical for a strategy, this objective should be incorporated in the operations process of the internal perspective.
Businesses such as telecommunications and utilities companies, whose prices and operations are regulated to some extent by the government, must have excellent relationships with these authorities and legislatures. Companies whose operations entail EHS risks need to comply with regulations in the communities where they operate. Beyond compliance, they may seek to achieve a reputation as a leader in EHS performance to enhance their ability to recruit and retain valuable employees, and to maintain and expand their physical presence in communities. When such regulatory and EHS considerations are vital for a successful strategy, companies include several objectives in a “good corporate citizen” strategic theme in the internal perspective.
Returning to our example of Store 24 (Figure 3-8), the critical internal process was providing a unique and attractive in-store shopping experience to support its customer intimacy strategy. The company made significant investments in staff training programs to ensure that this strategy was executed at the point of customer contact (the customer management process). The innovation process focused on the development of new promotions and layouts that enabled Store 24 to deliver on its promise to ban boredom.
We have explicated and illustrated how a strategy map organizes financial, customer, and internal process objectives by strategic themes, financial strategies, value propositions, and critical internal processes. We now address the foundation for all strategy: the learning and growth perspective.
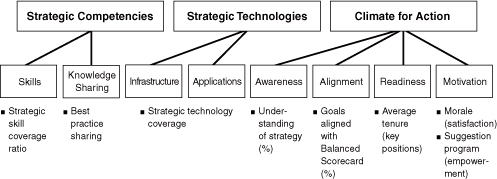
The learning and growth strategy defines the intangible assets needed to enable organizational activities and customer relationships to be performed at ever-higher levels of performance. There are three principal categories for this perspective (see Figure 3-13):
The learning and growth strategies are the true starting point for any long-term, sustainable change. Executive teams readily acknowledge the importance of this perspective but generally have low levels of awareness and consensus about how to define or achieve objectives in it. The thoughtful design of learning and growth strategies presents a major opportunity to improve the odds of successful strategy implementation.
Figure 3-13 The Learning and Growth Perspective
By treating the learning and growth strategy after the three other perspectives have been defined, executives can align their human resources, information technology, and corporate climate objectives with the requirements from the strategic business processes and customer differentiation strategy. For example, Store 24’s strategy (Figure 3-8) depended totally on the behavior of store personnel at the point of sale. Its learning and growth strategy called for the retention of experienced store personnel who could sustain customer relationships and provide the “fun” buying experience. The human resources strategy also required significant training for the staff, complemented by ongoing evaluation programs. The employee satisfaction measure on the scorecard recognized that the employee had to be a true partner with the strategy.
The work of Carla O’Dell and C. J. Grayson on knowledge management has built a complementary framework for thinking about learning and growth strategies. They describe the goal of knowledge management as “a systematic approach to find, understand, share and use knowledge to create value.”12 The greatest value comes when knowledge management is linked to the strategy and value proposition of the organization. As summarized in Figure 3-14, different value propositions require different knowledge management strategies. Customer intimacy requires employees to understand their customers so that they can build long-term relations with them. Lexus, for example, requires every employee to survey ten customers per month by phone. Product innovators must accelerate the time to develop and commercialize new products. Companies such as Eli Lilly and Company and The Dow Chemical Company use knowledge management approaches to manage patents, development cycles, and customer requirements. Operational excellence companies, in their quests to lower cost and improve quality, use best-practice sharing approaches to move winning approaches “from the best to the rest.” Companies like Chevron Corporation or BP Amoco have used knowledge management to improve safety, reduce energy costs, and shorten construction cycles.
In knowledge-based organizations, the ability to improve business processes, consistent with a customer value proposition, depends on the ability and willingness of individuals to change behavior and focus their knowledge on the strategy. Some people have objected to placing the learning and growth perspective at the bottom of Balanced Scorecard diagrams. They feel this minimizes the importance of this perspective. Quite the contrary; we placed this perspective at the bottom because it is the foundation for everything else above it. Or, to use another metaphor, learning and growth objectives are like the roots of a tree. They are the source of support, nourishment, and growth for the beautiful foliage and blossoms (financial breakthroughs) that appear at higher elevations of the scorecard. The learning and growth initiatives are the ultimate drivers of strategic outcomes.
Figure 3-14 Knowledge Management Strategies
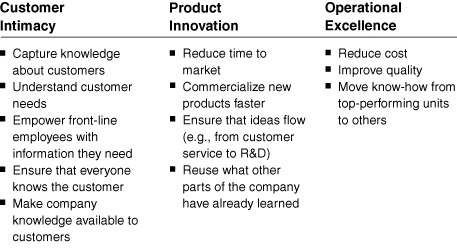
Source: Based on material from Carla O’Dell, C. Jackson Grayson, “Knowledge Transfer: Discover Your Value Proposition” Strategy and Leadership (March-April 1999).
Figure 3-15 integrates the preceding development into a generic template for creating a strategy map. The growth theme in the financial perspective is realized through growth from fundamentally new sources (“build the franchise”) and growth from expanded relations with existing customers (“increase customer value”). The productivity theme is achieved through expense and asset management.
Figure 3-15 Describing the Strategy: The Balanced Scorecard Strategy Map
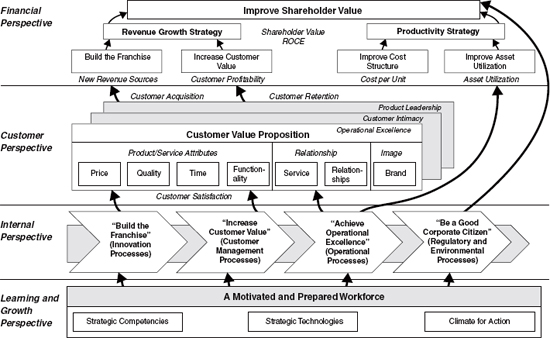
The customer perspective, the heart of the strategy, defines how growth will be achieved. The value proposition defines the specific strategy to compete for new customers or increased share of existing customer businesses. A clear definition of this value proposition is the most important single step in the development of a strategy map. The internal perspective defines the business processes and the specific activities that the organization must master to support this customer value proposition. The learning and growth perspective defines the competencies, know-how, technology, and climate needed to support these high-priority processes and activities. When properly constructed, the strategy map portrays an integrated and logical description of how the strategy will be accomplished.
In our consulting work, we have developed generic strategy maps for different industries and different classes of strategies; these include, for example, a company in the chemical industry following a product innovation strategy. The template is a starting point for the design process that then gets tailored for the particular organization. When we don’t already have such an industry template, we start with the generic template in Figure 3-15 as the starting point. The templates help executive teams describe their strategies and improve exponentially the quality of their insights. They facilitate greater precision in defining the customer value proposition and increase awareness that internal processes, competencies, and technologies must be linked to that value proposition. Templates also foster a cause-and-effect mentality that encourages more innovative approaches to strategy implementation.
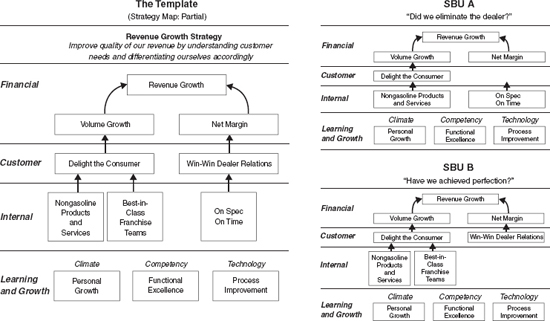
Templates are also useful to analyze or reverse-engineer an existing scorecard. A well-designed Balanced Scorecard should tell the story of the strategy. Thus if you were to begin with a scorecard, you should be able to reverse the logic and deduce the strategy. Mobil used this approach to evaluate the quality of the scorecards being used by its strategic business units (SBUS). The left-hand side of Figure 3-16 shows a partial view of the strategy map for the division’s revenue growth theme. It shows, as described in Chapter 2, how customer and dealer satisfaction were to be created through nongasoline products, improved dealerships, and quality. Senior management then compared the scorecards being used by SBUS to this template. The scorecard of one unit, shown in the upper right, made no mention of a dealer. What was the message if this scorecard did, in fact, reflect its strategy? Were dealers not strategic? Had the SBU found a way to bypass the dealer? The unit shown in the lower right of Figure 3-16 made no mention of quality on its scorecard. Again, what was the message? Was quality not strategic in this business? Applying the template to SBU scorecards, Mobil’s executive team could identify gaps in the strategies being implemented at lower levels of the organization and ensure that the high-level strategies were truly reflected on local scorecards.
Figure 3-16 Reverse-Engineering a Scorecard to Describe the Strategy: The Mobil Experience
Performance measurement systems typically are aggregations of standalone measures, such as return on capital, customer satisfaction, and defect rates. Each measure can have an authoritative literature, practical experience, and even consulting firms that focus on the properties and measurement of the underlying phenomenon (financial performance, meeting customer expectations, and process quality). Conferences are convened on metrics to describe their subtleties and applications. But stand-alone measures are ultimately limited in their ability to describe and manage an organization’s value-creating processes. Take a human resource measure, such as employee turnover. This measure can be refined by measuring turnover in various employee categories and degrees of criticality for the organization. A signal that employee turnover in a critical category last period was 10 percent will likely be useful to the organization. Benchmarking studies can improve the insight further by comparing the turnover rate to that of other companies in the same industry or geographical location. If the 10 percent turnover was lower than that experienced by 90 percent of comparable organizations, the recent performance can be considered quite good. But this benchmarked performance for retention of key employees still does not indicate anything about the value of decreasing key employee turnover. The value comes from noting a correlation between employee retention and customer satisfaction and loyalty, and a further correlation between customer loyalty and increased revenue. Organizational value comes not from increasing individual measures of an intangible asset or internal process but from linking changes in such measures to customer and financial outcomes.
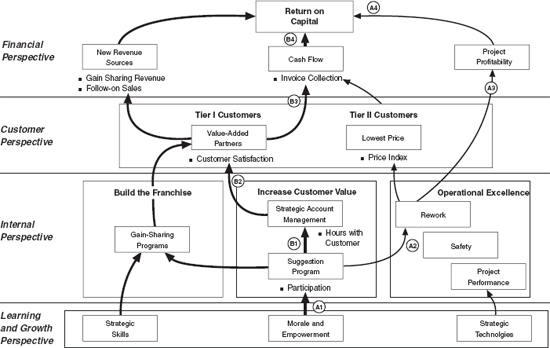
The cause-and-effect linkages in Balanced Scorecard strategy maps describe the path by which improvements in the capabilities of intangible assets get translated into tangible customer and financial outcomes. Take, as an example, the experience of the undersea contractor, Rockwater, a division of Brown & Root Energy Services. Rockwater embarked on a strategy to improve its return-on-capital financial performance through two strategic themes: operational excellence—reducing costs and improving quality—and customer management—developing long-term partnerships with targeted (Tier I) customers. Both themes required new capabilities and attitudes on the part of the workforce (see Figure 3-17).
For the operational excellence theme, improved attitude and morale among employees led to a higher frequency of suggestions (linkage A1 in Figure 3-17). The suggestions in turn led to many improvements in work practices that significantly reduced the incidence of costly rework (linkage A2). The lower incidence of rework translated directly into lower project costs (A3), higher profitability, and a higher return on capital (A4). The project teams could also leverage their cost-reduction experiences into lower prices for future work for price-sensitive (Tier II) customers.
For the customer management strategic theme, the company could observe that its most satisfied value-seeking (Tier I) customers were serviced by employees who had scored highest on measures of attitude and alignment with Rockwater’s strategy (linkages B1 and B2). These satisfied customers paid outstanding invoices with the shortest delays (linkage B3), thirty to ninety days faster than dissatisfied customers paid. The short collection period led to lower levels of working capital and higher cash flows leading directly (linkage B4) to an increased return on capital.
Measuring organizational performance requires such causal chains of value creation. Stand-alone measures cannot capture the means by which improvements in intangible assets and internal processes lead to increased performance in outcome measures. The linkages in strategy maps provide the recipes for such transformations and value creation. The three strategic themes described earlier in the chapter represent the linkages for value creation over three- to five-year planning horizons: near term, achieve operational excellence; medium term, increase customer value; and long term, build the franchise. Collectively, they enable executives to manage and balance the drivers of short- and long-term performance.
Many organizations say they have a Balanced Scorecard because they use a mixture of financial and nonfinancial measures. Certainly, such measurement systems are more “balanced” than ones that use financial measures alone. Yet the underlying assumptions and philosophies that govern many of these scorecards are quite different from the strategy scorecards we have described in this chapter. We have observed two other scorecard types frequently used in practice: the stakeholder or constituent score-card and the key performance indicator (KPI) scorecard.
Figure 3-17 Rockwater’s Strategy Map
The stakeholder scorecard identifies the major constituents of the organization—shareholders, customers, and employees—plus, often, other constituents such as suppliers and the community. The scorecard defines their goals for these different constituents, or stakeholders, and develops an appropriate scorecard of measures and targets for them.13 For example, Sears built its initial scorecard around three themes:
Citicorp used a similar structure for its initial scorecard—“a good place to work, to bank, and to invest.” AT&T Corporation developed an elaborate internal measurement system based on financial value added, customer value added, and people value added.
All these companies built their measurements around their three dominant constituents: customers, shareholders, and employees, especially using satisfaction measures for customers and employees, to ensure that each constituent felt well served by the company. In this sense, they were, apparently balanced. Missing from such scorecards, however, was any indication of how these balanced goals were to be achieved. A vision describes a desired outcome; a strategy, however, must describe how the outcome will be achieved and how employees, customers, and shareholders will be made satisfied. Thus a constituent scorecard is not adequate to describe the strategy of an organization and therefore is not an adequate foundation on which to build a management system.
The critical missing element of the constituent card is the identification of drivers that will achieve the goals—an explicit value proposition, innovation that will generate new products and services, customer management processes, a role for technology, and the specific skills and competencies of employees required to implement the strategy. In a well-constructed strategy scorecard, the value proposition in the customer perspective, all the processes in the internal perspective, and the learning and growth perspective components of the scorecard define the how that is as fundamental to the strategy as the outcomes that the strategy is expected to achieve.
Stakeholder scorecards have been used effectively in practice. They often are a first step on the road to a strategy scorecard. As organizations begin to work with stakeholder cards, they inevitably confront the question of how. This leads to the next level of strategic thinking and scorecard design. Both Sears and Citicorp quickly moved beyond their initial constituent scorecards, developing an insightful set of internal process objectives to complete the description of their strategy and, ultimately, achieving a strategy Balanced Scorecard. The stakeholder scorecard can also be useful as a corporate scorecard in which internal synergies across the SBUs are limited. Because each business has a different set of internal drivers, the corporate scorecard need only focus on the desired outcomes for the corporation’s constituencies (including the community and suppliers). Each SBU then defines how it will achieve those goals and articulates these with its business unit strategy scorecards.
KPI scorecards are found most frequently, but not exclusively, in manufacturing and health care organizations, especially those that have been implementing total quality management (TQM). The TQM approach and variants such as the Malcolm Baldrige Award criteria generate many measures to monitor their processes and progress. When migrating to a “Balanced Scorecard,” they build on the base already established by classifying the many existing measurements into the four Balanced Scorecard categories. KPI scorecards can be found when the information technology group, which likes to put the company database at the heart of the program, triggers the scorecard design. KPI scorecards also arise from consulting organizations that like to sell and install large systems, especially so-called executive information systems.
KPI scorecards will be most helpful for departments and teams when a strategic program already exists at a higher level. In this way, the diverse indicators enable individuals and teams to define what they must do well to contribute to higher-level goals. Unless the link to strategy has been clearly thought through, however, the KPI scorecard can be a dangerous illusion.
Only a strategy scorecard, built using the principles articulated in this chapter and embedded in a strategy map, can create a Strategy-Focused Organization.
Balanced Scorecards should not just be collections of financial and nonfinancial measures, organized into three to five perspectives. The best Balanced Scorecards reflect the strategy of the organization. A good test is whether you can understand the strategy by looking only at the scorecard. Many organizations, especially those that created constituent/stakeholder scorecards or KPI scorecards, fail this test.
Strategy scorecards, along with their graphical representation on strategy maps, provide a logical and comprehensive way to describe strategy. They communicate clearly the organization’s desired outcomes and its hypotheses about how these outcomes can be achieved. They enable all organizational units and employees to understand the strategy and identify how they can contribute by becoming aligned to the strategy.
We do not claim to have made a science of strategy. The formulation of strategy is an art, and it will always remain so. The description of strategy, however, should not be an art. If we can describe strategy in a more disciplined way, we increase the likelihood of successful implementation. With a Balanced Scorecard that tells the story of the strategy, we now have a reliable foundation for the design of a management system to create Strategy-Focused Organizations.
1. M. Porter, “What Is Strategy?” Harvard Business Review (November-December 1996): 62.
2. The primacy of the financial perspective applies to profit-seeking organizations. Nonprofit and government organizations typically require a modest rearrangement in the geography of the Balanced Scorecard, a topic we discuss in Chapter 5.
3. See R. Myers, “Metric Wars,” CFO Magazine (October 1996); “Measure for Measure,” CFO Magazine (November 1997); and “Valuing Companies: A Star to Sail By?” The Economist, 2 August 1997, 53-55, for a description and comparison of various value-based metrics being advocated.
4. In practice, the EVA calculation ends up being far more complex than this, involving consideration of the capitalization and amortization of R&D, acquisition, training, and marketing expenses. See G. B. Stewart III, The Quest for Value: The EVA® Management Guide (New York: HarperBusiness, 1991).
5. M. Treacy and F. Wiersema, The Discipline of Market Leaders: Choose Your Customers, Narrow Your Focus, Dominate Your Market (Reading, MA: Addison-Wesley, 1995).
6. Ibid., 35.
7. Ibid., 38.
8. Ibid., 31.
9. An alternative explanation for the mismatch between measures and strategy is that the company is espousing one strategy but implementing a quite different strategy.
10. Porter, “What Is Strategy?” 77.
11. Ibid., 64.
12. Carla O’Dell and C. Jackson Grayson, “Knowledge Transfer: Discover Your Value Proposition,” Strategy and Leadership (March-April 1999): 10-15.
13. See A. A. Atkinson and J. H. Waterhouse, “A Stakeholder Approach to Strategic Performance Measurement,” Sloan Management Review (Spring 1997), for an excellent exposition of stakeholder scorecards.