 C H A P T E R T W E L V EC H A P T E R T W E L V E
ALIGNING STRATEGY TO TARGETS, initiatives, and budgets puts the organization in motion. Performance must then be monitored and guided to close the feedback loop. Beyond monitoring and fine-tuning, however, managers in Strategy-Focused Organizations must determine whether their strategy is still valid. In Chapter 1, we described how the Balanced Scorecard works like a laser to align and focus all organizational resources on implementing the strategy. Like a laser, such coherence can lead to nonlinear performance breakthroughs. But suppose the strategy articulated on the Balanced Scorecard is wrong. In this case, the Balanced Scorecard management system could cause an organization to fail that much faster, as all its energies focus on a losing strategy.
Companies that are stretching for high performance need management processes and systems to verify that their trajectory remains on course to a profitable future. They need feedback so that unprofitable strategies can be identified and corrected before much damage has been done.
The protocols for many management meetings are all too familiar. An executive describes the process previously used at AT&T Canada, Inc.: “Everybody told you what they did last month and what they were going to do next month. It was show-and-tell with no focus.” Operational reviews and discussions of tactical issues dominate the typical meeting. Little time is left for strategic issues.
Strategy-Focused Organizations use a new kind of feedback process. Instead of reporting and control, the Balanced Scorecard focuses the agenda for the management meeting on strategic issues, teamwork, and learning. The meeting is used to manage and improve strategy, not tactics.
Managers need to perform several functions at their strategy meetings: controlling the strategy, testing the strategy, and adapting the strategy. Controlling the strategy, the bottom loop in Figure IV-1, is what most people think of as management control. The metaphor for such management control is a thermostat, responding to differences between actual and targeted temperature and adjusting the heating or air-conditioning unit to bring the outcome back to the desired state. In a management control meeting, managers receive a report on actual performance and variances that compare performance to the budget. People at the meeting attempt to determine a course of action that will get the organization back on track. Through this process, the assumptions about the measure, the target, and the strategy for achieving the target are maintained. The purpose is to detect when initiatives are not being deployed as planned, or to explain why results are falling short of targets.
Such management control meetings in the past focused only on financial measures. The Balanced Scorecard expands this process by having the meetings report and discuss all the measures relevant to the strategy plus the initiatives designed to improve measured performance. Using the scorecard, rather than the budget, as the agenda for the meeting maintains intense focus on the strategy and stimulates managers to devise actions to implement the strategy more effectively.
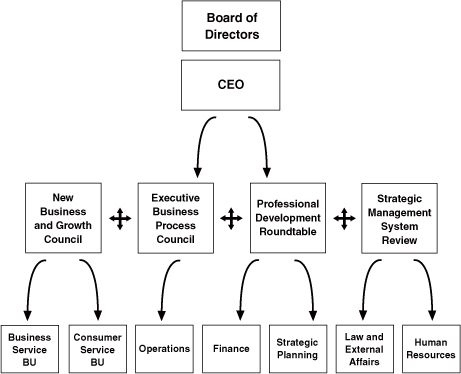
A good example of the new strategic control process occurred at AT&T Canada. CEO Bill Catucci inherited a process in which he met monthly with each head of the seven functional units to review the financial performance of the past month and the forecast for the next month. Once Catucci had the Balanced Scorecard in place, he canceled the seven individual meetings and replaced them with a new set of meetings for the entire executive team (see Figure 12-1). The meetings were organized around four strategic themes linked to the Balanced Scorecard:
Catucci scheduled his Strategic Management meetings to last four hours, on a monthly basis, up to one year in advance. He made attendance compulsory for himself and the eight business unit heads. Catucci emphasized that
Figure 12-1 AT&T Canada Executive Team’s Governance Model
how you conduct the meeting, how you react to the reported numbers, is tremendously important. In the past, the person reporting an unfavorable number was lonely and isolated. Now, I want people to admit to shortfalls and have everyone else respond, “How can we help?” Nothing that happens in this company is the sole responsibility of a single business unit head. If an indicator is in the Red [unfavorable] zone, we identify the people who can influence that indicator and ask them to come to the next meeting with an action plan. This is an entirely new management model for the company. We’re sharing information and working together as a team to improve operations and fix problems.
This monthly meeting soon became so interesting, people started to ask me if they could attend. I could have sold tickets to it.
Catucci used the meetings focused on the Balanced Scorecard to introduce a new culture of teamwork and problem-solving around the strategy. Instead of reviewing and analyzing the past, the team was using data to influence the future in preferred directions. But even the team problem-solving described at AT&T Canada was single-loop control, working within the context of the existing strategy, not questioning or changing the strategy.
Managers also need to determine whether their strategies are valid: Will they deliver the intended performance breakthroughs? They need to engage in double-loop learning that enables the assumptions underlying their strategies to be examined.1 Lee Wilson, chief of staff at Chemical Retail Bank, described the importance of questioning and updating the strategy at the management meetings:
When we started four years ago with the BSC, 80 percent of the time was spent on reviewing financial numbers and 20 percent on the strategy and its implementation. Now, it’s just the reverse. We spend 80 percent of the time talking about our strategy and strategic initiatives, and only 20 percent on the financial results. Our industry is evolving and changing so rapidly, this focus on strategy is essential. If you stand still in financial services today, if you cast your strategy in stone, six months from now it will be out of date with what’s happening in the world.
For the City of Charlotte, City Manager Pam Syfert used the Balanced Scorecard to probe strategically in her periodic meetings with department heads. She asked each head several big questions:
The Balanced Scorecard was the common theme for the discussions on these questions.
People clearly noticed the difference in the meetings Syfert led:
[The previous] city manager would review progress on a major project, like the convention center, to see whether it was on time and on budget. Pam is more strategic. She asks: “Why did we build the convention center? What is its impact on neighborhoods, on economic development, … on employment, on transportation, … on the viability of downtown neighborhoods?”
This is a much broader discussion, requiring the active involvement of people from many departments. The questions are bigger and harder but they are also more fun and more motivating to work on. 2
In addition to using the meetings to engage senior managers in interactive discussions about the strategy, the strategy review meetings should explicitly allow for testing and adapting the strategy. We have seen three processes used to test and update the strategy:
Strategy, as we described in Chapter 3, consists of hypotheses. With the Balanced Scorecard, the hypotheses underlying the strategy are made explicit through the strategy map’s cause-and-effect linkages across the four perspectives. But hypotheses are just assumptions about how the world works; they need to be continually tested for their validity and rejected when evidence accumulates that expected linkages are not occurring. So the first task in strategy adaptation is testing the underlying hypotheses.
Early in the implementation of its Balanced Scorecard, the Rockwater division of Brown & Root Energy Services examined the relationships among its measures and found correlations between employee morale and customer satisfaction, and between customer satisfaction and short collection cycles. Thus the managers could see how employee morale could lead to higher return on capital employed. Also, they saw higher employee morale leading to an increased number of employee suggestions implemented, which in turn led to reductions in waste and rework, lower operating expenses, and higher return on capital ROCE.3
Using data from its hundreds of retail stores, Sears performed extensive statistical analyses to determine patterns of causal linkages among score-card measures.4 The Sears analyst team described the motivation for their statistical analysis:
We wanted to go well beyond the usual balanced scorecard, commonly just a set of untested assumptions, and nail down the drivers of future financial performance with statistical rigor. We wanted to assemble the company’s vast body of interview and research data … and construct a model to show pathways of actual causation all the way from employee attitudes to profits. 5
The Sears strategy model was based on simple causal links between three key constituents (see Figure 12-2):
| Investors | Customers | Employees |
| Compelling Place | Compelling Place to | Compelling Place to |
| to Invest | Shop | Work |
Managers believed that there could be up to a two-quarter lag from improvements in work measures to improvements in financial measures.
Figure 12-2 Testing the Hypotheses at Sears

Using statistical factor analysis, Sears analysts mapped employee responses on up to 180 questions onto 22 underlying factors. For the shopping experience, the analysts mapped data from customer surveys into seven groupings. Four were related to perceptions of the buying experience—people, place, product, and value—and three to the outcome from the buying experience—satisfaction, the match between experience and expectations, and advocacy (Would customers recommend Sears to friends? Would they shop at Sears again?). The financial measures related to growth and to productivity. With the reduction in the dimensionality of the data, the analysts could then perform sophisticated causal modeling, factor analysis, and cluster analysis to identify systematic patterns in the data from 800 Sears stores.
The results proved fascinating and exciting. Sears saw how employee attitudes drove not just customer service but also employee turnover and the likelihood that employees would recommend Sears to family, friends, and customers. The statistical relationships revealed how improvements in training and employees’ understanding of the business translated into higher revenues. For example, the model estimated that a 5-point improvement in employee attitudes led to a 1.3-point improvement in customer satisfaction, which in turn drove a 0.5% improvement in revenue growth. Thus a store with a 5-point improvement in employee attitude, in a district experiencing revenue growth of 4 percent, could actually be expected to have a revenue growth of 4.5 percent—nearly 15 percent higher than the average.
More detailed analysis showed how key drivers differed in their impact on different lines of business within the store. For example, analysts could compare the relative importance of employee measures versus product and place for their impact on customer satisfaction and loyalty. The impact of the factors varied across product lines such as women’s intimate apparel versus large appliances. It also improved the explanatory power of the model, leading to insights about how to achieve double-digit sales productivity improvements in the apparel business. In this way, the statistical model of Sears’s business strategy provided feedback on the business model and strategy. Initiatives and investments could now be targeted to the particular demands for each line of business and each type of store.
Statistical analysis requires considerable data such as can be captured in companies that—like Sears, Chemical Bank, or Mobil—have hundreds or thousands of relatively similar retail outlets. Each month, data on most scorecard measures become available for the sophisticated analysis. Time-series statistical analysis can also be performed but may require at least fifteen to twenty-four months of data before enough observations accumulate to estimate statistically reliable relationships, especially with lagged effects. When sufficient data are available for statistical analysis, managers have a powerful tool to not only confirm (or reject) the validity of their hypothesized relationships, but also to begin estimating quantitatively the magnitude and time-lags of linkages across measures.
Such statistical analysis enables managers to estimate historical relationships among Balanced Scorecard measures and to establish the validity of the causal linkages in the strategy map. The next step is to use the causal relationships to forecast the future trajectory of the strategy. Researchers at the MIT Sloan School of Management built a dynamic simulation model based on the scorecard used at Analog Devices, Inc.6 The model helped to explain why Analog experienced difficulties initially translating dramatic improvements in its the scorecard’s operational measures into improved financial performance.
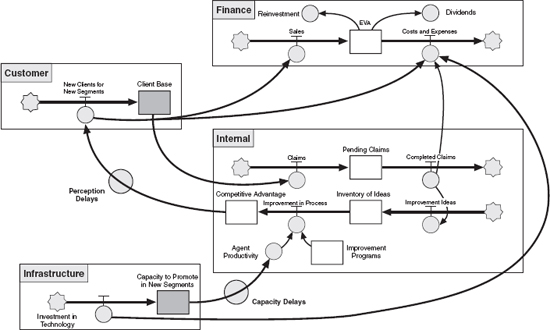
Grupo Bal, a diversified Mexican business group (mining, insurance, retail stores, and financial services) with annual sales of $2.5 billion, built a dynamic simulation model to support its Balanced Scorecard initiative. Grupo Bal had introduced economic value added as a new financial metric in 1994, but the program was not successful because it did not link down to operational activities. Mr. Alberto Baillères, president and chairman of the board, decided to launch a major program of value creation in the group whose first phase was a pilot project in the insurance company to develop a Balanced Scorecard that would represent “a model of the strategy.” The Balanced Scorecard provided the common language for communication about strategies for value creation. The simple Balanced Scorecard strategy maps, however, (see examples in Chapters 3 and 4) did not incorporate feedback loops and delays. So the development team went further to build a “model of the business” using a systems dynamics software language.7
The simulation model was more detailed than the Balanced Scorecard, requiring between 100 and 200 variables, as it had to include many operational variables, not just high-level strategic ones. The model also quantified the magnitudes and delays between changes in a driver variable and associated changes in outcome variables and explicitly incorporated feedback loops across measures and perspectives (see Figure 12-3). The model enabled managers to look several years into the future to see the impact of today’s operations on tomorrow’s results.
The first benefit from the dynamic simulation model came from the constructive dialogues that could now occur between corporate and business unit executives when evaluating the impact of different strategies on the dynamics of the business. It took the emotion out of the discussion by having a formal analytic model as the language of the strategy and its evolution. Managers could understand better the trajectory of value creation from a given strategy, and they could fully evaluate strategic alternatives before committing resources for new investments and initiatives. The CEO saw where he could intervene to help the business unit create more future economic value. An unexpected benefit occurred when a new manager was brought into the business. By working through the simulation, the manager came up to speed in less than a day on the company’s underlying business model.
Figure 12-3 Grupo BAL’s Dynamic Simulation Model
Second, the model made explicit the key operational drivers of value creation. It identified the 20 percent of variables that drove 80 percent of the results. Managers came to understand the implications on feedback and delay among the key operational variables. The simulation model also facilitated an understanding of the interdependencies among strategic resources and the business unit’s strategic objectives.
Third, the model transformed strategic planning from an annual event to an ongoing process. As new contingencies, opportunities, or threats emerged, their impact could be assessed by resetting variables within the simulation model. The process of building the model identified several variables that were key strategic drivers but that had not been measured before.
Sears’s formal statistical model-building and hypothesis-testing and Grupo Bal’s dynamic simulation model provided management teams with new insights about their strategy. Managers still faced the challenge of using these insights to enhance or adapt their strategy.
After managers formulate a strategy, the world can change in ways that undermine the assumptions that were used when the strategy map and Balanced Scorecard were created. Competitors may take unexpected actions, new competitors may emerge with attractive value propositions to targeted customers, a major and highly relevant technological innovation can arise, government regulatory or deregulatory actions can change the competitive playing field, and macroeconomic conditions—interest rates, exchange rates, energy prices, inflation, and recession—can shift. Companies whose growth strategies in 1997 included expansion into Southeast Asia markets would, by October 1997, have had an obsolete strategy owing to the financial meltdown that had just occurred in that part of the world. At least on a quarterly basis, management teams should be assessing the impact of external events to determine whether and how their strategies should be modified.
Some have expressed concern that the Balanced Scorecard may create an internal focus, leading managers to ignore competitors’ performance and actions as well as events in the external environment that could affect the organization. Competitor forces and the external environment enter the formulation of the scorecard already in at least two ways. First, when the initial strategy is formulated, managers typically follow the standard strategic planning methodology of scanning the external environment to assess strengths, weaknesses, opportunities, and threats, and intensively studying competitors and customers. From this external assessment comes the judgments and tradeoffs that define the organization’s strategy, which then gets translated into the scorecard. So the external environment and forces are present at the outset of any scorecard project.
Second, many scorecard measures are calibrated against the competition. The payoff in Mobil’s corporate incentive plan was based on its financial performance as compared with its leading six competitors. The growth measures in the NAM&R Division’s scorecard were benchmarked against industry averages. And the customer measure of market share was, by definition, calculated relative to the division’s competitors. Important metrics in the value proposition—such as price, quality, lead times, and product attributes and functionality—can and should also be measured relative to those of competitors. Internal process measures can be bench-marked against best-in-class. Therefore the second influence of the external environment comes from establishing targets relative to competitor’s performance.
Once strategies and targets have been established, however, the question remains about how the organization stays alert and vigilant to new threats and opportunities. If the organization has been successful in making strategy everyone’s everyday job, it can mobilize the eyes and ears of its hundreds or thousands of employees. With everyone in the organization aware of the strategy, each person can be a scout, detecting when an external event has occurred that can affect the strategy. Software can play a powerful facilitating role. As we discuss later in this chapter, employees often access the Balanced Scorecard through the corporate Intranet. The Balanced Scorecard software should have a feature that enables individuals to send messages and engage in intranet discussions about any of the measures. If an employee learns of a new product introduction, a new hire, or a new initiative by a competitor, then, just like the Mobil truck driver phoning in feedback about bad retail stations to regional headquarters, the employee can post a message to inform others about the new development. In its monthly and quarterly meetings, management will have not only its own information to review and assess, but also the information that has been provided by the entire employee base.
There is no magical system that can capture all the relevant external information that might affect an organization’s strategy. Organizations need to encourage all employees at all levels to participate in generating intelligence, both the positive and negative news, that has the potential for influencing the strategy. The scorecard provides the shared understanding that helps employees filter all of the information they receive each day to determine which events are the most significant for management to contemplate in future strategy meetings. Management meetings must be structured so that inputs on strategic opportunities and threats can come from the entire organization. In this way, strategy truly becomes a continual process.
New strategies often emerge from within the organization. In an award-winning article, management scholar Henry Mintzberg has stressed the importance of such emergent strategies.8 Many successful strategies arise from local initiatives and experimentation. Employees who already have a clear understanding of the existing strategy, because of the communication and alignment processes described in Part Three, may innovate and find new and unexpected ways to achieve high-level strategic objectives or identify variations in the strategy that open up new growth opportunities. Senior management should be encouraging employees to formulate emergent strategies and use their quarterly meetings to assess the viability of local initiatives. Recall Mobil NAM&R’s Speedpass program, a powerful new way to provide customers with a “fast, friendly serve.” Senior managers at Mobil rapidly incorporated this innovation, which had arisen from within the technology organization, into the strategy and the scorecard of the entire division.
National Bank Online Financial Services, as described in Chapter 11, used its Balanced Scorecard to screen initiatives that were continually proposed from within the organization. The scorecard helped managers select initiatives that had the best fit with the strategy. If followed too rigidly, however, this process could stifle emergent strategies from arising. In this case, though, the management team was alert to new possibilities. For example, the team was enthusiastic about one proposed initiative that scored low on the screening procedure. Rather than reject the proposal because it failed on the scoring criteria, the team reflected on what was attractive to them about the proposal. The team concluded that the proposal actually identified a new strategic opportunity that was not currently on their Balanced Scorecard. They not only accepted the initiative but changed a score-card measure to reflect the insights from their discussion. In this way, the management meeting allowed the new initiative to modify the strategy and the scorecard. This is excellent “double-loop” learning—using the management meeting to reflect on the assumptions behind the strategy and being willing to modify the assumptions and the strategy based on an idea that had emerged from within the organization.
As with its facilitating role to encourage employees to report significant external events, Balanced Scorecard software on the corporate intranet facilitates the generation and communication of ideas within the organization. Companies can encourage employees to send e-mail and post proposals about new ways of achieving strategic objectives. Emergent strategies play an important role in allowing strategy to adapt even between formal strategy meetings.
As companies refine and adapt their strategy, the next level of value is created. Organizations find that up to 25 percent of the measures change every year, reflecting the learning that is taking place. The original strategies or the previous measures were not wrong. The evolution was caused by the organization reaching another level of sophistication around its strategy.
Lee Wilson uses the term granularity to describe this learning process. When Chemical Retail Bank introduced its first scorecard in 1994, service quality was a major priority, and the project team developed a sophisticated quality index incorporating about one hundred quality-related events. The quality index, however, included so many items that it lost meaning; it was just a number. People would sit around at the meetings having academic conversation about the measure, but nothing meaningful ever came from it. Finally, Mike Hegarty asked, “What’s under that index?” At the next meeting, the composite was broken down. The number one problem identified by the index was “deposits not posted.” Hegarty exploded: “Deposit not posted? We’re a bank! The whole essence of a bank is trust. If someone gives us their money and we can’t put it in their account, how are they going to trust us?”
Suddenly, the issue of service quality had come alive. The generality of a service-quality index had become tangible and focused on the critical few sources (granularity) of problems. The strategy had been translated to tactics; organization learning had taken place. A new measure on the score-card reflected this learning.
The interplay of strategy, tactics, and learning is a subtle but fundamental process. Learning is not a “big bang.” It takes place in hundreds of ways and in hundreds of places throughout the organization. The actual learning and the subject of the learning would be considered operational or tactical. It is the aggregate of the learning that is strategic. The Balanced Scorecard defines objectives, such as service quality, that are strategic. As the organization attempts to implement the strategic priority, it breaks the big picture into more granular pieces, learns where the leverage is greatest, and creates value. Ultimately, the learning that emerges becomes a strategic asset because it is embedded in linkages that drive high-level strategic objectives.
Again, the experiences at Chemical Retail Bank illustrate this. The initial Balanced Scorecard, introduced in the early 1990s, was designed to consolidate the merger of Chemical Bank and Manufacturers Hanover Trust. Customer retention was a major objective, especially while closing redundant branch offices that would deliver the cost benefits from the merger. An aggregate measure of customer retention appeared on the initial scorecard. As the program evolved, managers realized that not all customer turnover was undesirable. Some existing customers were not profitable or were not the targets of the new strategy. Thus the granularity of the customer retention increased to focus more specifically on retention of targeted, profitable customers. This narrow focus created tremendous learning because the executive team was now able to direct initiatives and evaluate their impact on targeted customers. Over a two-year period, Chemical retained 85 percent to 90 percent of its premerger assets despite closing hundreds of branches throughout the New York metropolitan area. And very few of the lost customers were in targeted segments.
In 1996, Chemical Bank, after its merger with Chase Manhattan Corporation, faced the same issue. This merger led to the closure of twice as many branches, yet the asset retention rate ranged between 95 percent to 100 percent of the balances. Chemical Bank’s Chief of Staff Lee Wilson attributed this success to the learning that had taken place in the earlier merger: “We got tremendous value out of that process. It saved us several billion dollars of balances and added somewhere between 20 and 30 million dollars per year to earnings.”
In Chapter 3 we described Store 24, a convenience-store chain attempting to introduce a new customer-intimacy strategy based on innovative in-store promotions that made shopping fun. Store 24’s motto was “Ban Boredom.” The strategy was introduced in 1998, along with the Balanced Scorecard shown in Figure 3-8. Two years later, CEO Bob Gordon scrapped the Ban Boredom campaign. Overall, financial performance was fine, with same-store sales growing at 4 percent to 6 percent, about the industry average. But customer feedback surveys showed low differentiation of Store 24 from its competitors. As Gordon noted: “Customers’ recognition of the ‘enjoyable experience’ that we sought to create was particularly low. Customers told us that they valued fast service and good selection the most.”
Gordon learned from the Balanced Scorecard measures that, despite acceptable financial performance, the innovative strategy to move from operational excellence to customer intimacy was not working.
It might have worked if we had done a better job of training our staff and had spent more on advertising to create customer awareness. But this is a difficult business in which to develop those kinds of employee skills. I guess we learned that this kind of differentiation strategy may not be realistic in the convenience-store industry.
Store 24 introduced a new customer strategy under the banner, “Cause You Just Can’t Wait.” This strategy focused on three features: fast and efficient (in and out), find what you want (selection), and good stuff (quality). The Balanced Scorecard was updated to reflect this shift. In the financial perspective, the measure “percent sales from new items” replaced “net sales from new concepts,” to reflect the new emphasis on interesting selection. The customer feedback surveys dropped the customer-intimacy measurement of “enjoyable experience.” In its place, a “competitive comparison” measure was added to determine whether Store 24 was succeeding in creating differentiation through its new strategy of speed, quality, and selection. This experience illustrates how the Balanced Scorecard provided a framework for Store 24’s double-loop learning. The company introduced an innovative strategy, tested it in real time, learned what aspects of the strategy were not working, and adapted and modified the strategy based on what it had learned.
How can you make meetings exciting and productive? Walt Disney Company CEO Michael Eisner described an important piece of his management philosophy: “Call meetings on subjects that really matter and show up.”9 This simple yet profound insight captures the essence of the approaches used by Strategy-Focused Organizations. The Balanced Scorecard defines the important topics, and the meeting is an open, team-based learning process led by the senior executive. Chemical Bank’s Wilson described the power of the process this way: “One of the problems in large organizations is that you get to the top by being an expert. Everybody expects you to know everything. Sometimes there are magic moments in meetings when a leader actually learns in front of his subordinates. When this happens, the energy created is dynamite.”10
We can paraphrase Hegarty’s extension to Eisner’s advice: “Call meetings on important topics, show up, be engaged, and show that you are prepared to learn.”
With the Balanced Scorecard, particularly when the information is accessible through a shared information system, the reporting and review of performance is continual, occurring between meetings. The actual meetings become more focused and shorter. Gerry Isom described the CIGNA Property & Casualty experience this way: “With the Balanced Scorecard, we were reviewing performance on a daily basis. We all knew what was going on. The quarterly reviews became shorter because of the simplicity and clarity of what we were trying to accomplish.”
What does this new management meeting look like? In some organizations, the meetings are held less often; quarterly meetings become the norm, although reporting against the scorecard occurs monthly. Because strategic issues change less frequently, the quarterly meeting is adequate for reviewing strategy. The meetings are usually scheduled for half a day. This provides adequate time to review, say, twenty-five measures on three strategic themes. Each measure on the scorecard has an accountable executive. Each of these executives must attend if the meeting is to be productive. The attendees should not be based on the chain of command, but rather on who plays key roles in the strategy. Chemical Bank attendees, in addition to the president, included executive vice presidents, senior VPs, VPs, and assistant VPs. Knowledge replaced rank as a source of power.
An effective management process requires proper staff support. An administrator manages the agenda, handles meeting logistics, assists the reporting process, and coordinates action lists. Chemical Bank had a full-time assistant vice president and half the time of a VP from the Strategic Planning group managing this process. CIGNA Property & Casualty assigned one and a half people at the corporate level and one person in each SBU to coordinate the process. The agenda for these strategy reviews is generally organized around the measures on the scorecard. As experience is gained and reporting systems provide status information on a continuous basis, the agenda tends to become more issue oriented. Every effective meeting ends with an action list.
Often, data for several measures are not yet available after the initial design of the Balanced Scorecard. Some managers react to the missing measures by deferring the startup of management meetings until data on all of the measures are available. This is a bad decision. Our advice here, as suggested by the Nike commercial, is “Just do it.” The primary benefit of a Balanced Scorecard is the focus that it produces. Focus doesn’t always have to be measurable, especially in the early project stages. Every organization has “low hanging fruit” that can be easily harvested in the first pass if the pickers know what they are looking for. Thus simply convening the management meeting and using the topics of the Balanced Scorecard as the agenda create the first wave of benefits.
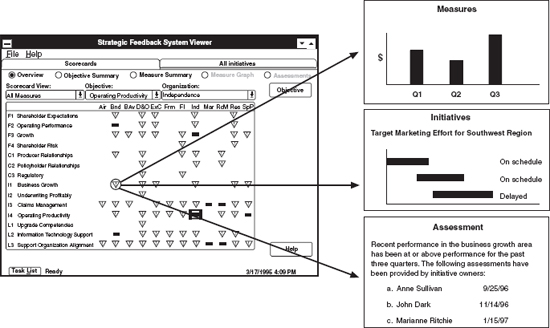
The feedback and reporting system provides the structure around which management meetings work. Most of the discussion about reporting systems focuses on technology: availability of data, graphical interfaces, drill-down capability to detailed data and transactions, data mining, and e-mail links. Little time is spent discussing the cultural aspects of a feedback system. Yet the cultural context for reporting and feedback has far more potential for positive and negative impact than technology. Cultural assumptions, frequently overlooked and often embedded in the technology itself, can either create or inhibit the climate for change. Figure 12-4 shows the summary screen from the CIGNA Property & Casualty Balanced Score-card reporting system. On the left-hand side of the screen, the strategic objectives from the corporate scorecard are listed. Each column represents an SBU (e.g., “D&O” is Directors and Officers Insurance). Each cell in the matrix shows a red-yellow-green indicator of performance. Executives drill down from any indicator to see more detailed screens showing measures, initiatives, and dialog boxes. The following seemingly simple questions, while technically elegant, have complex cultural implications:
 Who can access and use the system?
How should performance be communicated?
Does it create competition or cooperation?
Is this an addition to our existing reporting system?
Traditionally, reporting on strategic performance has been reserved for those at the top of the organization. Many of the benefits achieved at Chemical Retail Bank, for example, came from a reporting system designed only for the executive team. Increasingly, however, Strategy-Focused Organizations are concluding that more open reporting is better. Bill Catucci noted, “Because power is generally held at the top of corporations, information is also restricted to the top. Empowering employees means giving them information to make them powerful.”
Several companies have begun distributing this power by making the performance data from Balanced Scorecards widely available. At CIGNA P&C, 70 percent of the workforce had access to the scorecards of all the company’s SBUs. Lower-level staff saw the same information as division presidents. They could send e-mails to comment on performance. AT&T Canada had a similar program, giving all employees access to the performance data and allowing them to communicate with senior executives. Nationwide Mutual Insurance made its scorecard information available to its nearly 4,000 employees. Reuters America Inc. introduced a similar information-sharing scheme, although it indexed detailed quantity measures when they were considered too sensitive for wide-scale reporting.
Figure 12-4 CIGNA Executive Team’s Enterprise Management Software
Such extensive information sharing must overcome major cultural barriers. CIGNA’s Gerry Isom noted:
If you can’t accept that the CEO of the company will know what’s happening in the unit as quickly as your immediate boss does, then you’re probably not a candidate for the scorecard. But if you are open to communication about what’s going on in your organization, you’ll love a Balanced Scorecard.
Open communication of performance information creates the opportunity for a new kind of infrastructure. It transcends functional and departmental barriers by allowing individuals to have a companywide view. More important, it helps individuals to build their own roadmaps to the knowledge and expertise they need to do their job. By showing who is responsible for what, and by showing performance in all parts of the organization, a “virtual organization” focused on strategic objectives emerges.
Traditional accounting control systems are dominated by a concern for precision. Auditing standards require that financial measures be absolute and objective. Strategic reporting is different. A strategic management system is a communication system, not a control system. We frequently find organizations replacing numeric reporting with performance coded into red-yellow-green indicators. Those with an accounting mindset sometimes have trouble with this. “Who determines red-yellow-green?” “What if they lie?” One cultural shift that takes place with open reporting systems is the integrity of the subjective information. In such an open environment, where everyone sees everyone else’s performance, integrity becomes self-policing. When someone communicates a green status when others know differently, the feedback is rapid. “It’s difficult to lie anymore,” observed one participant.
A greater cultural challenge surrounds the public perceptions of status reporting. Individuals historically have been extremely reluctant to report performance landing in the “red” zone. “Better dead than red,” they believe. As CIGNA’s Gerry Isom noted, “It was a tremendous adjustment for people to report their problems because they knew that everyone in the company that had a computer would see their problems. It took a while for people to be totally objective about reporting performance.”
The way the organization handles this issue tells a lot about the new culture that emerges. As described by AT&T Canada CEO Bill Catucci: “If you’re not meeting your targets, and you get hammered, that sends a certain signal throughout the organization. If, instead, you discuss the problem and ask for the help of your colleagues, different signals are being sent.”
Both Isom and Catucci had a common objective—to create teamwork based on sharing knowledge around shared goals. But they also realized that communication was as much a cultural phenomenon as a technical one. If they were to achieve their teamwork objectives, they had to set the tone for constructive, supportive dialogue, not criticism and micromanagement. For risk-taking and innovation to be encouraged, executives must create a climate that permits shortfalls and problems to be open for discussion and problem-solving. None of these organizations encouraged mediocrity, but they wanted people to report problems without fearing this would be a career-ending move. Public disclosure of a problem or shortfall launched a process to solve the problem.
In complex organizations, few strategic issues can be addressed alone. The red-yellow-green report on strategic indicators provides an early warning system to direct team problem-solving. People may initially be uncomfortable reporting on problems within their own area of responsibility. But, as described on a wall poster behind the desk of a military leader: The only thing worse than bad news is bad news late.
Humans are competitive beasts. Those who excel want to retain the advantages that they have. Open reporting systems make information available to all. The approaches used by the top-performing claims department at CIGNA Property & Casualty became visible to all other claims departments. The approaches used by leaders in plant safety at Mobil NAM&R were visible to all other plants. At one level, people take pride in being seen as the leader by their peers. At another level, people may wish to hold their approaches confidential so that their advantage can be retained. Companies need to break through such constraints. Large organizations can gain advantage from their scale by identifying and sharing their large information base of knowledge and experiences. For this to occur, however, they must promote a culture of information sharing. Open reporting around the Balanced Scorecard helps facilitate this cultural change. The scorecard identifies those with common objectives and roles. It points the way to a networked organization in which individuals can become linked together by their competencies instead of by their departmental or functional organization. The open reporting breaks down the barriers of selfishness. Incentive compensation systems based on team scorecard performance further reduce these barriers.
Does the Balanced Scorecard add more reporting? The answer is no, if the organization can reduce its reliance on traditional reports. J. P. Morgan & Co. Incorporated’s IT Division formed an alliance with several vendors to manage its outsourced operations. Prior to establishing the alliance, J. P. Morgan had been measuring, in its global operations, more than 1,100 metrics. But only about 60 of these related to measures used in higher-level strategic reports. The scorecard with alliance partners enabled the company to focus on the data and information requirements for only 18 high-level measures. The focus on strategic reporting reduced the time required for measuring and reporting IT performance from 45 staff years to 12 staff years (a 75 percent improvement) and the goal was to make another 50 percent improvement in the near term. So the adoption of the Balanced Score-card did not add another layer of reporting costs and complexity. It actually greatly simplified and lowered the cost of performance reporting.
Many organizations report similar experiences. Even though the Balanced Scorecard is a new reporting and information system, they now produce fewer reports and spend considerably less of their resources in collecting and reporting data. The City of Charlotte’s traditional MBO system had been reporting nearly 1,000 measures. The scorecard measures were much fewer in number and much more meaningful to the frontline people and senior-level city administrators. Most organizations indicate that the scorecard enabled them to trash many of their reports that had accumulated over the years—reports to which no one was paying attention.
The elimination of traditional reports, however, can present another cultural barrier. At CIGNA P&C, once the Balanced Scorecard system had been installed, CEO Isom mandated that all previous reports be eliminated. You would expect this decision to be greeted enthusiastically. To the contrary, it was resisted. “I had to literally tell people, ‘I will not read your reports. I will read what you put in the computer each month within your Balanced Scorecard format. But I will not read written documents coming to me.’”
So the simple process of installing an information reporting system is fraught with cultural traps, but it is also loaded with cultural opportunities. Executives who avoid the traps and capitalize on the opportunities can establish a new performance-centered climate. An organization that shares information with employees generates new strategic opportunities from its front lines. It can respond quickly to competitive changes. An organization with integrity in its reporting will encourage risk-taking in a team environment. An organization with open communication will share and amplify strategic knowledge and competencies. And, finally, the organization will have developed a common language and agenda that promote teamwork for all.
When we began working with organizations on their Balanced Scorecard programs in the early 1990s, no off-the-shelf software products existed. Each organization had to develop its own method for acquiring and reporting scorecard information. CIGNA Property & Casualty started with a paper report. The first edition of this report had one page for each measure and one book for each of the twenty-one SBUs, leading to a monthly three-inch pile of paper on Gerry Isom’s desk. He said, “Get this on a computer.” Chemical’s Retail Bank, a large but single SBU, maintained a paper-based system for more than a year. Each page of the report was supported by an information system of some type, but it required an assistant vice president to consolidate the information with a manual process. Mobil NAM&R required that each SBU develop a Microsoft Excel spreadsheet to report its Balanced Scorecard. Despite these technologically challenged solutions, each organization accomplished dramatic breakthroughs in performance with its Balanced Scorecard program. So sophisticated technology is not necessary for a successful implementation.
Once the new performance management system has been launched, information technology can unleash new dimensions of value that cannot be created in any other way. A simple low-tech system can support an executive team at the top of the organization. But to move the scorecard from the boardroom to the backroom, companies need more advanced information technology. CIGNA Property & Casualty moved quickly to developing a sophisticated computer system (Figure 12-4). While the initial goal of the new system was more efficient reporting to the executive teams (and reducing the height of paper on Gerry Isom’s desk), the new system opened up the possibility of sharing the information with all employees. Open reporting would not have been possible without the system and its enabling network. Cascading the scorecard to function, department, team, and individuals is possible without technology, but an information system allows the scorecards and the organizations to be linked so that synergies can be achieved. We talked earlier of Chemical Bank’s lessons about granularity and its impact on strategic learning. Technology enables Balanced Scorecard measures to be linked with more detailed data and transactions. The bank built a customer database that allowed it to measure customer satisfaction and retention by location and by customer segment. As reported earlier, the granular approach was instrumental for much of the bank’s strategy. It could not have been accomplished without technology.
Many organizations are now capturing transaction data, operational data, and customer and supplier data in their enterprise resource planning (ERP) systems and making them available in their data warehouses. Companies with such ERP capabilities can link their Balanced Scorecards to their transactional databases, enabling automatic and continual updating of many scorecard measures. They can also link their Balanced Scorecard to their other analytic applications, such as activity-based costing, shareholder value, and customer relationship management. The scorecard strategy map becomes the top-level performance model, integrating across ABC/ABM, EVA, and CRM measurement systems.
The Balanced Scorecard initially clarifies and communicates the organization’s strategy. It starts to influence strategy by aligning business units, shared service units, and individuals to execute according to the formulated strategy, and by allocating resources—capital funds, discretionary spending, people, and technology—to new initiatives required to implement that strategy. Management needs opportunities, however, to measure progress on how well the strategy is being implemented and how well the strategy seems to be working.
Management meetings provide a forum for executives to work together in teams to identify problems, assess changes in the operating and strategic environment, and consider new opportunities that may have arisen since the strategy was formulated. The Balanced Scorecard becomes the agenda for such management meetings, enabling participants to work outside of their functional and departmental boundaries to solve problems affecting the entire organization. The meetings promote teamwork and organizational learning. Some have even reported that the meetings are fun to attend.
By giving employees continual access to the Balanced Scorecard, the organization greatly amplifies its problem-identification, problem-solving, opportunity-creating, and knowledge-sharing capabilities. It enlists the hearts and minds of all its employees, not just the chosen few at the top. Recent advances in information technology enable the performance data to be collected and shared at much lower cost and with greater linkages, visibility, and ease of understanding and use. Simple color-coding schemes, such as green-yellow-red, replace rows, columns, and pages of eight-digit numbers that only engineers and accountants could previously interpret. The feedback and review of strategic information helps to maintain enthusiasm about the strategic journey and to guide the organization to ever-higher levels of performance.
1. The importance of distinguishing between single-loop and double-loop control is due to Chris Argyris; see Chris Argyris, Reasoning, Learning, and Action (San Francisco: Jossey-Bass, 1982), and “Teaching Smart People How to Learn,” Harvard Business Review (May-June 1991): 99-109.
2. R. S. Kaplan, “City of Charlotte (A),” 9-199-036 (Boston: Harvard Business School, 1998), 9.
3. This example was described in Robert S. Kaplan and David P. Norton, The Balanced Scorecard: Translating Strategy into Action (Boston: Harvard Business School Press, 1996), 255-56.
4. A. J. Rucci, S. P. Kirn, and R. T. Quinn, “The Employee-Customer-Profit Chain at Sears,” Harvard Business Review (January-February 1998): 82-97; see also S. P. Kirn, “Statistically Validating the Linkage between Employee Satisfaction, Customer Satisfaction, and Business Performance” (paper presented at the Second Annual Balanced Scorecard Summit, San Francisco, 12-15 October 1999).
5. Rucci, Kirn, and Quinn, “The Employee-Customer-Profit Chain at Sears,” 89.
6. J. D. Sterman, N. Repenning, and F. Kofman, “Unanticipated Side Effects of Successful Quality Improvement Programs: Exploring a Paradox of Organizational Improvement,” Management Science 4, no. 2 (1997): 503-21.
7. The simulation language, ithink, developed by High Performance Systems, Inc., is also the foundation for Balancing the Corporate Scorecard, a simulation produced by Harvard Business School Publishing.
8. H. Mintzberg, “Crafting Strategy,” Harvard Business Review (July-August 1987): 66-75.
9. M. D. Eisner, Letter From The Chairman, The Walt Disney Annual Report, 1995.
10. L. Wilson, “The Management Meeting: Putting Strategy on the Table” (paper presented at the Balanced Scorecard Collaborative Best Practice Conference, Cambridge, MA, 15-16 December 1999).