
 C H A P T E R S E V E N
 C H A P T E R S E V E N
CHAPTER 6 REPORTED HOW COMPANIES and public sector organizations have used the Balanced Scorecard to align and integrate their decentralized business units. Beyond aligning the business units that sell products and services to external customers, organizations can create synergies by aligning their internal units that provide shared services (once known as “corporate staff”). Shared service units are created at a corporate or division level because of economies of scale and the advantages of specialization and differentiation that these units can create. For example, a corporate role to “create economies of scale in the use of information technology,” may require a central IT group to create these economies. If a corporate role is to “create a common brand and a common shopping experience” for the customer, a central marketing group can facilitate these objectives. Companies that want to leverage innovation may establish a single R&D division to supply new product and process technologies to its individual operating groups. Other examples of centralized provided goods and services include purchasing, manufacturing, real estate, distribution, and maintenance.
The challenge, of course, is for the centrally supplied service to be responsive to the strategies and needs of the business units it purports to serve. In practice, the shared service group, while established to provide benefits from economies of scale and specialization, frequently ends up becoming bureaucratic, unresponsive, and inflexible and doesn’t deliver the desired economic benefits to operating divisions. We described earlier the failure in a European bank when the strategy of its IT group was not linked to the strategy of an important business unit. Creating a Balanced Score-card for shared service units should align the strategies of these units so that they add value and are responsive to the strategies and needs of the business units they serve.
Most staff groups and support functions can be subjected to the “yellow pages” test.1 Corporate managers can look in the Yellow Pages of the phone book and find independent companies that supply virtually all of the services currently provided by internal shared service departments. For an internal support group to be maintained within an organization, it should either supply the service internally at a lower price than what could be acquired from an external supplier, or it should offer a differentiated value proposition that is superior to that from an external vendor. Most support functions, however, do not have an explicit strategy—operational excellence, product leadership, customer intimacy—that demonstrates how they create competitive advantage for their parent corporation.
When shared service units cannot outperform external competitors, companies should outsource these functions. When outsourcing, companies can contract with their suppliers using a Balanced Scorecard rather than with just financial measures. This enables them to get the value and service levels they desire, not just a low price.
The Balanced Scorecard has been used in numerous ways to help link and align shared service units with business units and with the corporate strategy. In an ideal world, there would exist a top-down strategic architecture that defines the corporate role and how shared service units contribute to the corporate strategy. Often, however, such a strategic architecture will not exist. In the absence of an overall corporate scorecard program, shared service units will use the Balanced Scorecard in a somewhat different manner. In this chapter, we present the two models for developing shared service scorecards:
Successful Balanced Scorecard companies typically first develop score-cards for SBUs that sell products and services directly to external customers. Subsequently, they develop scorecards for their shared service units (SSUs). This sequence is preferable because it allows the strategy for the business units that create value external to the company to be clearly articulated and understood. Once the SBU scorecards have been developed, the SSUs can develop strategies and scorecards for their customers—the market-facing business units. The SSU strategy can thereby deliver the value proposition that provides the greatest benefit to the SBUs.
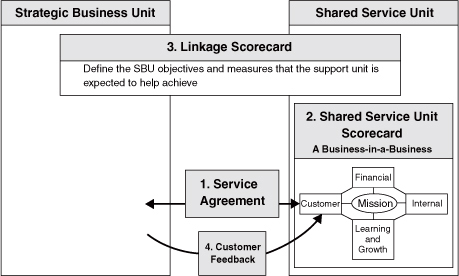
Creating the linkage from SBUs to SSUs requires four components (see Figure 7-1):
Figure 7-1 Creating Support Unit Linkage
Various elements of this approach are illustrated by the following case studies.
In Chapter 2, we described how Mobil North America Marketing and Refining (NAM&R) had its fourteen shared service units develop Balanced Scorecards after the division and eighteen business units had defined their strategies and scorecards. These scorecards were based on a service agreement between each shared service unit and a buyer’s committee representing the business units. In developing scorecards for its shared service units, Mobil used a two-tier approach. We illustrate the approach with the process used by Mobil’s Channel Management Group, the SSU that developed marketing and training programs used with dealers.
The Channel Management Group provided consulting services, programs, and support tools to help the dealers manage their businesses, consistent with Mobil’s strategy. The two-tiered scorecard used by the group is shown in Figure 7-2. The lower tier of the scorecard identifies the strategies and measures for the group. The financial objective focused on operating efficiencies. A budget for the work of each shared service unit had been negotiated as part of the service agreement and the financial objectives related to becoming more efficient to meet the budgeted targets. For the customer perspective, the service unit designed and administered a survey to its customers—the geographic business units—to measure their satisfaction with the delivered services. The survey assessed whether the service unit was delivering the level and quality of services specified in the service agreement. The shared service unit then developed objectives, measures, targets, and initiatives for its internal process and learning and growth perspectives. These objectives were established for the service unit to achieve the customers’ expectations within the cost constraints of the budget.2 This part of the scorecard development was relatively standard for a shared service unit.
Figure 7-2 Mobil Channel Management Group’s Two-Tier Scorecard
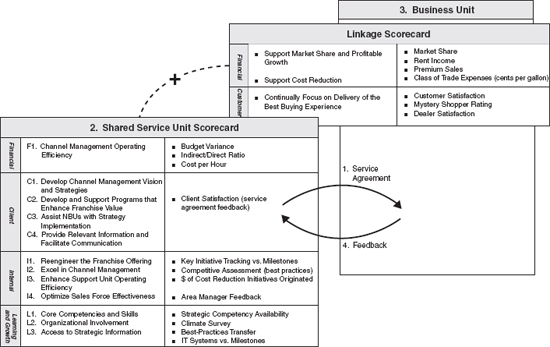
The novel aspect of the service unit’s scorecard was the incorporation of a top-tier component, or “linkage scorecard,” as it was called at Mobil. The linkage scorecard consisted of several measures from the financial and customer perspectives of the business unit scorecard. The linkage scorecard gave employees in the SSUs some responsibility for the needs of external customers and shareholders. An SSU chose measures for its linkage score-card by identifying those financial and customer outcomes on the divisional scorecard that it had the greatest opportunity to influence. For example, the Channel Management Group included, in its linkage score-card, a financial measure of premium gasoline sales volume, along with customer measures of the mystery shopper rating, dealer satisfaction, and consumer satisfaction. These measures expanded the thinking of employees in the SSUs beyond just serving internal business groups. They had to consider how to make a difference to the division’s overall financial outcomes and to the division’s external customers. The external focus helped to transform the service units from captive internal suppliers to strategic partners with the business units and division.
The Mobil “strategic partners” made one other change on their Balanced Scorecards—a seemingly minor one but actually quite symbolic of their value to the organization. The units were uncomfortable with using the word customer for their SSU scorecard. They felt that referring to their business units as customers put them in a subservient relationship to them; symbolizing that they had to supply whatever the business units asked for. The service units believed that a principal rationale for having SSUs in the division, rather than as a separate function within each geographic business unit, was that their scale of operations enabled them to create superior expertise and professionalism. They preferred to think of the business units as their clients, coming to them for advice, expertise, and differentiated service capabilities. So they renamed their “customer perspective” their “client perspective.”
Each of Mobil NAM&R’s fourteen business units updated their score-cards each year after renegotiating the service agreement with its buyer’s committee.
The Shell Services International (SSI) division of the Royal Dutch/Shell Group of Companies provides services to Shell operating companies and external customers around the world.3 In 1999, SSI had more than 5,000 employees, and annual revenues exceeding $1 billion. Shell established the division in 1995 as part of an initiative to improve focus on core capabilities. Routine noncore activities—such as landscaping, mail, courier services, telecommunications, and office supplies—had already been outsourced to low-cost, focused external vendors. SSI managed the interface between these external vendors and the business units. Its main role, however, was to supply nonroutine services that were outside the core value-adding activities of the business units. The services were in four broad areas:
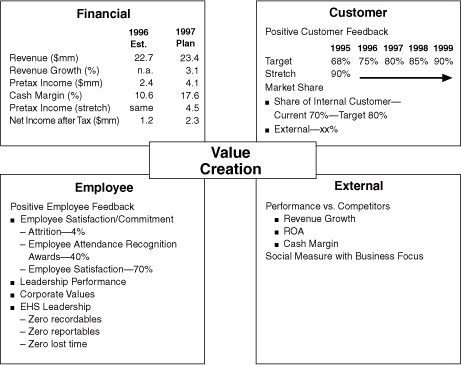
By mid-1999, SSI was delivering 6,000 different products or services to more than 3,000 individual customers, most within Shell but to some external customers as well. The units of SSI each had a Balanced Scorecard to define their strategic priorities (see Figure 7-3).
The linkage between any service provider in SSI and a customer was accomplished with a Service Level Agreement (SLA). Shared services had existed in Shell since 1985, and their operating costs had already been cut by 50 percent. The goal of SSI had to be broader than low-cost delivery. The SLA established a clear understanding between the internal customer and the service provider. With so many products and customers, SSI could not just offer a single level of service; some business units wanted “gold-plated” services, whereas others wanted the “nickel-plated” variety. Each customer evaluated the cost/value tradeoffs in the service and selected the service requirement to fit its business needs. The service provider, in turn, committed to enhancing its capacity to supply and deliver the desired services at agreed levels of cost and functionality. The providers would also strive to continuously improve their cost and service quality.
Measurements played a key role in implementing the SLA system. SSI developed unit-level costs for all of its products and services. These unit costs could be cost per transaction for repetitive activities, or a cost per hour for engineering and consultative activities. In addition to cost, however, the SLA included a Balanced Scorecard of performance measures relating to the following:
Figure 7-3 Shell Services International’s Balanced Scorecard
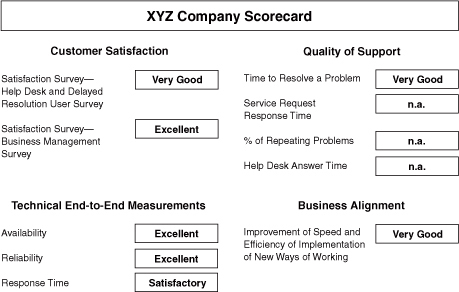
A sample of the SLA scorecard feedback is shown in Figure 7-4.
With its accompanying measures, the SLA committed the SSI unit to deliver the agreed-upon level of service at the least cost to the customer. The SSI unit could use the metrics in the SLA to construct its own Balanced Scorecard for measuring and motivating its performance. As a senior SSI manager reported, “The service-level agreements changed the mindset in discussions between customers and service providers from cost, cost, and cost to how to develop and improve internal capabilities to help customers in their value creation activities.”
Figure 7-4 A Web-Based Service Level Agreement Scorecard
The Department of Energy Procurement (DOEP) Balanced Scorecard effort started with a new vision for the function: “To deliver on a timely basis the best value product or service to our customers while maintaining the public’s trust and fulfilling public policy objectives.”
Even this simple statement—stressing timely delivery—was a major departure. In the past, when purchasing only had to follow rules, it didn’t have to worry about when the procurement function had been accomplished. Stephen Mournighan, director of management systems, described the cultural change required:
Prior to 1993, the only two performance measures for procurement were “Did you spend the money authorized?” and “Did you follow the rules?” The new vision required us to change the culture so that we could establish and maintain a customer focus, a sense of urgency, continuous and breakthrough process improvement, and an emphasis on results.
The Balanced Scorecard played a critical role in facilitating the major cultural change that would make the procurement function far more responsive to customers—to shift the focus from compliance to customer-based results.
Like other government and nonprofit organizations, the DOEP placed the customer perspective at the top of its Balanced Scorecard hierarchy (see Figure 7-5). Customer satisfaction was measured by a newly designed survey that asked customers to rate timeliness—of procurement processing, planning activities, and ongoing communication—and quality of the goods and services delivered. DOEP management used the results of this measure for internal benchmarking across all their field offices. They matched a high-performing office with one that scored low, so that learning and best-practice sharing could occur. This facilitated an environment of continual learning. The second customer objective—creating effective service partnerships—also was measured by survey questions relating to the procurement office’s responsiveness to and cooperation with the customer.
Figure 7-5 Department of Energy Procurement’s Balanced Scorecard
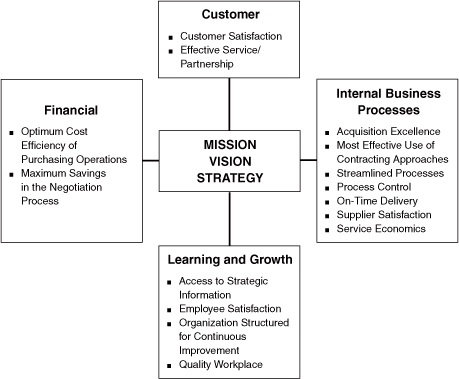
The internal perspective communicated a major change in the way that purchasing was conducted. Previously, the rules-driven function required that even minor purchases have several forms and up to five signatures before an authorization to buy could be issued. For the objective most effective use of contracting approaches, the department authorized office managers to use a Visa credit card for purchases under $25,000. The measures for this objective were percentage of purchase card transactions under $25,000, as well as the percentage of these transactions made by a line manager, not a procurement manager. Within a couple of years, 85 percent of allowable purchases were made with the credit card, and an office manager, not a purchasing manager, made 84 percent of these. This improvement eliminated a huge amount of paperwork and delay in the system. Another measure for this objective was percentage of purchase and delivery orders made electronically.
For the streamlined process internal process objective, the DOEP measured the lead time from receipt of a request for a major contract to actual award. In 1987, the average lead time had been 287 days. In 1998, the DOEP reduced the lead time by about 50 percent, to 147 days. For standard contracts, the new processes reduced lead time to 15 days. These dramatic improvements required an enormous cultural shift in the procurement function. All employees were now focused on finding innovative ways to be more responsive for their customers.
In the learning and growth perspective, the DOEP initiated surveys to assess employee satisfaction with the new environment. The DOEP’s new strategy asked people to operate with new rules and new measures. The surveys provided feedback about whether employees felt they were getting adequate training for the new mission and had new contracting and purchasing tools that enabled them to meet the stretch performance targets and access to appropriate data and information.
The primary financial measure was the cost-to-spend ratio, the cost of acquiring $1 of services. The procurement function had never before measured how much its activities cost. The DOEP benchmarked leading companies in the aerospace industry and found that the best procurement groups had costs of 2 percent to 3 percent of purchases. In the first year of operating with the Balanced Scorecard measurement system, the DOEP beat this target by achieving a cost-to-spend ratio of 1.8 percent. This financial improvement came through a large reduction in the number of people in the procurement function—possibly because of the operating efficiencies discussed earlier—and with significant improvements in customer service. This experience reinforced the message of the benefits from the Balanced Scorecard management system: Organizations can cut costs, become more productive, and deliver superior customer service at the same time.
With the success of the program internally, the DOEP extended its approach to private sector contractors that operated various DOE facilities—the University of California; AlliedSignal, Inc.; Lockheed Martin Corporation; Fluor Daniels, Inc.. It asked the major contractors to develop Balanced Scorecards for their procurement function, both to assess their own performance and to communicate with the DOEP on their progress.
As with the private sector examples, the Balanced Scorecard helped government service units become more productive, more responsive to customer needs, and a more effective partner in helping the line organization achieve its strategic objectives. The benefits were achieved without any linkages to compensation, which were not possible under federal government rules. The employees in the government agency liked the new strategy. Their jobs were now more interesting, they had more responsibility, and they had more challenges and opportunities for their initiative. The new approach created strong intrinsic motivation, and the reinforcement from financial incentives (extrinsic motivation) was not necessary to change behavior.
Balanced Scorecards for SSUs are also occurring in higher education. The business support division of the University of California, San Diego (UCSD), won a 1999 Rochester Institute of Technology/USA Today Quality Cup for Education for its application of the Balanced Scorecard. Under the leadership of Vice Chancellor Steven Relyea, each of the 27 support units built Balanced Scorecards reflecting customer service and efficiency objectives.4 Each business unit set targets for improvement and established an action plan aimed at attaining the targets.
For the customer perspective, an outside research organization visited the campus each year to conduct a survey among students, faculty, and administrators to assess the quality of campus services delivered by the business support units. Since the Balanced Scorecard was implemented at UCSD, customer satisfaction ratings have increased dramatically. Among the customer and financial improvements noted were the following:
 The payroll department reduced error rates by 80 percent. Travel reimbursement time was reduced from six weeks to three
days.
 The custodial department reduced custodial cleaning expenses from $0.94 to $0.84 per square foot. With more than 5.6 million
square feet of facilities, the annual savings from this improvement alone exceed $560,000.
 The human resources group cut the cost per new hire from $388 to about $200, while other California universities were seeing
costs increase to nearly $900.
 Student housing costs were reduced $900,000 within two years and exceeded the five-year goal of $1 million savings during
the third year of implementation.
The scorecard and customer feedback helped the units to focus on improving critical processes. In the human resources department, hiring costs were slashed through use of new electronic and Web-based technology and cross-functional team efforts. The dramatic improvements in custodial expenses were achieved by delegating responsibility to the people doing the work. Assistant Vice Chancellor Jack Hug said, “The people themselves have taken charge—recognizing what they are doing and how it impacts the bottom line. Our people are challenged to cover more space and cover it better.” Relyea believes that “the constituents of higher education will, and should, demand this type of accountability out of institutions in the future.”
Many functional organizations such as information technology, human resources, finance, marketing, and R&D have developed Balanced Scorecard programs to manage their organizations without a broader corporate program. The scorecard enabled executives of these functional units to build a professional management approach that can motivate their organizations to be customer-focused and competitive. The “functional excellence” that this promoted for the organization offset some of the lost benefits and potential suboptimization created when a Balanced Score-card is being built for a functional unit without explicit linkages to SBUs and corporate scorecards.
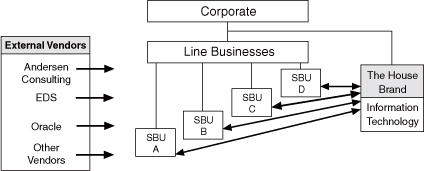
The functional scorecard should view itself as a “business-in-a-business”—in effect to compete on the Yellow Pages test. Figure 7-6 illustrates this perspective, using IT as an example. The IT organization views the SBUs as customers. It develops a professional interface with the SBU similar to approaches that external vendors would take. The IT unit is the “house brand.” It has certain advantages through internal knowledge and relationships, but it still must develop a market-based relationship. In turn, the SBU bears responsibility for integrating IT into its business strategy.
FINCO IT was the centralized IT organization of a global, multidivisional, financial services organization. The corporation centralized the IT group in the 1980s to obtain scale economies with hardware and people, to develop a common communications infrastructure, and to enhance product-line integration to common customers.
Figure 7-6 The Support Function as a Business-in-a-Business
FINCO IT used the Balanced Scorecard framework to translate its vision into a more detailed strategic agenda (see Figure 7-7). With this agenda as the starting point, the management team met in a two-day workshop to develop the strategy map shown in Figure 7-8. The strategy map was designed from the IT group perspective. It would later serve as a template to be cascaded to the different departments within IT. The financial objectives attempted to balance efficiency and effectiveness. The cost productivity objective required each department to benchmark its unit costs against various external reference points (such as external vendors) to ensure that FINCO IT was competitive on cost. Strategic spending was linked to highlevel measures of business return; it was separated from spending on operations and maintenance activities.
The client value proposition was divided into two components. The basic objectives defined the outcomes that internal clients expected—reliability and quality at a reasonable cost. The differentiators reflected a customer intimacy strategy to partner with the internal clients by providing knowledgeable people who could create innovative business solutions. The overarching goal was to create a long-term partnership between the IT and internal clients. Clients would provide survey feedback to measure progress toward these goals.
The internal process themes reflected the organization value chain:
 Understand customer needs
 Create and develop innovative solutions
 Provide infrastructure
 Manage technical and operating risk
 Service the client
The learning and growth strategy focused on key staff development, empowerment of employees, teamwork at the executive level, and an aligned goal system.
Clearly, FINCO’S development of a scorecard for its IT group used the same underlying structure as we used elsewhere. The financial level of the scorecard is the only component that is not fully analogous to a true business, because the financial objectives of the functional unit do not stand alone. In many respects, the financial layer of the strategy is similar to that of a nonprofit or government organization (see Chapter 5). The organization must be efficient in its use of resources, but its higher-order goal is to create benefits for customers.
Figure 7-7 FINCO IT’s Vision and Strategic Agenda
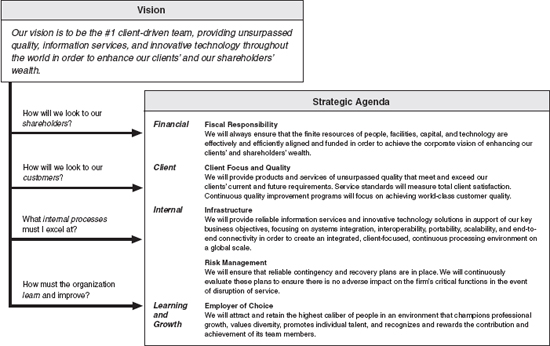
Figure 7-8 FINCO IT’s Strategy Map
Linkages between organizational units also arise when integration occurs across corporate boundaries—for suppliers, customers, outsourced services, and joint ventures. Companies such as J. P. Morgan Information Services and Caltex Petroleum Corporation—a joint venture between Texaco, Inc., and Chevron Corporation—have implemented Balanced Scorecards to define the performance model for the relationship. This enabled them to define how outsourced services and joint ventures could create new value, not just lower costs. No new principles were involved to develop score-cards for these external relationships. The external linkages had the same structure and served the same purposes as the linkages within the organization already described in this chapter.
Balanced Scorecards for internal SSUs identify and articulate the opportunities for integration and synergy. They communicate how these organizations create value for the corporation and its divisions and business units. Scorecards should be constructed after a formal service agreement has been negotiated between the service unit and line operating business units. The service agreement and the SSU Balanced Scorecard should accomplish the following:
 Align the efforts of the unit to the priorities of its customers (primarily internal customers, although some service units
may have the right to sell services to external customers as well)
 Provide a basis of accountability between the unit and its customers
 Track the progress in the performance of the unit
 Build a culture of customer-based performance and continuous improvement within the unit
The scorecard provides the measurements and the management system for aligning SSUs to the organization’s strategic objectives.
While, ideally, strategy and scorecards should start at the top and then ripple down to local operating units and SSUs, often the motivation and commitment for the Balanced Scorecard management system can arise within a support unit. In this case, the unit can adopt a business-in-a-business model and develop a scorecard that reflects its estimated strategic role within the larger organization. Scorecards for external partners, such as joint ventures and outsourcing vendors, can be developed to define how value will be created with the external partnership.
1. We first learned of this valuable test from Skip Stitt, who applied it in the City of Indianapolis’s new approach for putting city services up for competitive bids with the private sector. Mayor Stephen Goldsmith realized that private sector counterparts existed for most city-supplied services (other than public safety services). See R. S. Kaplan, “Indianapolis: Activity-Based Costing of City Services (A),” 9-196-115 (Boston: Harvard Business School, 1996) and R. S. Kaplan, “Indianapolis: Activity-Based Costing of City Services (B),” 9-196-117 (Boston: Harvard Business School, 1996).
2. For details of this process for the Gasoline Marketing SSU, see R. S. Kaplan, “Mobil USM&R (D),” 9-197-028 (Boston: Harvard Business School, 1996).
3. Experience drawn from Dennis R. Wymore, “Beyond Cost Reduction: Using the Scorecard to Transform Shared Services into a Competitive Partner” (paper presented at the Balanced Scorecard Collaborative Best Practice Conference, Linking Scorecards to Create Organizational Alignment, Cambridge, MA, 12-13 April 1999).
4. Information on their application can be found on http://www.vcba.ucsd.edu/performance/cssemp.htm. See also “Balanced Scorecard Analyzes Performance in Businesslike Way,” HR on Campus (LRP Publications, October 1999), and “Measuring Efficiency Responds to Customers, Impacts Employees,” HR on Campus (LRP Publications, November 1999).