 C H A P T E R N I N EC H A P T E R N I N E
FOR STRATEGY TO BECOME TRULY MEANINGFUL to employees, personal goals and objectives must be aligned with the organizational objectives. Setting objectives for individuals, of course, is not new. Management by objectives (MBO) has been around for decades.1 But MBO is distinctly different from the strategic alignment achievable with the Balanced Scorecard. First, the objectives in an MBO system are established within the structure of the individual’s organizational unit, reinforcing narrow, functional thinking. Second, the objectives are established relative to departmental goals, which, without a Balanced Scorecard strategic management system, are short-term, tactical, and financial. In effect, MBO reflects the traditional approach to job definition, whereby people are asked to do their existing jobs better.
The Balanced Scorecard, in contrast, provides individuals with a broad understanding of company and business unit strategy. It explicates where they fit in their organizations’ strategy maps and how they can contribute to strategic objectives. Individual objectives established within the framework of the Balanced Scorecard should be cross-functional, longer-term, and strategic.
The City of Charlotte, described in Chapter 5, had a long history of performance measurement, having instituted an MBO program in 1972. Over the years, however, the MBO process had become burdensome and bureaucratic. City staff measured everything—workload, response time, cost per unit, and number of inspections. The MBO system led to an information overload, with 800 to 900 measures reported each year and lengthy reports that few people read. Pam Syfert, Charlotte city manager, described the city’s dissatisfaction with its MBO process:
The city’s management by objectives process served the organization well over the years and helped staff to track performance against targets. However, it did not reflect the ‘90s emphasis on strategic goals, mission-driven government, and rapid change. Our measurement system focused our attention backward, not forward. It was an audit tool, not a planning tool, and therefore did not relate to the city’s vision, mission, or goals. 2
Our research has shown that Charlotte’s experience was not an aberration. Human resources systems, designed to provide clear objectives for employees, do not typically align to strategy:
 Only 51 percent of senior managers in the United States (and even fewer, 31 percent, in the United Kingdom) had their personal
goals linked to strategy.
Only 51 percent of senior managers in the United States (and even fewer, 31 percent, in the United Kingdom) had their personal
goals linked to strategy.
Only 21 percent of U.S. middle managers (and 10 percent in the United Kingdom) had their personal goals linked to strategy.
Only 7 percent of U.S. line employees (and 3 percent in the United Kingdom) had their personal goals linked to strategy.
Strategy-Focused Organizations, in contrast, can choose from a diverse set of methods to bridge from the strategic objectives that appear on a company or business unit scorecard across to personal and team objectives:
At one Mobil business unit, New England Sales and Distribution (NES&D), the senior executive team introduced the Balanced Scorecard philosophy with a playful approach.3 Unit CEO Tony Turchi felt that the scorecard was too complicated to communicate to his 300 employees in the field: “In 1995, we were doing Balanced Scorecard 101. We had to learn to walk before we could run. We needed to make it simple and understandable to all our people. We also wanted to create some fun and excitement.”
In late January, the weekend after the Super Bowl, the NES&D leadership team organized a major meeting at a resort in New Hampshire. They decorated a meeting hall like a football field, gave everyone football sweatshirts, and showed videotapes of the great NFL professional teams like the Green Bay Packers and Pittsburgh Steelers. They had an announcer from NFL films describe how these winning teams had all the elements—offense, defense, coaches, the support groups—working together. The leadership team then announced that the New England region would have its own Super Bowl for 1995, with scoring based on five critical measures drawn from the financial, customer, and internal process measures on the NES&D scorecard:
Gasoline volume
Return on capital employed
Customer complaints
Mystery shopper rating
Commitment to dealers
NES&D would win the Super Bowl if it could hit stretch targets on all five measures; the internal targets exceeded the performance levels committed by the leadership team to Mobil’s headquarters. If NES&D reached all five targets, everyone would get a cash bonus of $250 and a great weekend next winter at a resort hotel in Vermont. If it failed in any one, there would be no reward.
The leadership team then rolled the Super Bowl program out to all people in the field.
We talked to the drivers, the union people and took them through the strategy, the Super Bowl concept, and asked for their support to help us achieve our goals, how they could impact the measures. The truck drivers didn’t believe us. They said, “The marketing guys get all the good rewards and go out and have a good time; they never include the terminal guys.” We had to convince them that we were serious. They were going to get the same reward as the marketing people.
After explaining the five measures and how the employees could affect them, the leadership team asked the employees to use the measures to set priorities for their work, and to stop doing work that didn’t directly relate to improving the measures. As described in Chapter 2, truck drivers, on their own, started calling in from the field about stations that were dirty, poorly lit, and unfriendly to customers. The NES&D project team maintained communication through the year in meetings, e-mail, voice mail, and newsletters. The information included up-to-date reports on the five Super Bowl measures. At every meeting that Turchi and his senior leadership staff had with people in the field, performance was discussed against the Super Bowl targets.
By the end of the year, NES&D had greatly exceeded the stretch targets on four of the five Super Bowl measures. People acknowledged that the Super Bowl targets and the associated individual goals and objectives had driven this outstanding performance. But Turchi faced a dilemma:
Some said that the rules we established at the beginning required us to hit all five, or get nothing. But others argued that we exceeded four of the five, and came close on the fifth. We were about to enter 1996 with another set of very stretched targets, and I wanted people to be motivated to achieve them.
The NES&D leadership team eventually decided to award everyone the $250 bonus but not the free weekend in Vermont.4 Turchi commented on the impact of the Super Bowl for his employees:
You can see the difference in our people. Pre-BSC, the scorecard for an area manager was pretty simple: sales, sales, and sales. For the manager of a terminal, it was cost, cost, cost, and perhaps a little safety. Now we are trying to have the people in both positions be minigeneral managers, to have them think broadly about our entire business.
The Super Bowl approach provided a simple, clear, and focused set of measures and associated targets for all employees. It reinforced the new strategy and required little to no education about the Balanced Scorecard concept to make the measures and targets meaningful and actionable to frontline employees.
With the Super Bowl approach, however, the senior management group chooses the targeted measures. It is top-down, assuming that the executive team has superior information about the most critical elements of the unit’s strategy. The leadership team had better get the critical measures correct, as they will likely get what they measure. The Super Bowl approach does not exploit any local information from middle managers and frontline employees for selecting measures and targets. For NES&D, a relatively homogeneous sales unit, the Super Bowl approach was likely fine, especially during the first year, to align all employees to the business unit’s simple, common objectives through the five selected measures.
Government organizations tend to build their resource allocation and control processes around programs, as they are typically funded through authorized programs. Also, programs provide the linkage from employees’ activities to the agency’s mission. As a good example, the City of Charlotte’s Department of Transportation (CDOT) drilled its scorecard down to employees by linking the department’s scorecard measures to the department’s high-priority programs.5 In the past, the CDOT found it difficult to get employees and local supervisors to take time from their everyday jobs to focus on new initiatives. Terry Lathrop, CDOT deputy director, identified the Balanced Scorecard measures that would be affected by a successful implementation of each new program (see Figure 9-1). This process helped to influence the department’s planning process:
Before, we couldn’t get our people to focus on high-priority areas. People just wanted to talk about and plan for … what they did every day. This new planning process, based on the Balanced Score-card, enabled department managers to pay serious attention to high-impact programs that had to be accomplished during the next 12 months. 6
Second, Lathrop made sure that a work team then took ownership for each priority program, including measures of accountability and performance. The CDOT team developed a reporting framework for the high-impact programs. Each of the forty-one programs had a one-page report that included the following:
The Balanced Scorecard objectives and measures affected by the program
The action steps required to implement the program
The desired outcomes from the program
The responsible managers
The critical factors
The program-specific performance measures
Figure 9-1 City of Charlotte Department of Transportation: Linking Programs to Objectives and Measures
Summary of Division High-Impact Programs to Meet CDOT Objectives

The report became the responsibility for each eight-person work crew. It provided the workers in each crew with a clear understanding of how their work contributed to citywide objectives, and how the work would be evaluated and judged. It gave ownership to the program and to the measures. It enabled the department to pass the workers’ WIIFM (“What’s in it for me?”) criterion. The workers now had a context for their performance measures.
This method clearly delineated the responsibilities of frontline work teams. It also provided a validity check that each program and initiative, if successfully implemented, would have a significant impact on one or more Balanced Scorecard strategic measures. And it enhanced the motivation of the frontline teams by mapping their day-to-day activities up to high-level business unit and corporate objectives. One potential disadvantage is that the program was so structured that individuals were not left with much of a role for innovation and cross-functional initiatives. They may not find ways to have an impact on objectives and measures outside the specific jobs and tasks assigned to them.
United Parcel Service, with 344,000 employees, is the world’s largest express carrier and package delivery company. Measurement has long been part of the UPS culture; the company strongly believes in the Vince Lombardi axiom “If you’re not keeping score, you’re only practicing.”7
In December 1994, CEO Oz Nelson issued a directive to develop an improved measurement framework for a new UPS culture: to become a process-oriented organization. During 1995, the corporate quality group facilitated a process to establish that framework, which included the following:
Senior management educated on TQM principles
Point of arrival (POA) goals established at the corporate level
Balanced Scorecard business plan for each region and district to achieve POA targets
Deployment through a quality improvement process (QIP) at each business unit and quality performance reviews (QPRs) for
every individual
Prior to the development of the Balanced Scorecard, employees did not understand how their local measurements and actions contributed to higher-level organizational goals. The goal of the new framework was to establish a clear line of sight from the frontline employees, who deliver to customers every day, up to the region, the district, and, finally, the corporation. Each employee had to understand how his or her job contributed to overall business goals.
The POA measures, selected by senior management, were indexes of
Customer satisfaction
Employee relations
Competitive position
Time in transit
The leadership team established stretch targets for these measures based on where UPS had to be to achieve its mission.
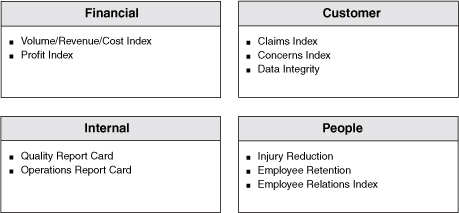
The Balanced Scorecards for the regions and districts contained measures in each of the four perspectives (see Figure 9-2).
Managers in each district conducted monthly business review meetings to develop and monitor strategic and cross-functional plans for improving the metrics on the Balanced Scorecard. The strategic plan included goals (targets) for the scorecard measures, root-cause analysis for problem areas, identification of the teams to attack the problems, and the time plan for implementation. Each operations supervisor developed action plans aligned to the strategic plan. The action plan components became elements in supervisors’ QPRs.
Figure 9-2 UPS’s Balanced Scorecard
The QPR, derived from the district Balanced Scorecard, replaced the MBO local measures that had been used previously. In this way, district objectives were aligned with corporate objectives, and local success would contribute to achieving corporate goals. Scores on the performance reviews determined up to 50 percent of a manager’s compensation; 80 percent of the rating came from the Balanced Scorecard results and 20 percent from an assessment of the manager’s critical skills and competencies from supervisor, peer, and personal ratings.
UPS managers believe that the linked Balanced Scorecard measurements played a critical role in moving it from a functional to a process-oriented organization—a transition that most organizations fail to accomplish. The new system was implemented flexibly, so that perspectives could be emphasized differently, depending on the process and its level in the organization. The system built upon the existing emphasis on quality, so it was not viewed as a major change from the TQM culture that had been established in the prior several years. The new system was also widely accepted at UPS because it supplied employees with both intrinsic and extrinsic motivation. People wanted to know the big picture, the cause-and-effect relationships that linked their local job to corporate strategy and objectives. And because all employees could purchase the company’s stock (even before it went public in November 1999), they had a natural interest in learning how they could influence the company’s stock price.
Winterthur International, a top-ten international property and casualty insurer, deployed its Balanced Scorecard through a performance management model developed by the human resources function. The company had recently formulated a new differentiation strategy for industry leadership based on intellectual capital and competencies. Winterthur built a performance model to link the strategy through eight themes:
These themes established the linkages from financial objectives to objectives in the customer, internal, and learning and growth perspectives. Winterthur then developed lagging and leading measures for its Balanced Scorecard. The company made the scorecard come alive by linking measures to specific employee development and change programs.
Winterthur’s human resources group developed a new management structure to attract, develop, and retain the highly motivated and strategy-focused workforce required for the new business strategy (see Figure 9-3). The HR management structure developed a set of specific job families. For each family, the HR group defined accountabilities, skills and knowledge, performance indicators (measures), and behavioral competencies. The competencies and performance indicators defined the kinds of people the company wanted and how they would make specific contributions to the company’s strategy. The new structure emphasized the outcomes from the HR function, not the activities it performed.8 The job family definitions and measures identified training and development needs and served to guide promotion and career-planning progression.
Many of the skills, knowledge, and competencies, of course, were difficult to measure, as they involved such subjective and difficult-to-observe concepts as relationship-building, developing skills in others, conceptual thinking, and interpersonal understanding. The exercise, however, of deriving individual objectives from how people could contribute to achieving the strategy served to make Winterthur’s strategic themes, objectives, and measures meaningful for all employees.
Figure 9-3 Winterthur International’s Human Resources Management Process

Nova Scotia Power, Inc., also used its human resources group to drive the scorecard down to individuals. The HR group analyzed what competencies the employees needed to have for the strategy to succeed. They asked every employee to perform a self-assessment about how they measured up against the competencies, with adequate validation (such as 360-degree feedback) to ensure that the assessments were realistic. Employees then defined personal development plans, which they validated with their managers, that would bridge the gap between the competencies and skills possessed today and those needed for the future.
When individuals can construct their own Balanced Scorecards, then we have produced the clearest mechanism for aligning individual objectives to business unit and corporate objectives. In our previous book, we described how the exploration group of a large oil company created a small, fold-up personal scorecard (see Figure 9-4) for each person in the organization. The card contained three levels of information. The first level, preprinted on the left side of the card, described the corporate objectives and measures. The second level, printed in the middle, provided space for the business unit to translate the corporate goals into its specific goals. The third level enabled individuals and teams to define their personal performance objectives and the near-term steps of action they would take to achieve their objectives. Individuals also defined up to five personal performance measures for the personal objectives, as well as targets for these objectives that would be consistent with achieving the higher-level business unit and corporate objectives. The personal card kept the three levels of objectives, measures, and actions readily accessible on a daily basis for all employees. In contrast to the typical MBO approach, individuals did not develop their local objectives until they had a clear understanding of corporate and business unit objectives. They then articulated how their local, personal performance objectives would contribute to the accomplishment of business unit and corporate objectives.
Figure 9-4 Personal Balanced Scorecard
Corporate Objectives
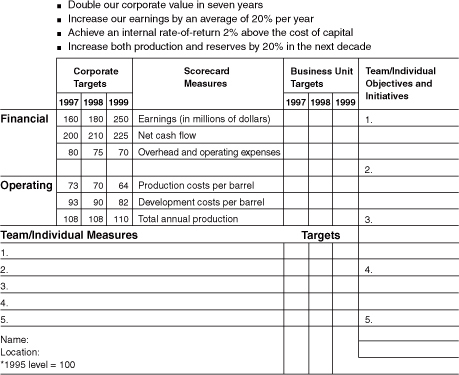
Source: Adapted from Robert S. Kaplan and David P. Norton, “Using the Balanced Scorecard as a Strategic Management System,” Harvard Business Review (January-February 1996): 81. Reprinted by permission of Harvard Business Review.
Initially at Nova Scotia Power, personal scorecards were developed only for senior executives and sales account managers. Over time, the Balanced Scorecard has been adopted and cascaded throughout the business units. Managers from all other parts of the organization have begun to utilize personal Balanced Scorecards for themselves and their employees to promote individual alignment with department, business unit, and corporate objectives. The personal scorecards are now beginning to be used to integrate personal development goals and performance management to scorecard measures and results that are tied to compensation. In one group, Treasury Operations, all thirty-five employees developed personal Balanced Score-cards in the first year of scorecard implementation and linked all their variable compensation to scorecard performance. Since that time, the number of employees in the Finance Group with personal Balanced Scorecards has increased each year. CFO Jay Forbes’s goal for 2000 is for 80 percent (104 of 130) of his employees to have a personal Balanced Scorecard in place. Forbes observed:
We had situations that required a bit of imagination and creativity to define the right measure of success. For example, Investor Services finally took as a goal to eliminate phone calls from irate retail investors to the CEO or CFO. The groups learned that they had to measure and manage customer perceptions with the same vigor as salespeople.
Nova Scotia Power has had success in cascading the scorecard to the frontline employee in its Operating Business Unit as well. For example, in two of its generating stations, Balanced Scorecards were cascaded to the shop-floor (team) level, equating to twenty-six scorecards at two stations.
The standard for individual Balanced Scorecards, however, was established by Mobil NAM&R’s Lubricants business unit. In Chapter 8, we described how the unit’s project team used a cause-and-effect strategy tree (see Figure 8-5) to communicate strategy to the front lines. The team asked employees to develop individual Balanced Scorecards using the following rules:
Scorecard should have a minimum of one objective and measure per perspective.
Do not exceed fifteen measures.
The individual’s scorecard must support the supervisor/manager’s scorecard.
The scorecard must include a mix of lead and lag indicators.
Every supervisor/manager must have an objective and measure related to coaching, counseling, or employee development.
The scorecard must include an objective and measure that supports another part of the business.
Any change must be agreed to by both supervisor and employee.
By having at least one objective and measure in each perspective, everyone would have a “Balanced Scorecard.” For the financial perspective, each individual could identify a cost or revenue item that he or she could affect. For customers, employees had to recognize the internal or external person or group who benefited from their work. The internal process objectives reflected the activities performed by the individual that would improve financial and customer performance. And for the learning and growth objectives, the project team asked employees to develop personal development plans that would help them meet their objectives in the other three perspectives. The constraint of fifteen measures meant that the score-cards had to be simple. The team did not want this task to be complex and burdensome.
The linkage to supervisors and managers ensured that high-level objectives would cascade down through the organization (see Figure 9-5). It provided the linkage from business unit objectives to individual objectives. Individuals in the Lubricants unit reported that for the first time they understood what their supervisors and their supervisors’ supervisors were trying to accomplish. This knowledge helped them do their jobs better.
One can see in Figure 9-5 how aggregate measures for the business unit general manager (George Madden at level 1) cascade down six levels to eventually reach a truck driver. Even in the seventh level, every measure in the truck driver’s scorecard contributes in some way to the organizational strategy. Madden felt that the drill down to personal Balanced Scorecards enabled helped him to communicate a clear message about critical success factors: “I’ve been talking for four years about the need to fulfill the perfect order. But what did it mean? No one knew, outside of the order-fulfillment people. Now the vast majority of the people in this organization own a piece of that measure.”
The mix of lead and lag indicators allowed employees to include measures that they could not directly control but whose performance was expected to improve as employees made improvements in the leading indicators (the performance drivers) on their scorecard. Thus employees learned the distinction between measures they could influence, through their actions, and measures they could directly control.
The measures on coaching and personal development were especially significant. Each individual developed an action plan for the learning and growth perspective: what will be done during the next period to maximize the likelihood of achieving scorecard targets and enhancing personal development. Thus, as at Winterthur, the Balanced Scorecard tied directly to personal development plans for achieving business unit strategic objectives.
Figure 9-5 Cascading to Teams and Individuals at Mobil NAM&R’s Lubricants Division

Madden insisted on the criterion of choosing at least one measure outside the individual’s normal job or work assignment. He wanted employees to think “out of the box.” They had all seen the cause-and-effect strategy tree. Madden wanted them to think how they could help the business in a cross-functional or other innovative way.
As in the New England district, the truck drivers came through with the most innovative suggestion. The drivers noted that they drove 200,000 miles a year and basically lived in truck stops. While at truck stops—for fuel, food, or rest—they were around other truck drivers. The Lubricants truck drivers offered to work with the marketing research people in the commercial engine oil business to develop a survey that they would administer to learn about the other drivers’ purchases and perceptions of engine oils. The truck drivers actually volunteered to conduct market surveys in truck stops that would provide feedback to people in the product development, marketing, and distribution side of the business.
If George Madden had ordered the truck drivers to conduct such surveys, the drivers would likely have imitated their French brethren and parked their trucks across highways, stopping traffic in all directions. But this suggestion did not come from the business head; it came from the frontline employees themselves. And the employees volunteered for the task, even though they likely would have refused the extra work if they had been ordered from above to perform it. This illustrates the power of intrinsic motivation. Madden trusted the workers and shared the business unit’s strategy with them. The workers, seeing the whole picture for the first time, bought into the values of the organization, internalized them, and engaged in creative problem solution to propose an entirely new activity that would help the organization achieve its strategic objectives.
Our initial case study in this chapter described Mobil NES&D’s use of the Super Bowl approach for its personal alignment process. It chose five measures from the scorecard and had every employee work to achieve stretch targets for the five measures. We argued earlier that the Super Bowl approach may have been fine for a relatively homogeneous and focused organization like a sales district.
Mobil Lubricants, in contrast, took the more complex and costly route by requiring that all 550 employees develop a personal Balanced Score-card. The personal Balanced Scorecard approach required a strong project team to launch the concept and see that it was understood throughout the organization, plus the time of supervisors and employees to develop the cascaded scorecards and personal development plans. The Lubricants unit was a much more complex organization than a sales district. It had several different market segments, different distribution channels, and potentially different strategies. A single, high-level scorecard or a few Super Bowl measures may not have given sufficient guidance to people in the different segments, channels, and product lines. Therefore the cascading of score-cards down through the business allowed each Balanced Scorecard to be customized to the particular situation in which each team and individual found itself.
Arguably, the two business units—NES&D and Lubricants—each took the right approach for its business for linking scorecards to individual objectives, even though the two approaches were diametrically different. This illustrates the importance of tying the Balanced Scorecard program to business strategy. One size cannot possibly fit all.
Companies have many ways to link individuals’ local behavior to higher-level business unit and corporate objectives. Homogeneous organizations whose outcomes are relatively easy to measure—such as a sales organization—can focus on relatively few measures, mostly outcomes in the financial and customer perspectives. With only a few measures, executives ask individual employees and teams to improvise and innovate to find new ways of achieving the desired organizational outcomes.
More complex organizations will share the outcomes and strategy they are trying to achieve, and will allow each individual or team to define personal objectives they can influence that will have an impact on the organizational objectives. The structure becomes even more formal when the personal objectives are developed either through personal Balanced Score-cards or integration with quality deployment and human resources development processes.
1. Management by objectives was introduced by Peter Drucker in The Practice of Management (New York: HarperBusiness, 1954).
2. R. S. Kaplan, “City of Charlotte (A),” 9-199-036 (Boston: Harvard Business School, 1998), 2.
3. See R. S. Kaplan, “Mobil USM&R(B): New England Sales and Distribution Unit,” 9-197-026 (Boston: Harvard Business School, 1996).
4. Some of the nonskiing employees thought this was a better outcome than receiving the free winter weekend at the resort.
5. R. S. Kaplan, “City of Charlotte (B),” 9-199-043 (Boston: Harvard Business School, 1999).
6. Ibid., 3.
7. Vince Lombardi was the legendary coach of the championship Green Bay Packer NFL teams of the 1960s.
8. The shift in emphasis for the HR function—from activity measures to outcome measures—matches the advocacy of leading HR scholars; see D. Ulrich, “A New Mandate for Human Resources,” Harvard Business Review (January-February 1998): 124-34.