CHAPTER 7
FATIGUE AND TRAINING STATUS
Gregory C.Bogdanis
OBJECTIVES
The objectives of this chapter are to:
• identify and explain the differences in fatigability between individuals with different training background and daily levels of physical activity;
• understand the factors that determine differences in fatigability between individuals during high-intensity exercise;
• describe and explain the influence of changing the training status through systematic training on fatigue;
• analyse the effects of severe reduction of the daily activity level, as occurs in detraining or immobilisation, on muscle performance.
INTRODUCTION
In recent years, accumulating evidence has established the important role of training status in the ability to resist fatigue during high-intensity muscle contractions. Training status reflects the level of adaptation of the different physiological systems to chronic exercise or inactivity. Several studies have shown that different types of training result in distinct adaptations at the structural, metabolic, hormonal, neural and molecular level. Similarly, even a few weeks of inactivity in the form of detraining or immobilisation will decrease fatigue resistance due to both peripheral and central mechanisms.
The aim of this chapter is to demonstrate and explain the differences in fatigability between individuals with different training backgrounds. For this reason, the evidence from studies comparing untrained, endurance-trained and power/sprint-trained individuals will be critically evaluated. Also, the factors that determine the fatigue profile of an individual (e.g. muscle fibre type, aerobic fitness) will be analysed in an attempt to identify their relative contribution to the ability to resist fatigue.
An issue with both theoretical and practical interest concerns the changes that are observed in muscle performance and fatigue when the level of habitual activity is changed. This refers to either acute or chronic increases (training) or decreases in the activity level (injury-based immobilisation). Some athletes are required to stop their training or even immobilise a limb for several days or weeks due to injury. During this time, several morphological, metabolic and neurological changes take place, and muscle performance is reduced. Following a period of rehabilitation, the athlete gradually returns back to action and is “re-trained”. To address the important issues of training-detraining and immobilisation, the second part of this chapter will examine the central and peripheral adaptations to these conditions in relation with their impact on muscle fatigue.
TRAINING BACKGROUND AND FATIGUE
Fatigue in untrained, endurance-trained and sprint/ power-trained individuals
Single-sprint performance
The relationship between muscle fatigue and training status can be demonstrated by examining the decline of muscle performance during intense exercise in individuals with different training backgrounds. In most studies this was done by comparing sprint- or power-trained athletes with endurance athletes. It is well-known that sprint- and power-trained athletes are stronger and faster than endurance athletes and untrained individuals. For example, Paasuke et al. (1999), reported that power-trained athletes had 27% higher maximal voluntary contraction force (MVC) and 25% higher maximal rate of force development (RFD) compared to endurance athletes. Interestingly, there was no difference between the endurance-trained athletes and an untrained group of subjects in these parameters (Paasuke et al., 1999).
The ability to generate high power output during a short sprint is also superior in power athletes. Peak and mean power output measured on a 30s cycle ergometer test were 38% and 27% higher, respectively, in sprint cyclists compared with endurance cyclists (peak power: 1,547±128W versus 1,122±65W; mean power: 1,030±52W versus 813±22W (Calbet et al., 2003)). Although part of these differences may be attributed to the larger body and muscle mass of power-trained athletes, peak and mean power were still 21% and 11% higher when expressed per kilogram of body mass (Calbet et al., 2003). Comparisons of mean and peak power between the two groups of athletes reveals that their difference in mean power is almost 50% less than their difference in peak power (21% versus 11%). This is due to the ability of endurance athletes to better maintain their performance during the test, as shown by their lower fatigue index, calculated in that study as the rate of drop from peak to end power output (sprint cyclists: 0.46±0.12 W·s−1·kg−1 versus endurance cyclists: 0.32±0.12 W·s−1·kg−1 (P<0.05)).
Repeated-sprint performance
Differences in fatigue between power-trained and endurance-trained athletes are more evident when repeated bouts of maximal exercise are per formed with short recovery intervals. One of the early studies by Hamilton et al. (1991) showed that endurance runners had a smaller decrement in mean power output during ten 6s all-out sprints with 30s recovery periods, compared with games players (14.2±11.1% versus 29.3±8.1% (P<0.05). In the case of repeated short sprints, fatigue index is expressed as the drop of peak or mean power from the first to the last sprint (Hamilton et al., 1991), or as the average decrement of power in all sprints relative to the first sprint (Fitzsimons et al., 1993). According to this later calculation of fatigue, endurance runners had a 37% smaller power decrement over five 6s maximal sprints departing every 30s, compared with team-sports players (Bishop and Spencer, 2004). This was accompanied by smaller disturbances in blood homeostasis as reflected by lower post-exercise blood lactate concentration (9.9±2.1 mmol·l−1 versus 11.4±0.8>mmol·l−1) and higher blood pH (7.27±0.04 versus 7.20±0.04 (Bishop and Spencer, 2004)). Furthermore, it has been shown that endurance athletes have higher oxygen uptake during a repeated-sprint test, indicating a greater contribution of aerobic metabolism to energy supply (Hamilton et al., 1991). Taken together, these results suggest that the differences in fatigability between sprint/power and endurance athletes may be related to both quantitative and qualitative differences in a number of factors that influence the fatigue profile during intense exercise.
Factors that determine fatigue profile during high-intensity exercise
Muscle fibre composition and metabolic profile
It has long been known that muscle fibre composition is distinctly different between untrained individuals, sprint/power-trained and endurance-trained athletes (Costill et al., 1976). Based on the myosin ATPase reaction, human skeletal muscle fibres can be divided into two main types: slow-contracting/ slow-fatiguing and fast-contracting/fast-fatiguing fibres. Recent analysis techniques have enabled a more detailed grouping of muscle fibres according to the expression of myosin heavy chain (MHC) isoforms. There is evidence to suggest that the functional heterogeneity of muscle fibres largely depends on MHC isoform content (Bottinelli, 2001; Malisoux et al., 2007). This means that classification of fibre content of a muscle according to MHC can provide an informative picture about functional characteristics such as strength, power and fatigue resistance. According to the major MHC isoforms, three pure fibre types can be identified: slow type I and fast type IIA and IIX (Sargeant, 2007). Although these fibre types have similar force-per-unit cross-sectional area, they differ considerably in maximum shortening velocity (type I is about 4–5 times slower than IIX) and power-generating capacity (Sargeant, 2007). From a metabolic viewpoint, type IIX fibres have an enzymatic profile that favours anaerobic metabolism, i.e. high resting phosphocreatine (PCr) content (Casey et al., 1996) and high concentration and activity of key glycolytic enzymes such as glycogen phosphorylase and phosphofructokinase (Pette, 1985). This profile makes the fibre more vulnerable to fatigue due to energy depletion or accumulation of metabolites (Fitts, 2008). On the other hand, type I fibres have a higher content and activity of oxidative enzymes that favour aerobic metabolism and fatigue resistance (Pette, 1985). Thus, it can be concluded that individuals with a greater proportion of type I fibres would be more fatigue-resistant compared with individuals with a greater proportion of type IIA and type IIX fibres. Table 7.1 shows the fibre type proportions in populations with different training backgrounds. As can be seen, endurance athletes, as opposed to sprinters and recreationally active individuals, have a higher percentage of type I slow and fatigue-resistant fibres. This is in accordance with the lower peak power output and force-generating capacity and the reduced muscle fatigue during intense exercise.
The effects of muscle fibre type on fatigue have been examined by Hamada et al. (2003) in two groups of individuals who performed a series of 16 MVCs of the knee extensors. One group had a high percentage of type I fibres (61.4±6.9%, group I) and the other group had a high percentage of type II fibres (71.8±9.2%, group II). Group II had a greater decrease in MVC force than group I (49.3±2.6% versus 22.8±6.2% (P<0.01 (see Figure 7.1) and exhibited a greater impairment of twitch force parameters such as time to peak torque and half-relaxation time (Hamada et al., 2003). It was concluded that muscle fibre composition plays a major role in the development of fatigue.
Another approach to demonstrate the important role of fibre type composition on muscle fatigue during high-intensity exercise is to measure changes in muscle metabolites in single-muscle fibre populations. Karatzaferi et al. (2001) has shown that there is a selective recruitment and selective fatigue of the fast fibres containing the IIX MHC isoform, as shown by the large (70%) decrease of ATP within 10s of sprint exercise. On the other hand, type I fibres show no change in ATP at the same time (Figure 7.2). It has been proposed that this pattern of ATP depletion indicates that the contribution of the fastest and more powerful fibres (containing IIX isoform) is decreased after the first few seconds of sprint exercise (Sargeant, 2007). This decreased contribution is due to the greater metabolic disturbances in type II compared with type I fibres during maximal exercise. For example, during a 30s sprint, the rate of PCr
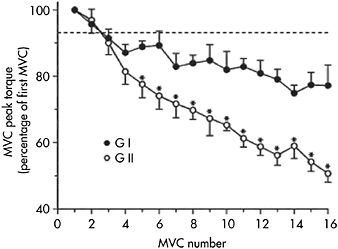
Figure 7.1 Percentage change in MVC peak torque during a 16-MVC fatigue protocol using the knee extensors. Each MVC lasted 5s, with a 3s rest in between. Values below the dashed line are significantly lower (P<0.05) compared with the first MVC. Group GI: predominance of type I muscle fibres; group GII: predominance of type II muscle fibres in vastus lateralis. *P<0.05 between groups GI and GII
Source: Reprinted from Hamada et al., 2003. Acta Physiol Scand, 178, 167, Figure 1. Copyright 2003 by Blackwell Publishing. Used with permission.
degradation and glycogenolytic rates are 36% and 64% higher, respectively, in type II compared to type I fibres (Greehaff et al., 1994; Casey et al., 1996). This means greater lactate and H+ accumulation, and thus increased fatigue. Furthermore, the metabolic characteristics of type II fibres, i.e. lower mitochondrial and aerobic enzyme content and lower capillary supply than type I fibres, result in slower PCr resynthesis and lactic acid removal (Tesch and Wright, 1983; Tesch et al., 1985, 1989; Casey et al., 1996), thus making this fibre type more vulnerable to fatigue in the subsequent exercise bout.
The idea of selective recruitment and fatigue of the fast fibres during maximal exercise may be extended to explain the greater fatigability of individuals with a high percentage of fast-twitch fibres. Colliander et al. (1988) have compared fatigue during three bouts of 30 MVC knee extensions between individuals with a high percentage of type I and II fibres. As expected, individuals with a high percentage of type II fibres produced higher peak torque, but fatigued significantly more during the exercise protocol. It is worth noting that when blood flow was occluded by means of a pneumatic cuff around the proximal thigh, the decrease in peak torque was greater (52% versus 10%) in the group with higher percentage of type I (slow) muscle fibres, probably indicating the reliance of these fibres on oxygen availability and aerobic metabolism (Colliander et al., 1988).

Figure 7.2 Mean decline in ATP concentration for type I (squares), IIA (circles) and IIAx and IIXa (upright and inverted triangles) during a 10s and a 25s maximal sprint on a cycle ergometer. Type IIAx and IIXa are hybrid fibres containing either less or more than 50% IIX MHC isoform. Power output data for the sprints are shown with the solid line for a typical subject
Source: Reprinted from Karatzaferi et al., 2001. Exp Physiol, 86, 414, Figure 3. Copyright 2001 by Blackwell Publishing. Used with permission.
Influence of initial force/power output
One of the confounding factors when comparing fatigue calculated as a percentage decrement of force or power during a test between individuals of different training status, is the magnitude of the peak force or power that can be generated at the start of the test. Previous studies have reported that initial sprint performance is strongly correlated with power decrement during a repeated-sprint test (Hamilton et al., 1991; Bishop et al., 2003) and inversely related to maximal oxygen uptake (Bogdanis et al., 1996). Thus, the greater fatigue resistance of endurance athletes may be more related to their low initial sprint performance rather than their high aerobic fitness.
The dependence of the calculated fatigue index on the initial power is demonstrated in the data presented by Calbet et al. (2003), comparing endurance and sprint cyclists (Figure 7.3). It should be noted that the differences in power output between the groups existed only for the first 10s of the sprint, and thereafter the two groups generated the same power. Interestingly, the oxygen deficit of the sprint cyclists was much higher (+33%) for that first part of the sprint, indicating that these athletes rely more on anaerobic sources. In contrast, endurance-trained athletes had a higher oxygen uptake during the last 15s of the test, suggesting a higher aerobic contribution.

Figure 7.3 Time course of power output during a 30s maximal cycle ergometer sprint performed by sprint- and endurance-trained cyclists. Power output is expressed per kilogram of body mass
Source: Redrawn with permission from Calbet et al., 2003. J Appl Physiol, 94, 671, Figure. 1. Copyright 2003 by The American Physiological Society. Modified with permission.
Note
*P<0.05 sprint versus endurance cyclists.
To resolve the issue about the influence of the initial power output on fatigue during high-intensity exercise, Tomlin and Wenger (2002), and later Bishop and Edge (2006), compared two groups of female team-sports athletes with different maximal oxygen uptake values (low  34–36ml·kg−1·min−1 versus moderate
  47–50ml·kg−1·min−1), but with the same peak and mean power output in a 6 s cycle ergometer sprint. These athletes were required to perform five 6s sprints with 24s recovery (Bishop and Edge, 2006) or ten 6s sprints with 30s recovery (Tomlin and Wenger, 2002). Even though the two groups were matched for initial sprint performance, the moderate
  group had a smaller power decrement across the ten (low versus moderate: 18.0±7.6% versus 8.8±3.7% (P=0.02) or the five sprints (low versus moderate: 11.1±2.5% versus 7.6±3.4% (P=0.045). These results point to an important role of aerobic fitness on the ability to resist fatigue.
A recent study by Mendez-Villanueva et al. (2008) proposed an alternative point of view. Instead of examining the effect of the initial power output on subsequent fatigue, they proposed to explain differences in fatigue by looking at the anaerobic power reserve of each individual. This was quantified as the difference between the maximal anaerobic power measured during a 6s sprint and the maximal aerobic power determined during a graded test to exhaustion. Individuals with a lower anaerobic power reserve, implying less reliance on anaerobic metabolism, showed a greater resistance to fatigue. This suggests that the relative contribution of the aerobic and anaerobic pathways to energy supply and not the absolute power generated may better explain power decrements during repeated sprints (Mendez-Villanueva et al., 2008).
Evaluating performance and fatigue during high-intensity exercise
The evaluation of performance during single or repeated bouts of high-intensity exercise is usually done using two indices: (a) total work done during the test; and (b) the percentage decrement of power output from the start to the end of the test. Both indices offer valuable (and complementary) information about the training status of an individual. However, confusion may arise when they are used to assess the effects of training and detraining. In most sprint-training studies, total work in single or multiple sprints is higher after sprint training. For example, Linossier et al. (1993) reported an increase in total work during a single 30s sprint by 16%. As can be seen in Figure 7.4, the increase in total work was due to higher power output during the first half of the sprint, and thus, fatigue index, i.e. the drop of power from peak to end was higher after training. This “paradox”, i.e. greater fatigue after training, has to be interpreted with caution because the overall performance suggests an increase rather than a decrease in power-generating capacity.
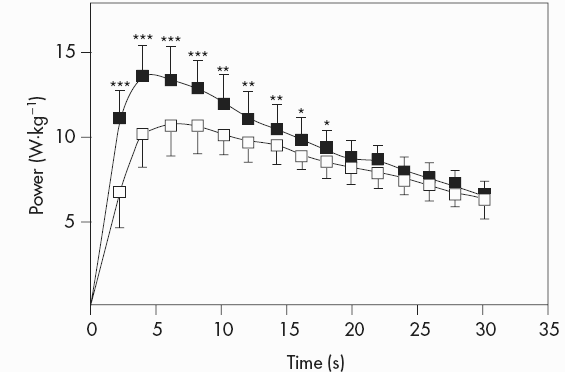
Figure 7.4 Power output during a 30 s maximal sprint on a cycle ergometer before and after seven weeks of sprint training (pre-training: open squares; post-training: closed squares)
Source: With kind permission from Springer Science+Business Media. Linossier et al., 1993. Ergometric and metabolic adaptation to a 5-s sprint training programme. Eur J Appl Physiol Occup Physiol, 67, 1993, 410, Figure 3.
This argument also applies when comparing power-trained, endurance-trained and untrained individuals during a repeated-sprint test. As seen in Figure 7.5, the total work done and the percentage work decrement give a conflicting picture of repeated-sprint performance ability when sprint-trained and endurance-trained athletes are compared. The percentage work decrement is two-fold higher in the team-sport group compared with the endurance group (11.3 versus 5.6% (P<0.05), implying greater fatigue and poorer repeated-sprint performance for the team players. In contrast, total work over the six sprints is significantly higher in the team players, and this clearly shows a better overall repeated-sprint performance of these players compared with the endurance athletes (Figure 7.5). These apparently contradictory results demonstrate the well-known characteristics of sprint/power athletes to produce high power over the initial part of a high-intensity effort, and then fatigue more. However, they also suggest that one has to select the appropriate index of repeated-sprint performance ability when comparing different groups of individuals.
Aerobic fitness: maximal oxygen uptake and aerobic contribution to energy supply
Several studies have shown that short bouts of all-out exercise, such as sprinting, are not as “anaerobic” as previously thought. Gaitanos et al. (1993) noted that while the decrease in peak and mean power during ten 6s sprints with 30s rest was 33% and 27%, respectively, anaerobic energy supply was reduced by about 70% due to a complete blocking of anaerobic glycolysis. They first suggested that power output during the last sprints
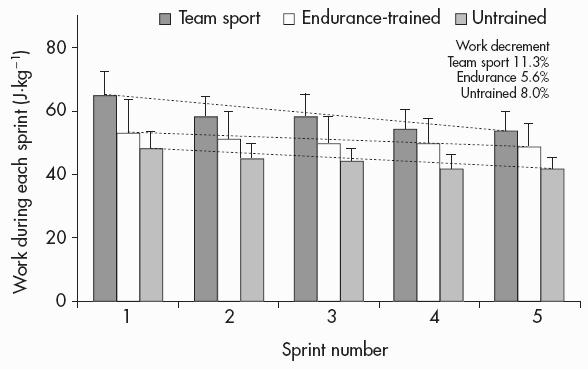
Figure 7.5 Total work per kilogram of body mass during each sprint of the five 6s repeated-sprint test. Dotted lines denote the rate of work drop from the first to the last sprint. Work decrement is the average decrement of work in all sprints relative to the first sprint, according to Fitzsimons et al., 1993
Source: With kind permission from Springer Science+Business Media. Edge et al., 2006. The effects of training intensity on muscle buffer capacity in females. Eur J Appl Physiol, 96, 230, Figure 3, panel b.
Notes
*: Significantly different from untrained (P<0.05); §: significantly different from endurance-trained (P<0.05).
was sustained by increased contribution of aerobic metabolism. The magnitude of aerobic contribution to energy supply during sprint exercise was quantified in a later study using muscle metabolite and oxygen uptake measurements during repeated 30s sprints (Bogdanis et al., 1996). Indeed, when sprint exercise is repeated, aerobic contribution to energy supply is largely increased (Figure 7.6). This enhanced aerobic component during repeated-sprint exercise implies that individuals with higher  would have greater aerobic contribution to energy supply when performing this type of exercise. This increased aerobic contribution in endurance-trained individuals was found in several studies (Hamilton et al., 1991; Tomlin and Wenger, 2002; Calbet et al., 2003), with oxygen uptake reaching 80% and up to 100%
  the later stages of the test (Dupont et al., 2005). Thus, the more endurance-trained an individual is, the higher the aerobic energy supply during single or repeated-sprint exercise.
In an attempt to quantify the effects of aerobic fitness on fatigue during intense exercise, some researchers have reported the percentage of variance in fatigue explained by the variance in  of the participants. This is done by squaring the correlation coefficient (r) between the two variables (
 and per cent fatigue) and then multiplying by 100. The modest correlations between
  and power decrement (typically between −0.5 and −0.65) give relatively low r2 values, and thus only 25–42% of the variance in fatigue is explained by
  (Tomlin and Wenger, 2002; Bishop
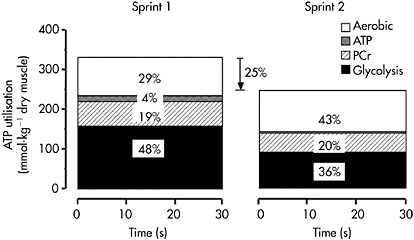
Figure 7.6 Per cent contribution to energy supply from aerobic metabolism, ATP degradation, PCr hydrolysis and anaerobic glycolysis during two 30s cycle ergometer sprints separated by 4min passive recovery
Source: Redrawn using data from Bogdanis et al., 1996. J Appl Physiol, 80, 881, Figure 5. Copyright 1996 by The American Physiological Society. Modified with permission.
et al., 2004; Bishop and Edge, 2006). Moreover, when team-sport athletes and endurance runners were matched for  the power decrement during repeated 6s sprints was still lower in the endurance athletes, suggesting that other factors in addition to
  are important (Bishop and Spencer, 2004).
Aerobic fitness: oxygen uptake kinetics
The rate at which pulmonary oxygen uptake  increases following the onset of muscular exercise is potentially an important determinant of exercise tolerance. A faster
  adjustment at the onset of intense exercise leads to a greater contribution of oxidative phosphorylation and possibly a decreased reliance on anaerobic glycolysis, with positive effects on performance and reduction of muscle fatigue. The rate of increase in
  may be quantified by calculating the time constant
  of the
  response. Caputo et al. (2004) showed that
  is dependent on training status, with untrained individuals having much longer time constants than endurance-trained athletes (e.g. 53s versus 32s). This may reflect differences in central oxygen delivery (heart rate kinetics), muscle blood flow and the ability to accelerate muscle oxidative metabolism, the so-called “metabolic inertia” that is related to the levels of cellular metabolic controllers and/or enzyme activation (Grassi, 2003). The dependence of
  kinetics on aerobic fitness and the metabolic profile of the muscle explains the fact that sprint-trained athletes have significantly slower
  response than their endurance-trained counterparts (
 32±12s versus 20±6s (Berger and Jones, 2007)). The relationship between
  kinetics and performance in repeated-sprint exercise has been recently demonstrated by Dupont et al. (2005), who found that repeated-sprint performance was better correlated with
  (r=0.80 (P<0.01)) than with
  (r=0.48 (P<0.05). These results show that individuals with faster
  kinetics have a faster adjustment of
  during repeated maximal exercise, leading to lower fatigue.
Aerobic fitness: effects on PCr resynthesis
One of the possible determinants of fatigue and performance recovery during repeated MVCs is PCr availability (Bogdanis et al., 1995, 1996). PCr is a major contributor to energy supply during the initial few seconds of maximal exercise, when it serves as a temporal buffer of free ADP (Sahlin et al., 1998). During repeated maximal exercise, the rate of PCr resynthesis determines its availability for the next exercise bout, and thus individuals with fast PCr kinetics are less prone to fatigue.
The dependence of PCr resynthesis on oxygen availability is well-known (Haseler et al., 1999, 2007). Phosphorus magnetic resonance spectroscopy (31P MRS) has allowed the non-invasive measurement of PCr restoration, which has been widely used as an index of muscle oxidative capacity (Haseler et al., 2004). It is therefore not unexpected that individuals with higher muscle oxidative capacity have faster PCr resynthesis rate compared with untrained persons (Yoshida and Watari, 1993; Takahashi et al., 1995). The differences in PCr resynthesis and performance recovery between endurance-trained, sprint-trained and untrained individuals have been studied by Johansen and Quistroff (2003) using 31P MRS. In that study, participants performed four MVCs of 30s duration, interspersed by 60 s recovery intervals. Endurance-trained athletes showed almost twice as fast PCr recovery (half time, t1/2:12.5±1.5s) compared to sprint-trained (t1/2:22.5±2.5s) and untrained participants (t1/2:26.4±2.8s). This resulted in full restoration of PCr for the endurance athletes prior to each contraction, whereas the sprinters and untrained subjects started the subsequent contractions with a PCr level of about 80% PCr of resting.
The faster rate of PCr resynthesis in endurance athletes is probably unrelated to  Cooke et al. (1997) have demonstrated that individuals with high and low
  (64.4±1.4ml·kg−1·min−1 versus 46.6±1.1ml·kg−1·min−1 (P<0.01)) had similar PCr resynthesis rates. Also, individuals with an equal
  may have remarkably different endurance capacity, due to peripheral muscle adaptations such as capillary density and blood lactate threshold (Coyle et al., 1988). Thus the faster rate of PCr resynthesis in endurance-trained individuals is most probably due to the specific adaptations of this type of training at the peripheral level, i.e. increased mitochondrial content, capillary density and oxidative enzyme content and activity (Andersen and Henriksson, 1977), that maximise oxygen delivery and aerobic ATP production during recovery. The role of
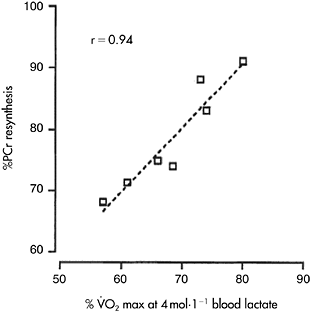
Figure 7.7 Relationship between percentage maximal oxygen uptake  corresponding to a blood lactate concentration of 4mmol·l−1 and percentage PCr resynthesis after 4min of passive recovery following a maximal 30s cycle ergometer sprint
Source: Reprinted with permission from Bogdanis et al., 1996. J Appl Physiol, 80, 880, Figure 4. Copyright 1996 by The American Physiological Society. Used with permission.
peripheral adaptations on PCr resynthesis has also been indirectly demonstrated by the high positive correlation (r=0.89 (P<0.01)) between percentage of PCr resynthesis and endurance fitness as determined from the percentage of  corresponding to a blood lactate concentration of 4mmol·l−1 (Figure 7.7). As shown in several studies (Bogdanis et al., 1996; Casey et al., 1996; Johansen and Quistorff, 2003), increased PCr resynthesis is related to improved performance and reduced fatigue during repeated maximal exercise.
Muscle buffering capacity and ionic regulation
High-intensity static or dynamic exercise results in large changes in metabolites and ions within the working muscles (Bogdanis et al., 1995). Disturbances in the concentration of muscle hydrogen (H+), potassium (K+) and calcium (Ca2+) are linked with fatigue (McKenna et al., 2008), and thus ionic regulation becomes critical for muscle membrane excitation, contraction and metabolism.
The rapid rates of glycolysis result in lactate and H+ accumulation and a consequent reduction of muscle pH by about 0.5 (Bogdanis et al., 1995). Although the negative effect of lactate and H+ accumulation on muscle performance has been recently challenged (Allen and Westerblad, 2004; see Chapter 3), there are a number of mechanisms by which muscle activation and metabolism may be impaired (Bangsbo and Juel, 2006). Therefore, the ability to regulate H+ and lactate homeostasis during high-intensity exercise plays an important role in the fatigue process (Juel, 2008).
A number of mechanisms contribute to muscle pH regulation, including release of H+ to the blood via different transport and buffering systems (Juel, 2008). The ability of the muscle to buffer the build-up of free H+ is termed “muscle-buffering capacity” (βm) and is considered an important determinant of high-intensity exercise performance. βm is measured on a muscle biopsy sample using titration with acid, and is expressed as the number of micromoles of H+ that are required to decrease pH by one unit from 7.1. The intracellular contents of protein (histidine residues), inorganic phosphate and the dipeptide carnosine, have been identified as important physicochemical buffers that can be affected by training status (Parkhouse and McKenzie, 1984). A high βm may favourably affect high-intensity performance by allowing anaerobic glycolysis to continue, resulting in a larger lactate (and thus energy) production without a concomitant increase in H+ accumulation.
Bishop et al. (2004) were the first to report a correlation between work decrement (percentage fatigue) and βm during a test using five 6s sprints (r=−0.72 (P<0.05)) in untrained females. The correlation of βm with fatigue in that study was greater than that obtained from aerobic fitness indices, such as  (r=−0.62 (P<0.05)) or lactate threshold (r=−0.56 (P<0.05)), implying that the ability of the muscle to buffer H+ is important for maintaining performance during brief repeated bouts. More recently, Edge et al. (2006b) measured βm and repeated-sprint ability in team-sport athletes, endurance athletes and untrained but physically active females. The authors hypothesised that team-sport players would have higher βm than the other two groups, because of the frequent high-intensity exercise bouts during training and competition. Indeed, the team-sport group had a significantly higher βm than either the endurance-trained or the untrained groups (181±27μmol H+·g dry muscle−1·pH−1 versus 148±11μmol H+·g dry muscle−1·pH−1 versus 122±32μmol H+·g dry muscle−1·pH−1 (P<0.05)). Also, the team-sport group completed significantly more total work than the other two groups (299±27J·kg−1 versus 263±31J·kg−1 versus 223±21J·kg−1 (P<0.05). The authors confirmed their hypothesis, suggesting that either team-sport athletes develop high βm to cope with the high rates of lactic acid production and high concentrations of H+, or alternatively, those with a greater βm are attracted to team sports that involve repeated high-intensity efforts (Edge et al., 2006b).
Neural factors
Training background has an impact on the functional organisation of the neuromuscular system, and power-trained athletes have been shown to be more affected by fatiguing exercise than endurance athletes (Paasuke et al., 1999). The contribution of neural factors to muscle fatigue can be examined by measuring the electromyographic (EMG) activity of the agonist and antagonist muscles, as well as the level of voluntary activation of motor units by the twitch interpolation method (see Chapter 2). With the later method it is feasible to quantify the failure of an individual to mobilise all the motor units of a given muscle.
Mendez-Villanueva et al. (2008) measured changes in EMG activity of the vastus lateralis muscle during ten 6s sprints interspersed by 30s rest intervals. When compared with the first sprint, the decrease in the normalised EMG amplitude (root mean square: RMS) was 9.2% and 14.3% in the fifth and tenth sprint, respectively. There was a very high correlation (r2=0.972) between total work and EMG amplitude in the tenth sprint, expressed as a percentage of first-sprint values, suggesting that fatigue is accompanied by reductions in neural drive and muscle activation, as confirmed in another similar experiment (decrease in voluntary activation from 95% to 91.5% (P<0.02) (Racinais et al., 2007). The opposite finding, i.e. an increase rather than a decrease in EMG RMS, was found in a similar study that measured force and EMG during an MVC after a ten 6s sprints protocol (Billaut et al., 2006), suggesting peripheral rather than central mechanisms of fatigue. Although there is no consensus regarding the changes in EMG RMS during maximal repeated-sprint exercise, a common finding in many studies is that fatigue in maximal exercise is characterised by a shift in the EMG power spectrum of the muscles involved, suggesting selective fatigue of fast-twitch fibres (Kupa et al., 1995; Billaut et al., 2006). Consequently, it may be proposed that individuals with a higher percentage of fast fibres would have the largest shifts in EMG frequency.
Another neuromuscular characteristic that may vary with training status is voluntary activation. The level of voluntary activation of a muscle during an MVC can range between 80% and 100% (Behm et al., 2002). If a muscle is activated only to 80% of its full capacity, fatigue is likely to develop at a slower rate than if it were fully activated. Nordlund et al. (2004) reported a wide range of voluntary activation (67.9–99.9%) for the plantar flexors of healthy habitually active males. A novel finding of that study was that the peripheral fatigue over nine bouts of ten brief MVCs (2s contraction, 1s rest, with 10s rest between bouts) was largely (by 58%; r2=0.58) explained by the level of MVC torque and the percentage of voluntary activation during the first bout. This confirmed the suggestion that those who cannot fully activate their muscles fatigue less. An interesting suggestion made by Nordlund et al. (2004) was that individuals who do not fully activate their muscles do not recruit all of their fast-twitch motor units. This is based on the “size principle” of fibre activation, i.e. slow motor units are recruited before the fast ones as force is increased. Thus, failure to recruit all fast-twitch fibres results in less metabolic disturbances and less fatigue during a certain task.
The possible differences in voluntary activation between individuals of varied training status were examined by Lattier et al. (2003). An expected finding was that power-trained athletes had higher maximal rate of force development and MVC force of the knee extensors than the endurance athletes. However, power- and endurance-trained athletes had a similar maximal voluntary activation of the knee extensors (~80%), which was higher than that measured in a sedentary group (~65%). Thus, the results of that study suggest that there are no differences in muscle activation between well-trained athletes, irrespective of the type of training (endurance versus sprint training), but sedentary individuals may have a significant maximal activation deficit (Lattier et al., 2003).
Fatigue during high-intensity dynamic contractions may be exacerbated by the contraction of the antagonist muscles. The level of coactivation of the antagonists would decrease the effective force or power generated by a joint, especially during faster movements where neuromuscular coordination is more important (Hautier et al., 2000). Garrandes et al. (2007) reported that the coactivation level of the antagonist muscles during knee extension was increased by 31 % after fatigue only in power-trained and not in endurance athletes. Also, another comparative study reported four times higher hamstrings coactivation during isokinetic knee extensions in sprinters compared with distance runners (57% versus 14%), probably indicating a sport-specific adaptation (Osternig et al., 1986). Thus, it may be argued that a very important neural factor that modifies fatigue in individuals with different training backgrounds is the antagonist coactivation level. The higher antagonist coactivation in sprint/power-trained individuals may partly explain their greater fatigue during dynamic exercise, since part of the agonist force/power is lost to overcome antagonist muscle activity.
Key points (training background and fatigue)
• Endurance-trained athletes fatigue less and sprint/power-athletes fatigue more during high-intensity exercise.
• Individuals with a greater proportion of type I fibres would be more fatigue-resistant compared with individuals with a greater proportion of type IIA and type IIX fibres.
• Aerobic fitness plays an important role in the ability to resist fatigue during high-intensity exercise by enhancing aerobic contribution to energy supply and the rate of resynthesis of PCr during repeated bouts of high-intensity exercise.
• To deal with the higher rates of lactate and H+ production, team-sport players have higher βm than endurance-trained athletes.
• Individuals who have a low percentage of maximal voluntary muscle activation (such as some sedentary individuals) do not recruit all of their fast-twitch motor units, and thus fatigue less during intense exercise.
• The coactivation of antagonist muscles during high-intensity exercise is much higher in sprint/power-trained athletes than in endurance athletes, and may partly explain their greater fatigue during dynamic exercise.
INCREASES IN ACTIVITY LEVEL AND FATIGUE: EFFECTS OF SYSTEMATIC TRAINING
Human skeletal muscle is a highly plastic tissue and adapts to the variable functional requirements by adjusting its size (D’Antona et al., 2006), muscle fibre type expression and myosin phenotype (Malisoux et al., 2007) and energy metabolism (Green and Pette, 1997). Changes in functional demands also result in neural adaptations that affect muscle performance, such as increased neural drive in untrained individuals.
The adaptations that may reduce fatigue during high-intensity exercise vary with the characteristics of the training programme, namely type (sprint, endurance, resistance training), intensity and duration. The most relevant adaptations regarding fatigue concern changes in fibre type characteristics, enzyme activity, regulation of ionic balance (Na+-H+, lactate) as well as changes in EMG activity.
Fibre type transformations after training
Sprint and strength training
As seen in Table 7.1, fibre type distribution according to MHC content is different between athletes of various sports and reflects the functional and metabolic requirements of each sport. For example, endurance athletes are characterised by a high percentage of type I fibres (65%), while sprinters have 60% of fibres containing fast (IIA and IIX) MHC isoforms (Table 7.1). One may argue that this may be the result of natural selection, i.e. individuals follow the sport that they are suitable for in terms of physical attributes. However, training studies show that it is possible to attain some degree of MHC transformation (Malisoux et al., 2007). The transitions between MHC isoforms are done in a sequential, reversible order determined by the neural impulse patterns, the mechanical loading characteristics and by alterations in the metabolic homeostasis, as follows (Pette, 1998):
type I ↔ type IIA ↔ type IIX |
|
The fibre types must be viewed as a spectrum that includes hybrid fibres co-expressing I and IIA or IIA and IIX MHC isoforms. Moreover, there is growing evidence suggesting that the functional properties of muscle fibres can change in several physiological and pathological conditions with no shift in myosin isoform. This does not negate the important role of muscle fibre composition on fatigue, but rather shows that a “fine tuning” of one or more characteristics of a given fibre may occur, according to functional demands (Malisoux et al., 2007).
Training for sprint and power sports involves short maximal exercise bouts of high power output. Thus, a switch towards the type IIX fibres that generate high power output would be expected. However, a consistent finding of sprint and strength training studies is that the MHC IIX isoforms are down regulated and there is usually a bidirectional change towards IIA at the expense of both I and IIX MHC isoforms (Andersen et al., 1994; Widrick et al., 2002). In the study of Andersen et al. (1994), a group of sprint athletes (n=6) were trained intensively using strength and interval training for a period of three months. After training there was a decrease in fibres containing only MHC I isoform (52.0±3.0% versus 41.2±4.7% (P<0.05)) and an increase in the amount of fibres containing only MHC IIA isoform (34.7±6.1% versus 52.3±3.6% (P<0.05)). Fibres showing co-existence of MHC IIA and IIX isoforms decreased with training (12.9±5.0% versus 5.1±3.1% (P<0.05)). Only one out of 1,000 fibres analysed contained only MHC isoform IIX.
Studies examining the functional adaptations at the single-fibre level after sprint and strength training show that they depend mostly on increases in fibre cross-sectional area (CSA), since the force per CSA remains unchanged in most studies (Widrick et al., 2002; Malisoux et al., 2007). However, there are some suggestions for increased force per fibre CSA after body-building training (D’Antona et al., 2006). Maximal shortening velocity of single fibres also seems to be unchanged after resistance (Widrick et al., 2002) or sprint training (Harridge et al., 1998) in healthy young individuals. There is, however, some evidence suggesting that plyo-metric training may be effective in increasing maximal shortening velocity in single fibres (Malisoux et al., 2007).
Endurance training
The model of chronic low-frequency stimulation has been used over the past 40 years to demonstrate muscle plasticity. This protocol involves electrical stimulation of the nerve of an animal and shows a remarkable degree of transformation of fast, fatigable muscles towards slower, fatigue-resistant ones in terms of both fibre type and metabolism (Pette and Vrbova, 1999). This demonstrates that activity may have a large impact on the phenotype and fatigue profile of skeletal muscle. The closest equivalent to this type of activity in exercise training on humans is endurance exercise. However, the effects on muscle fibre type transitions after endurance training are less radical than those obtained by chronic electrical stimulation. Andersen and Henriksson (1977) reported no increase in the percentage of type I fibres, but an increase in type IIA at the expense of type IIX fibres after eight weeks of endurance training. Another study using previously untrained individuals who were trained for 13 weeks in order to complete a marathon, showed a decrease in slow (MHC I) and fast (MHC IIA) fibre CSA by about 20%, but an increase in the percentage of MHC I fibres (from 48±6% to 56±6% (P<0.05)), while the percentage of MHC IIA fibres remained unchanged (30±5%) (Trappe et al., 2006). A significant finding of that study was that single-fibre muscle power expressed per unit fibre volume as measured in vitro, was increased by >70% in both MHC I and IIA fibres. These increases of power demonstrate that high volume endurance training (30–60km running per week) can modify the functional profile of the fibres that are most involved.
From the previous discussion, it seems that fibre type profile can be affected to some extent by sprint/power- and endurance-training in healthy individuals. The implications of changes in MHC isoform expression with training on muscle fatigue during high-intensity exercise can not been examined in isolation. The bidirectional shifts of fibre types towards IIA, with decreases in type I and IIX isoforms makes it difficult to predict if peak power will increase, decrease or remain unchanged, and whether fatigability will change in any direction. However, changes in fatigability observed after training cannot and should not be explained solely by fibre type transformations. Other factors such as muscle metabolic properties and neural activation patterns play an important role in fatigue resistance and should also be considered.
Muscle enzymes
It has long been shown that some metabolic characteristics such as the activities of aerobic and anaerobic enzymes may increase in the exercising muscle, without noticeable MHC-based fibre type transitions (Pette, 1998).
Sprint training with repeated short bouts (<10s)
The majority of investigations have noted increases in glycolytic enzyme activity after sprint training (Linossier et al., 1993, 1997; Dawson et al., 1998). Typically, these adaptations concern key enzymes of glycolysis, such as glycogen phosphorylase, phosphofructokinase (PFK) and lactate dehydrogenase (LDH). Linossier et al. (1993) trained young students for seven weeks with four sessions per week of short (5s) repeated cycle ergometer sprints with 55s resting intervals. The number of sprints was increased every week from 16 to 26 sprints per session. This programme resulted in increased energy production from anaerobic glycolysis, as indicated by the increased muscle lactate accumulation after compared to before training (Δ lactate 37.2±17.9 versus 52.8±13.5 (P<0.01)) and the 20% higher PFK and LDH activity. A similar training study by Dawson et al. (1998) involving short running sprints of comparable duration to the previous study (30–60m) found a 40% increase in phosphorylase, but no increase in PFK. A common finding of these two studies involving short sprints was that the activities of key oxidative enzymes involved in carbohydrate metabolism, e.g. citrate synthase (CS), or lipid oxidation, e.g. 3-hydroxyacyl-CoA dehydrogenase (HAD), were either unchanged (Linossier et al., 1993, 1997) or decreased (Dawson et al., 1998) with this type of training.
Sprint training with repeated long bouts (30s)
However, sprint-training studies using longer sprint bouts, i.e. 30s cycle ergometer sprints, showed increases in oxidative enzymes as well. In one study (MacDougall et al., 1998), participants trained three times per week for seven weeks and performed 30s sprints with 3–4 min rest in each session. The number of sprints increased progressively from four to ten per session. The training programme resulted in significant increase in the total work during the last three of the four 30s sprints separated by 4min rest. This was accompanied by a 49% increase in PFK activity (P<0.05) and 36% and 65% increases in CS and succinate dehydrogenase (SDH) (P<0.05). Also, an increase in  from 51.0±1.8 to 54.5±1.5 (P<0.05) was found, suggesting that repeated long sprints (30s) constitute a powerful aerobic stimulus. In a similar training study with repeated 30s cycle ergometer sprints, there was a 7.1% increase in mean power over a 30s sprint and an 8% increase in
  (Barnett et al., 2004). Interestingly, these authors reported a 42% increase in CS activity but no increase in PFK or anaerobic energy provision from PCr or glycolysis. They suggested that the improvement in 30s sprint performance was probably mediated by increased energy provision from oxidative metabolism.
Sprint training versus traditional endurance training
More recent studies have focused on the repeated 30s sprint protocol as an efficient way to increase oxidative potential of the muscle. A series of studies by Burgomaster et al. (2005, 2006, 2008) have shown that training with repeated 30s sprints results in large increases in oxidative enzymes such as CS, cytochrome c oxidase (COX) and HAD. The most important outcome of these training studies is that the adaptations to the repeated-sprint training programme were similar to those resulting from traditional endurance training. For example, following the pioneering study by Burgo-master et al. (2005), the same group (Gibala et al., 2006) compared the repeated-sprint training protocol (i.e. between four and six 30s sprints with 4min rest intervals, per session) with traditional endurance exercise (e.g. 90–120 min of continuous cycling at 65%  ) performed three times per week for two weeks. The two protocols resulted in similar increases in muscle oxidative capacity, as reflected by the activity of COX, and a similar improvement in an endurance time trial (by 10.1% and 7.5%). It should be noted that continuation of training for four more weeks did not result in any further changes in COX and CS, suggesting that the adaptations in oxidative enzymes occur early in the training process (Burgomaster et al., 2008).
In a subsequent study Burgomaster et al. (2006) reported that this type of repeated-sprint training resulted in an increased activity of the active form of pyruvate dehydrogenase (PDH), and this was accompanied by reduced glycogenolysis (100±16mmol·kg−1 dry weight versus 139±11mmol·kg−1 dry weight (P=0.03) and lower lactate accumulation probably due to a greater mitochondrial pyruvate oxidation. The lower level of acidification due to decreased glycogenolysis will contribute to reduced fatigability following this type of training.
Molecular signalling for mitochondrial adaptations
A key regulator of oxidative enzyme expression in skeletal muscle is peroxisome proliferator-activated receptor-γ coactivator-1α (PGC-1α). PGC-1α coordinates mitochondrial biogenesis, by interacting with various nuclear genes encoding for mitochondrial proteins. Previous work has shown that muscle-specific overexpression of PGC-1α results in the conversion of the muscle from glycolytic to oxidative, with a dramatic upregulation of typical oxidative genes/proteins like COX. This indicates that simply by overexpressing PGC-1α, muscles obtain the characteristics and fatigue resistance found in the endurance-trained state. Calvo et al. (2008) demonstrated these characteristics in PGC-1α transgenic mice which exhibited greatly improved exercise performance and 20% higher peak oxygen uptake compared with wild-type control mice. The fact that PGC-1α protein content in the vastus lateralis muscle was equally increased with the repeated-sprint training protocol as with a prolonged cycling protocol (40–60min at 65%  ) after six weeks of training (Burgomaster et al., 2008) demonstrates the potential of the repeated-sprint protocol for mitochondrial adaptations. As suggested by Coyle (2005), one of the advantages of the repeated-sprint protocol over the traditional endurance exercise lays on the high level of type II muscle fibre recruitment that is not achieved in the traditional low-intensity endurance exercise. Thus, the mitochondrial adaptations that occur in type II fibres after sprint training are absent when endurance training is performed. These adaptations of type II fibres would increase their fatigue resistance, but the exact effect of this mechanism of adaptation has yet to be determined.
Capillarisation and blood flow
Capillary supply and fatigue resistance
The model of chronic low frequency stimulation of animal muscles has shown that fatigue resistance increases in parallel with an enhanced oxidative capacity. However, fatigue resistance reaches its maximum while CS activity continues to rise (Simoneau et al., 1993). The dissociation between these changes points to additional factors, such as enhanced perfusion and proliferation of capillaries playing an important role in fatigue resistance (Pette and Vrbova, 1999).
The role of capillary supply for lactate elimination after intense exercise has long been suggested (Tesch and Wright, 1983). In addition to the role of the different lactate and H+ transport mechanisms out of the exercising muscle, improved perfusion contributes to the increased release from muscle to the blood (Juel, 2008). This may be accomplished by improved microcirculation following training. The influence of intermittent intense leg extension training for seven weeks (1min exercise, 3min rest for one hour at ~150% of leg  3–5 times weekly) on capillary growth was examined by Jensen et al. (2004). They reported an increase of capillary-to-fibre ratio from 1.74±0.10 to 2.37±0.12 capillaries per fibre, and a 17% increase in capillary density. A similar (20%) increase of capillaries in contact with type I and type II muscle fibres was found after training. This would increase oxygen extraction and facilitate aerobic metabolism during exercise, as well as PCr resynthesis during the recovery intervals. As shown in another similar study by Krustrup et al. (2004), the positive effects of increased muscle oxygen uptake, blood flow and vascular conductance are observed in the initial phase of high-intensity exercise, facilitating a faster adjustment of aerobic metabolism.
Peripheral adaptations involving increased mitochondrial function and capillary supply may also explain the faster time constant of PCr resynthesis (from 25.4±1.7s to 21.2±1.7s (P<0.05)) after two weeks of endurance training, reported in one of the few studies examining PCr resynthesis after training (McCully et al., 1991).
Regulation of ionic balance
Improvement of K+ regulation with sprint training
The marked increases in extracellular K+ that are commonly observed during high-intensity exercise contribute to muscle fatigue by causing depolarisation of the sarcolemmal and t-tubular membranes (McKenna et al., 2008). An increase in Na-K+ adenosine triphosphatase (ATPase) activity caused by systematic training has been shown to contribute to the control of K+ homeostasis and reduce fatigue.
In a recent study Iaia et al. (2008) took endurance athletes who were regularly training using long-distance running, and switched their training into repeated sprinting (between eight and 12 30s running sprints at 90–95% of maximal speed, with 3min rest intervals), four times per week for four weeks. A matched control group continued training for that four-week period with endurance training, as before the study with 40–60 min continuous runs. This switch to sprint training resulted in an increase of the muscle Na+-K+ ATPase α1-subunit by 29%, with a concomitant decrease in plasma K+ concentration during exercise. Also, performance in a 30m sprint test and running time to exhaustion at ~130%  increased by 7% and 27% (P<0.05). No changes in
  or 10km running time were seen.
In another study, Mohr et al. (2007) compared the effects of two different intense training regimens on changes in muscle ATPase subunits and fatigue. Participants were divided into a sprint-training group (15 6s sprints with 1min rest intervals) and a speed endurance group (eight 30s runs at 130%  with 1.5min rest intervals). Training was performed 3–5 times per week and lasted for eight weeks. The fatigue index during a repeated-sprint performance test (five 30m sprint running test with 25s active recovery), calculated as the difference between the best sprint time and the time for the fifth sprint, was significantly reduced (by 54%) only in the speed endurance group, and remained unchanged in the sprint group. The reduction in fatigue was accompanied by a 68% increase in Na+−K+ ATPase isoform α2 and a 31% increase in the amount of the Na+/H+ exchanger isoform, only in the speed endurance group. It must be noted that during each session of speed endurance training, blood lactate (peak values: 14.5−16.5mmol·l−1) and plasma K+ (peak value ~6.4mmol·l−1) were higher compared to the sprint-training responses (peak blood lactate: ~8.5mmol·l−1 and peak K+: ~5.5mmol·l−1).
Collectively, the results of the above studies suggest that high-intensity exercise in the form of repeated 30s bouts constitutes a better stimulus for K+ regulation during exercise, compared with both continuous endurance training and short (~6s) sprint training. This is probably related to the significant disturbance of muscle and blood ion homeostasis caused by this type of high-intensity exercise and may explain part of the greater increase in fatigue resistance after training (Mohr et al., 2007).
Lactate and H+ regulation
The pH regulating systems in skeletal muscles are very responsive to high-intensity training (Juel, 2008). During high-intensity exercise and the subsequent recovery period, muscle pH is regulated by three systems: (a) lactate/H+ co-transport by two important monocarboxylate transporter proteins: MCT1 and MCT4; (b) Na+/H+ exchange by a specific exchanger protein; and (c) Na+/bicarbonate transporters (Juel, 2008). Of those systems, the MCT1 and MCT4 transporters are the most important during exercise, and thus their changes following training have been studied in animal and human muscle. Thomas et al. (2007) reported that high-intensity training of rats for five weeks resulted in changes of 30% and 85% in the MCT1 and Na+/bicarbonate transporter, respectively, while MCT4 remained unchanged. In humans, changes in the Na+/H+ exchanger protein levels by 30% have been reported in the four-week high-intensity sprint-training study of Iaia et al. (2008), mentioned in the previous section. Moreover, significant increases in MCT1 and Na+/H+ exchanger protein densities have been found after high-intensity training, especially when training bouts cause a significant accumulation of H+ in the muscle (Mohr et al., 2007). Increased expression of lactate and H+ transporters results in faster H+ and lactate release (see Juel et al., 2004, key paper 5). The improved lactate and H+ transport out of the muscle results in higher muscle lactate production measured at exhaustion (Mohr et al., 2007), suggesting that adaptations of these acid-balance regulatory systems improve performance by allowing greater contribution of glycolysis to energy supply.
Changes in muscle buffering capacity
The ability to buffer the build-up of free H+ in the muscle during high-intensity exercise is an important determinant of fatigue resistance during sprint exercise (Bishop et al., 2004) and is greater in sprint-trained athletes and team-sport players compared to endurance-trained athletes (Edge et al., 2006b). Thus, it may be inferred that the intensity of training may be an important stimulus to increase in βm.
To test this hypothesis, Edge et al. (2006a) trained recreationally active female team-sport players for five weeks (three days per week), using two protocols with different intensity, but matched for total work. The high-intensity group performed between six and ten 2 min bouts of cycling with 1min rest intervals at an intensity that was 120–140% of that corresponding to the blood lactate threshold. The moderate-intensity group performed continuous exercise at 80–95% of that corresponding to the lactate threshold for 20–30min, so that the total work was the same as the high-intensity group. Blood lactate at the end of a typical training session was 16.1±4.0 mmol·l−1 for the high-intensity group and only 5.1±3.0mmol·l−1 for the moderate-intensity exercise group.
Although  and the intensity corresponding to lactate threshold were equally improved in the two groups by about 10–14%, only the high-intensity group showed a significant increase in βm measured in vitro at 25% (from 123±5μmol H+·g dry muscle−1·pH−1 to 153±7μmol H+·g dry muscle−1·pH−1 (P<0.05)), while no changes were observed in the moderate-intensity group. The improvement in repeated-sprint exercise (five 6s cycling sprints with 24s rest) was also greater in the high-intensity compared with the moderate-intensity group (13.0% versus 8.5% (P<0.05)) (Edge et al., 2005). These results highlight the contribution of βm to the increase in fatigue resistance observed after training, and emphasise the importance of training intensity for favourable adaptations to occur.
Key points (effects of systematic training)
• Fibre type transformation during exercise training is usually towards the intermediate type IIA isoform at the expense of both type I and type IIX MHC isoforms.
• Sprint training with repeated short bouts (<10s) results in increased activity of glycolytic enzymes such as glycogen phosphorylase, PFK and LDH, with little or no increase in oxidative enzymes.
• Training with longer sprints (30s) results in significant increases not only in glycolytic enzymes, but also in oxidative enzymes, such as CS, COX and PDH.
• A remarkable increase in endurance performance is attained when training with four to six 30s sprints with 4min rest intervals, even after six training sessions over two weeks.
• The advantages of the repeated-sprint protocol over the traditional endurance exercise, lays on the high level of type II muscle fibre recruitment that is not achieved in the traditional low-intensity endurance exercise.
• Muscle capillarisation of both slow and fast fibres is increased with high-intensity training, and this results in enhanced fatigue resistance due to improved oxygen extraction, PCr resynthesis and removal of H+ and lactate.
• Repeated 30s bouts of high-intensity exercise are an effective method of increasing fatigue resistance, through expression of specific proteins (MCT1, Na+-H+ exchanger, Na+-K+ ATPase) that improve regulation of K+, H+ and lactate ions.
• High-intensity training that results in high rates of muscle and blood lactate accumulation is necessary to increase m and delay fatigue during repeated sprinting.
REDUCTIONS IN ACTIVITY LEVEL AND FATIGUE: EFFECTS OF DETRAINING AND IMMOBILISATION
Effects of detraining
Detraining is a period of insufficient or reduced training stimulus that causes various adaptations to both skeletal muscle and the nervous system. By definition, during a detraining period, there is a partial or complete reversal of the training-induced adaptations, thus compromising performance. However, there is evidence to suggest that muscular and neural adaptations may be reversed at different rates, while muscle fibre phenotype may be altered towards an unexpected direction, i.e. an overshoot of the MHC IIX isoform relative to the pre-training levels (Andersen and Aagard, 2000).
Neuromuscular adaptations and fibre type shifts
The changes in force-velocity relationship, EMG activity and muscle CSA following the cessation of heavy resistance training were examined by Andersen et al. (2005). The participants were sedentary young males who trained their knee extensors three times per week for three months. The exercises performed in every session for 4–5 sets each were leg press, hack squat, knee extensions and leg curls, while loads ranged from 10–12RM in the first sessions, to 6–8 RM in the later training phase. Testing was performed before the start of training, after three months of training and again three months after detraining. In response to training, anatomical quadriceps CSA and EMG were increased by 10%. Also, isokinetic muscle strength at 30°·s−1 and 240º·s−1 was increased by 18% (P<0.01) and 10% (P<0.05), but power, velocity and acceleration of unloaded knee extension was unchanged. The proportion of MHC IIX decreased from 5.6±0.8% to 0.8±0.3% (P<0.001), whereas that of MHC IIA increased from 34.0±2.5% to 39.4±2.0% (P<0.001). After three months of detraining, isokinetic CSA, EMG and muscle strength and power at 30°·s−1 and 240º·s−1 returned to pre-training levels. However, unloaded knee extension angular velocity and power were increased remarkably by 14% and 44% in relation to pre- and post-training. This was accompanied by an increase in MHC IIX isoform from 0.8±0.3% to 7.7±1.1%, which was significantly higher compared with both pre- and post-training levels (P<0.001). Furthermore, the rate of force development during an electrically evoked twitch was increase by 23%, further indicating the changes in contractile properties of the muscle. A similar fibre type shift towards the MHC IIX isoform had been reported previously and to a larger extent (from 2.0±0.8% to 17.2±3.2%, P<0.01), following a similar protocol of training and detraining (Andersen and Aagard, 2000). These authors also noted a tendency for a selective decrease in type II fibre size with detraining.
Changes in muscle enzymes and capillarisation
One of the main characteristics of muscular detraining is a marked decrease in oxidative capacity, as indicated by a marked reduction in mitochondrial enzyme activities. Linossier et al. (1997) reported that after ten weeks of sprint training with two series of fifteen 5s sprints separated by 55s rest intervals, four times per week, peak power increased by 28%, while  by only 3%. This was accompanied by higher activities of glycolytic enzymes such as glycogen phosphorylase (9%), PFK (17%) and LDH (31%), while there were no changes in the oxidative enzymes CS and HAD. After seven weeks of detraining, the gains in peak cycling power were maintained, but there was a decrease in
  4%, accompanied by a decrease in the oxidative markers CS and HAD at or below the pre-training values, with no change in glycolytic enzymes. Similar results suggesting that detraining of that length has negligible effects on glycolytic enzymes but exerts a significant effect on oxidative enzymes have also been reported following a mixed continuous and high-intensity interval 15-week training programme, interrupted for seven weeks (Simoneau et al., 1987). However, some studies have reported decreases in glycolytic enzymes in highly trained athletes who stop training for 4–8 weeks (Mujika and Padilla, 2001).
As shown earlier, changes in muscle capillarisation constitute an important part of adaptation to both aerobic and high-intensity training. The effects of training cessation on capillary density have not been established clearly, with contradictory results being reported. Coyle et al. (1984) measured changes in aerobic performance and capillarisation in endurance-trained individuals who stopped training for a period of 84 days. They reported that although  and CS and SDH activity were decreased early in the detraining period (−7%, −17.1% and −18.5% in 12 days, respectively), skeletal muscle capillarisation was unchanged during the 84 day detraining, whether expressed as capillaries around a fibre, capillaries per fibre or capillaries per mm2. However, another study by Klausen et al. (1981), using a period of endurance training followed by detraining in previously sedentary individuals, showed an increase in all indices of fibre capillarisation by 20–30% for all fibre types. During eight weeks of detraining, the number of capillaries around each fibre returned to pre-exercise values, but the number of capillaries per mm2 remained at the post-training level due to a decrease in muscle fibre area. The authors argued that this may point to a favourable long-term effect on the average diffusion distance.
Thus, detraining seems to affect mostly aerobic metabolism, with decreases in oxidative enzymes and  while anaerobic performance and power seem to be maintained, or even increased, as seen in the case of unloaded knee extension (Andersen et al., 2005), due to the shift of MHC composition towards the fast IIX isoform. However, one should keep in mind that muscle fibre area, especially of the fast fibres, is reduced during detraining, and this would reduce the power generated, especially when the movement is performed against a load (e.g. body weight) or an athletic implement (e.g. shot or javelin).
Detraining and muscle fatigue
Little is known about the effects of changes in muscle fibre composition and enzymatic profile on muscle fatigability following detraining. However, it may be speculated that the maintenance of the gains in peak power (Linossier et al., 1997), together with the decreases in muscle oxidative capacity and the increases is the faster, more fatigable MHC IIX isoform, would increase fatigue during high-intensity exercise following a period of detraining. However, a short (approximately two-week) “tapering” period of decreased training volume (by 40–60%), without changes in training intensity and frequency, is commonly used by athletes to maximise performance gains (Bosquet et al., 2007). This short period of reduced training volume would take advantage of the positive adaptations of detraining, while at the same time would avoid the negative long-term effects of reduced activity.
Effects of immobilisation/disuse
Changes in muscle mass and function
Short term immobilisation of a muscle or a limb may be necessary after an acute injury. In cases where bed rest is required due to illness, gravitational unloading, especially of the leg muscles, is an “unwanted” consequence. One of the first negative adaptations to immobilisation is a decrease in muscle size, i.e. muscle atrophy, accompanied with decreases in functional capacity. Many experimental models, such as space flight, hind limb suspension in animals, immobilisation of joints and denervation have been used to study the effects of disuse on skeletal muscle (Degens and Alway, 2006).
The loss of muscle strength during a period of 4–6 weeks of unloading has been largely attributed to the loss of contractile proteins (Degens and Alway, 2006). However, neural factors are also involved, and this is demonstrated by unloading interventions lasting less than two weeks. Deschenes et al. (2002) hypothesised that the loss of strength resulting from a two-week unilateral lower limb unloading was due to impaired neural activation of the affected muscle. The lower limb of healthy young college students was immobilised in a lightweight orthopaedic knee brace at an angle of 70°, so as to eliminate weight-bearing activity. After two weeks of immobilisation, peak isokinetic torque of the knee extensors across a range of velocities was reduced by an average of 17.2%, with greater losses in slow than in fast contraction velocities. The reduction in torque was coupled by reduced EMG activity, but the ratio of total torque/EMG was unchanged (neuromuscular efficiency ratio). Muscle fibre composition remained unchanged in the two-week unloading period.
Changes in fatigue resistance
In the immobilisation study of Deschenes et al. (2002), fatigue resistance was assessed as the difference in total work produced during the first ten repetitions compared with the last ten repetitions, during a 30 repetition set of isokinetic knee extensions at 3.14°·s−1. By calculating this percentage decrease of work, fatigue resistance was enhanced (29.8±2.5% versus 20.6±6.5% (P<0.05)). However, the total work generated over the 30 contractions was 15% less after immobilisation (2,735.3±207.6J versus 2,339.0±163.3J (P<0.05)). As mentioned earlier in the chapter, the decreased fatigue index after immobilisation should be interpreted with caution. As also reported by the authors (Deschenes et al., 2002), this improvement was mainly due to the lower total work in the first ten repetitions after immobilisation, while total work during the last ten repetitions was unchanged.
The situation may be different when immobilisation is longer than four weeks, where there is an increased fatigability, possibly due to reductions in oxidative capacity due to decreases in CS and PDH. Indeed, Ward et al. (1986), showed that after five weeks of immobilisation, the proportion of PDH in the active form was only 52%, compared with 98% after five months of training. This resulted in greater lactate accumulation during exercise after the immobilisation period.
A decrease in capillary supply and blood flow during rest and exercise is common in the disused muscle. However, it should be mentioned that the capillary loss and reduction in maximal blood flow are largely proportional to the loss of muscle mass, maintaining blood flow per unit of muscle mass (Degens and Alway, 2006).
Key points (effects of detraining and immobilisation)
• Cessation of training for a long period (three months) following an equal period of systematic resistance training results in a complete loss of the gains in muscle CSA and EMG activity and muscle strength of concentric contractions.
• An increase in fast (MHC IIX) myosin expression above the pre-training levels is observed after detraining, and this is accompanied by increases in unloaded knee extension velocity and power. Due to muscle fibre atrophy, this shift in MHC isoform does not result in improved functional capacity, but may rather predispose towards increased fatigability.
• Detraining is characterised by large decreases in oxidative enzymes and  while the activity of glycolytic enzymes and gains in power output are better maintained during 4–8 weeks of reduced activity.
• The loss of muscle mass and strength is greater during immobilisation than detraining. However, a decrease in EMG is observed even after only two weeks of immobilisation.
• Fatigue resistance is seemingly increased following two weeks of immobilisation, but this is due to a decreased initial power output during the fatiguing test.
• Longer periods of immobilisation (greater than four weeks) result in increased fatigability due to reductions in muscle oxidative capacity and capillary supply.
CASE STUDY EXAMPLE: PROBLEM AND RESOLUTION—REDUCTION OF FATIGUE IN SOCCER
Background
Perhaps the most difficult, but also very fascinating, part of a theory development is when it is tested in real-life conditions. Fatigue during soccer play has an impact on both physical and technical performance, especially in the second half and towards the end of the match (Mohr et al., 2003). This is, in many cases, the time when the opponents may take advantage of the reduced performance and win a match. Therefore, the ability of players to resist fatigue and maintain their high-intensity running ability towards the end of a match is an important goal of physical conditioning.
Advances in technology of match analysis using image recognition systems have allowed quantification of individual performances during a match. The distance covered with high-intensity running (speed: 14.4–19.8 km·h−1), very high-intensity running (speed: 19.8–25.2 km·h−1) and sprinting (speed: >25.2 km·h−1), seem to be the most sensitive indicators of fatigue during the match, and differentiates top class from moderate-level players (Mohr et al., 2003). On the other hand, total distance run during a match is not always indicative of performance, and teams covering the same distance in a match may have totally different speed profiles.
Problem
The questions then arise:
1 What is the appropriate training regimen for improving fatigue resistance in demanding and long-lasting repeated-sprint sports such as soccer?
2 How can we use the findings of the recent studies to assist coaches and fitness trainers to delay fatigue in repeated-sprint sports?
Resolution: repeated-sprint training
Repeated short bouts
One recently emerging training strategy concerning physical conditioning for football is the use of repeated sprints. A very recent study (Bravo et al., 2008) compared the effects of the commonly used high-intensity aerobic interval training (four 4min runs at 90–95% of maximal heart rate, with 3min active recovery) with repeated-sprint training (three sets of six 40m all-out “shuttle” sprints with 20s passive recovery between sprints and 4min between sets). A “shuttle” sprint involves changes in direction of sprinting by 180° every 10m (first three training weeks) or every 20m (remaining four weeks). Surprisingly, the repeated-sprint group, compared with the aerobic interval training group, showed a greater improvement, not only in repeated-sprint performance, but also in the soccer-specific “yo-yo” intermittent recovery test (28.1% versus 12.5% (P<0.01)). This test consists of 20m shuttle runs with increasing speed, with 10s of active recovery between runs until exhaustion. This usually covers 1.8–2.5km. A similar improvement in  (6%) was found for the two groups. These findings suggest that repeated-sprint training may be very effective to improve aerobic football-specific fitness.
Repeated longer (30s) bouts
Repeated bouts of 30s high-intensity running/sprinting with recovery intervals of 1.5–3min can be used to achieve adaptations that improve ionic balance regulation (K+, H+, and lactate) and thus delay fatigue during high-intensity exercise. The results of two recent studies (Mohr et al., 2007 and Iaia et al., 2008) suggest that increases in ionic transport proteins and Na+−K+ ATPase enable faster recovery during repeated sprints. However, single-sprint performance is not increased with this method, and thus it has to be used in conjunction with short sprint training.
Caution
Although the above methods will result in improved performance and reduced fatigue within 4–8 weeks, trainers should be aware that the possibility of overreaching or overtraining and the risk of injuries are increased when repeated-sprint/high-intensity training load is increased.
CONCLUSION
Individuals with different training status may exhibit large differences in fatigability during high-intensity exercise. Factors that are related to increased fatigue resistance include a high proportion of type I fibres, high  increased concentration of oxidative enzymes and capillary density, as well as high coordination between agonist and antagonist muscles. Although these features were thought to be improved mainly by endurance exercise, recent studies show that repeated-sprint exercise is a very effective and time-efficient stimulus for both aerobic and anaerobic adaptations that improve fatigue resistance and possibly promote health. However, due to the high exercise intensity, the possible risks and negative effects of this method have to be evaluated before it is applied to unhealthy populations. Finally, cessation of training results in significant decreases in oxidative enzymes and
  within 4–8 weeks, while glycolytic capacity and anaerobic performance are better maintained.
FIVE KEY PAPERS THAT SHAPED THE TOPIC AREA
Study 1. Pette, D. and Vrbová, G. (1985). Changes in muscle phenotypic expression by altered activity. Muscle and Nerve, 8, 676–689.
This highly cited review (more than 500 citations) summarised the results of chronic electrical stimulation experiments that demonstrated the plasticity of muscle. Experiments were performed on rabbit muscle in situ, by stimulating the nerve with electrodes either intermittently (for eight hours per day) or continuously (for 24 hours per day) for a long period of time. This type of chronically increased contractile activity by low-frequency stimulation induces a progressive transformation of fast- into slow-twitch muscle fibbers. Changes in the enzyme activity pattern occur already after four days and reach their maximum after 2–3 weeks. The contractile properties of the fast muscles are also modified with slowing of times to peak tension and relaxation and increased fatigue resistance. Adaptive changes also include membrane-associated proteins and transformation of the sarcoplasmic reticulum membranes. Oxygen and fuel supply and removal of metabolites and ions that may cause fatigue are also facilitated by increased capillary density, perfusion and myoglobin content. The fast to slow transformation is completed by an exchange of fast-type with slow-type myosin isoforms, which occurs relatively late in the chronically stimulated muscle. The qualitative similarity of changes evoked by long-term endurance training suggested that fast-to-slow transitions represent a regular response to increased contractile activity. Finally, the possibility that an increased activity, no matter at what frequency it is delivered, would cause a slowing of the fast muscle fibres was also proposed in that review. This suggestion was later confirmed in several studies.
Study 2. Gaitanos, G.C., Williams, C., Boobis, L.H. and Brooks, S. (1993). Human muscle metabolism during intermittent maximal exercise. Journal of Applied Physiology, 75, 712–719.
The metabolic pathways supporting energy supply during a repeated-sprint test play a major role in fatigue. Gaitanos et al. (1993) examined energy supply from anaerobic metabolism during ten 6s cycle ergometer sprints with 30s rest intervals. Anaerobic ATP production was calculated from changes in ATP, PCr, lactate and pyruvate measured in muscle biopsy samples from vastus lateralis on the first and tenth sprint. The main outcome of that study was that the contribution of anaerobic glycolysis to ATP productions was negligible in the tenth sprint, leaving PCr as the sole anaerobic energy source. The disproportionate fall in anaerobic energy supply (by 70%) and work done in the last sprint (by 27%) led to the suggestion that oxidative metabolism was probably providing the rest of the energy needed to support power generation, making the exercise much less “anaerobic” than previously thought, with significant implications for muscle fatigue.
Study 3. Bogdanis, G.C., Nevill, M.E., Boobis, L.H. and Lakomy, H.K. (1996). Contribution of phosphocreatine and aerobic metabolism to energy supply during repeated-sprint exercise. Journal of Applied Physiology, 80, 876–884.
The possible increase in oxidative metabolism to compensate for the decrease in anaerobic pathways during repeated-sprint exercise was examined by Bogdanis et al. (1996). Participants performed two 30s cycle ergometer sprints separated by 4 min rests, and muscle biopsies from vastus lateralis were taken before and after each sprint, as well as 10s into the second sprint. As also reported by Gaitanos et al. (1993), a mismatch between anaerobic energy release and power output was observed in the second sprint. It was largely compensated for by an increased contribution of aerobic metabolism that amounted to 43% of the total energy (Figure 7.6). The importance of aerobic fitness for fatigue and performance recovery was indicated by the significant correlations between  and the percentage aerobic contribution to both the first and second sprint (r=0.79 (P<0.05) and r=0.87 (P<0.01), respectively). Also, the percentage PCr resynthesis relative to the resting value was highly correlated with an index of endurance fitness (r=0.94 (see Figure 7.7)).
Study 4. Burgomaster, K.A., Hughes, S.C., Heigenhauser, G.J., Bradwell, S.N. and Gibala, M.J. (2005). Six sessions of sprint interval training increases muscle oxidative potential and cycle endurance capacity in humans. Journal of Applied Physiology, 98, 1985–1990.
Based on the increased aerobic contribution when a 30s sprint is repeated, it was proposed that this type of training can have a significant effect on aerobic metabolism and performance. Indeed, Burgomaster et al.
(2005) showed that only six training sessions performed over two weeks, with 1–2 days rest (between four and seven 30s sprints per session, with 4min rest) resulted in a significant increase in CS activity (by 38%) and a remarkable 100% increase in endurance capacity as defined by time to exhaustion at 80%  (from 26±5min to 51±11min (P<0.05). The authors have proposed the repeated 30s sprint method as a time-efficient training strategy to improve aerobic and anaerobic fitness and reduce fatigue. The extremely low time commitment (2.5min per session for five 30s sprints, or less than 20min including the 4min rest intervals) makes this method attractive, and further research is warranted to examine its possible applications in health and disease. This is because the exercise stimulus that promotes mitochondrial biogenesis also appears to stimulate other healthy metabolic adaptations in skeletal muscle, such as improved insulin action, improved lipoprotein lipase activity and greater clearance of plasma triglycerides (Coyle, 2005).
Study 5. Juel, C., Klarskov, C., Nielsen, J.J., Krustrup, P., Mohr, M. and Bangsbo, J. (2004). Effect of high-intensity intermittent training on lactate and H+ release from human skeletal muscle. American Journal of Physiology, Endocrinology and Metabolism, 286, E245–251.
This study used the one-legged knee extensor exercise model to examine changes in muscle-pH regulating systems following intense training. After a seven-week training period with fifteen 1 min bouts of single knee extensions at 150%  day, time to exhaustion was improved by 29%. The rate of lactate release at exhaustion was almost double (19.4±3.6mmol·min−1 versus 10.6±2.0mmol·min−1 (P<0.05)) and the rate of H+ release was −50% higher (36.9±3.1mmol·min−1 versus 24.2± 1.5mmol·min−1 (P<0.05)) for the trained than for the untrained leg. The membrane contents of the MCT1 lactate/H+ co-transporter and Na+/ H+ exchanger proteins were increased by 15% and 16%, while blood flow was also increase by 16% in the trained compared to the untrained leg. This study showed that when muscle is stressed with training stimuli that cause high intramuscular lactate and H+ concentration, it adapts by increasing the rate of lactate and H+ transport out of the muscle. These adaptations are done by both changes in specific membrane proteins and structural changes, such as increased capillary density (Jensen et al., 2004), that enhance blood flow and thus transport of lactate and H+ away from the working muscle.
GLOSSARY OF TERMS
ADP | adenosine diphosphate |
ATP | adenosine triphosphate |
ATPase | adenosine triphosphatase |
COX | cytochrome c oxidase |
CS | citrate synthase |
CSA | cross-sectional area |
EMG | electromyogram |
ES | electrical stimulation |
HAD | hydroxy-acyl-CoA dehydrogenase |
LDH | lactate dehydrogenase |
MHC | myosin heavy chain |
MVC | maximal voluntary isometric contraction |
PCr | phosphocreatine |
PDH | pyruvate dehydrogenase |
PFK | phosphofructokinase |
PGC-1α | peroxisome proliferator-activated receptor-γ coactivator-1α α |
RFD | rate of force development |
SDH | succinate dehydrogenase |
| maximal oxygen uptake |
| time constant of |


 response
REFERENCES
Allen, D. and Westerblad, H. (2004). Lactic acid: the latest performance-enhancing drug. Science, 305, 1112–1113.
Andersen, J.L. and Aagaard, P. (2000). Myosin heavy chain IIX overshoot in human skeletal muscle. Muscle and Nerve, 23, 1095–1104.
Andersen, J.L., Klitgaard, H. and Saltin, B. (1994). Myosin heavy chain isoforms in single fibres from m. vastus lateralis of sprinters: influence of training. Acta Physiologica Scandinavica, 151, 135–142.
Andersen, L.L., Andersen, J.L., Magnusson, S.P., Suetta, C., Madsen, J.L., Christensen, L.R. and Aagaard, P. (2005). Changes in the human muscle force-velocity relationship in response to resistance training and subsequent detraining. Journal of Applied Physiology, 99, 87–94.
Andersen, P. and Henriksson, J. (1977). Capillary supply of the quadriceps femoris muscle of man: adaptive response to exercise. Journal of Physiology, 270, 677–690.
Bangsbo, J. and Juel, C. (2006). Counterpoint: lactic acid accumulation is a disadvantage during muscle activity. Journal of Applied Physiology, 100, 1412–1413.
Barnett, C., Carey, M., Proietto, J., Cerin, E., Febbraio, M.A. and Jenkins, D. (2004). Muscle metabolism during sprint exercise in man: influence of sprint training. Journal of Science and Medicine in Sport, 7, 314–322.
Behm, D.G., Whittle, J., Button, D. and Power, K. (2002). Intermuscle differences in activation. Muscle and Nerve, 25, 236–243.
Billaut, F., Basset, F.A., Giacomoni, M., Lemaître, F., Tricot, V. and Falgairette, G. (2006) Effect of high-intensity intermittent cycling sprints on neuromuscular activity. International Journal of Sports Medicine, 27, 25–30.
Bishop, D. and Edge, J. (2006). Determinants of repeated-sprint ability in females matched for single-sprint performance. European Journal of Applied Physiology, 97, 373–379.
Bishop, D. and Spencer, M. (2004). Determinants of repeated-sprint ability in well-trained team-sport athletes and endurance-trained athletes. Journal of Sports Medicine and Physical Fitness, 44, 1–7.
Bishop, D., Edge, J. and Goodman, C. (2004). Muscle buffer capacity and aerobic fitness are associated with repeated-sprint ability in women. European Journal of Applied Physiology, 92, 540–547.
Bishop, D., Lawrence, S. and Spencer, M. (2003). Predictors of repeated-sprint ability in elite female hockey players. Journal of Science and Medicine in Sport, 6,199–209.
Bogdanis, G.C., Nevill, M.E., Boobis, L.H. and Lakomy, H.K. (1996). Contribution of phosphocreatine and aerobic metabolism to energy supply during repeated sprint exercise. Journal of Applied Physiology, 80, 876–884.
Bogdanis, G.C., Nevill, M.E., Boobis, L.H., Lakomy, H.K. and Nevill, A.M. (1995). Recovery of power output and muscle metabolites following 30s of maximal sprint cycling in man. Journal of Physiology, 482, 467–480.
Bosquet, L., Montpetit, J., Arvisais, D. and Mujika, I. (2007) Effects of tapering on performance: a meta-analysis. Medicine and Science in Sports and Exercise, 39 (8), 1358–1365.
Bottinelli, R. (2001). Functional heterogeneity of mammalian single muscle fibres: do myosin isoforms tell the whole story? Pflugers Archives, 443, 6–17.
Bravo, D.F., Impellizzeri, F.M., Rampinini, E., Castagna, C., Bishop, D. and Wisloff, U. (2008). Sprint vs. interval training in football. International Journal of Sports Medicine, 29, 668–674.
Burgomaster, K.A., Heigenhauser, G.J. and Gibala, M.J. (2006). Effect of short-term sprint interval training on human skeletal muscle carbohydrate metabolism during exercise and time-trial performance. Journal of Applied Physiology, 100, 2041–2047.
Burgomaster, K.A., Howarth, K.R., Phillips, S.M., Rakobowchuk, M., Macdonald, M.J., McGee, S.L. and Gibala, M.J. (2008). Similar metabolic adaptations during exercise after low volume sprint interval and traditional endurance training in humans. Journal of Physiology, 586, 151–160.
Burgomaster, K.A., Hughes, S.C., Heigenhauser, G.J., Bradwell, S.N. and Gibala, M.J. (2005). Six sessions of sprint interval training increases muscle oxidative potential and cycle endurance capacity in humans. Journal of Applied Physiology, 98, 1985–1990.
Calbet, J.A., De Paz, J.A., Garatachea, N., Cabeza de Vaca, S. and Chavarren, J. (2003). Anaerobic energy provision does not limit Wingate exercise performance in endurance-trained cyclists. Journal of Applied Physiology, 94, 668–676.
Calvo, J.A., Daniels, T.G., Wang, X., Paul, A., Lin, J., Spiegelman, B.M., Stevenson, S.C. and Rangwala, S.M. (2008) Muscle-specific expression of PPARgamma coactivator-1alpha improves exercise performance and increases peak oxygen uptake. Journal of Applied Physiology, 104 (5), 1304–1312.
Caputo, F. and Denadai, B.S. (2004). Effects of aerobic endurance training status and specificity on oxygen uptake kinetics during maximal exercise. European Journal of Applied Physiology, 93, 87–95.
Casey, A., Constantin-Teodosiu, D., Howell, S., Hultman, E. and Greenhaff, P.L. (1996). Metabolic response of type I and II muscle fibres during repeated bouts of maximal exercise in humans. American Journal of Physiology, 271, E38–43.
Colliander, E.B., Dudley, G.A. and Tesch, P.A. (1988). Skeletal muscle fibre type composition and performance during repeated bouts of maximal, concentric contractions. European Journal of Applied Physiology and Occupational Physiology, 58, 81–86.
Cooke, S.R., Petersen, S.R. and Quinney, H.A. (1997). The influence of maximal aerobic power on recovery of skeletal muscle following anaerobic exercise. European Journal of Applied Physiology and Occupational Physiology, 75, 512–519.
Costill, D.L., Daniels, J., Evans, W., Fink, W., Krahenbuhl, G. and Saltin, B. (1976). Skeletal muscle enzymes and fibre composition in male and female track athletes. Journal of Applied Physiology, 40, 149–154.
Coyle, E.F. (2005). Very intense exercise-training is extremely potent and time efficient: a reminder. Journal of Applied Physiology, 98, 1983–1984.
Coyle, E.F., Coggan, A.R., Hopper, M.K. and Walters, T.J. (1988). Determinants of endurance in well-trained cyclists. Journal of Applied Physiology, 64, 2622–2630.
Coyle, E.F., Martin III, W.H., Sinacore, D.R., Joyner, M.J., Hagberg, J.M. and Holloszy, J.O. (1984). Time course of loss of adaptations after stopping prolonged intense endurance training. Journal of Applied Physiology, 57, 1857–1864.
D’Antona, G., Lanfranconi, F., Pellegrino, M.A., Brocca, L., Adami, R., Rossi, R., Moro, G., Miotti, D., Canepari, M. and Bottinelli, R. (2006). Skeletal muscle hypertrophy and structure and function of skeletal muscle fibres in male body builders. Journal of Physiology, 570, 611–627.
Dawson, B., Fitzsimons, M., Green, S., Goodman, C., Carey, M. and Cole, K. (1998). Changes in performance, muscle metabolites, enzymes and fibre types after short sprint training. European Journal of Applied Physiology and Occupational Physiology, 78, 163–169.
Degens, H. and Alway, S.E. (2006). Control of muscle size during disuse, disease, and aging. International Journal of Sports Medicine, 27, 94–99.
Deschenes, M.R., Giles, J.A., McCoy, R.W., Volek, J.S., Gomez, A.L. and Kraemer, W.J. (2002). Neural factors account for strength decrements observed after short-term muscle unloading. American Journal of Physiology, Regulatory, Integrative and Comparative Physiology, 282, R578–583.
Dupont, G., Millet, G.P., Guinhouya, C. and Berthoin, S. (2005). Relationship between oxygen uptake kinetics and performance in repeated running sprints. European Journal of Applied Physiology, 95, 27–34.
Edge, J., Bishop, D. and Goodman, C. (2006a). The effects of training intensity on muscle buffer capacity in females. European Journal of Applied Physiology, 96, 97–105.
Edge, J., Bishop, D., Goodman, C. and Dawson, B. (2005). Effects of high- and moderate-intensity training on metabolism and repeated sprints. Medicine and Science in Sports and Exercise, 37, 1975–1982.
Edge, J., Bishop, D., Hill-Haas, S., Dawson, B. and Goodman, C. (2006b). Comparison of muscle buffer capacity and repeated-sprint ability of untrained, endurance-trained and team-sport athletes. European Journal of Applied Physiology, 96, 225–234.
Fitts, R.H. (2008). The cross-bridge cycle and skeletal muscle fatigue. Journal of Applied Physiology, 104, 551–558.
Fitzsimons, M., Dawson, B., Ward, D. and Wilkinson, A. (1993). Cycling and running tests of repeated sprint ability. Australian Journal of Science and Medicine in Sport, 25, 82–87.
Gaitanos, G.C., Williams, C., Boobis, L.H. and Brooks, S. (1993). Human muscle metabolism during intermittent maximal exercise. Journal of Applied Physiology, 75, 712–719.
Garrandes, F., Colson, S.S., Pensini, M., Seynnes, O. and Legros, P. (2007). Neuromuscular fatigue profile in endurance-trained and power-trained athletes. Medicine and Science in Sports and Exercise, 39, 149–158.
Gibala, M.J., Little, J.P., van Essen, M., Wilkin, G.P., Burgomaster, K.A., Safdar, A., Raha, S. and Tarnopolsky, M.A. (2006) Short-term sprint interval versus traditional endurance training: similar initial adaptations in human skeletal muscle and exercise performance. Journal of Physiology, 575 (3), 901–911.
Grassi, B. (2003). Oxygen uptake kinetics: old and recent lessons from experiments on isolated muscle in situ. European Journal of Applied Physiology, 90, 242–249.
Green, H.J. and Pette, D. (1997). Early metabolic adaptations of rabbit fast-twitch muscle to chronic low-frequency stimulation. European Journal of Applied Physiology and Occupational Physiology, 75, 418–424.
Greenhaff, P.L., Nevill, M.E., Soderlund, K., Bodin, K., Boobis, L.H., Williams, C. and Hultman, E. (1994) The metabolic responses of human type I and II muscle fibres during maximal treadmill sprinting. Journal of Physiology, 478 (Pt 1), 149–155.
Hamada, T., Sale, D.G., MacDougall, J.D. and Tarnopolsky, M.A. (2003). Interaction of fibre type, potentiation and fatigue in human knee extensor muscles. Acta Physiologica Scandinavica, 178, 165–173.
Hamilton, A.L., Nevill, M.E., Brooks, S. and Williams, C. (1991). Physiological responses to maximal intermittent exercise: differences between endurance-trained runners and games players. Journal of Sports Sciences, 9, 371–382.
Harber, M. and Trappe, S. (2008). Single muscle fiber contractile properties of young competitive distance runners. Journal of Applied Physiology, 105, 629–636.
Harridge, S.D., Bottinelli, R., Canepari, M., Pellegrino, M., Reggiani, C., Esbjörnsson, M., Balsom, P.D. and Saltin, B. (1998). Sprint training, in vitro and in vivo muscle function, and myosin heavy chain expression. Journal of Applied Physiology, 84, 442–449.
Haseler, L.J., Hogan, M.C. and Richardson, R.S. (1999). Skeletal muscle phosphocreatine recovery in exercise-trained humans is dependent on O2 availability. Journal of Applied Physiology, 86, 2013–2018.
Haseler, L.J., Lin, A., Hoff, J. and Richardson, R.S. (2007). Oxygen availability and PCr recovery rate in untrained human calf muscle: evidence of metabolic limitation in normoxia. American Journal of Physiology: Regulatory, Integrative and Comparative Physiology, 293, R2046–2051.
Haseler, L.J., Lin, A. and Richardson, R.S. (2004). Skeletal muscle oxidative metabolism in sedentary humans: 31P-MRS assessment of O2 supply and demand limitations. Journal of Applied Physiology, 97, 1077–1081.
Hautier, C.A., Arsac, L.M., Deghdegh, K., Souquet, J., Belli, A. and Lacour, J.R. (2000). Influence of fatigue on EMG/force ratio and cocontraction in cycling. Medicine and Science in Sports and Exercise, 32, 839–843.
Iaia, F.M., Thomassen, M., Kolding, H., Gunnarsson, T., Wendell, J., Rostgaard, T., Nordsborg, N., Krustrup, P., Nybo, L., Hellsten, Y. and Bangsbo, J. (2008). Reduced volume but increased training intensity elevates muscle Na+-K+ pump α1-subunit and NHE1 expression as well as short-term work capacity in humans. American Journal of Physiology: Regulatory, Integrative and Comparative Physiology, 294, R966–974.
Jensen, L., Bangsbo, J. and Hellsten, Y. (2004). Effect of high intensity training on capillarization and presence of angiogenic factors in human skeletal muscle. Journal of Physiology, 557, 571–582.
Johansen, L. and Quistorff, B. (2003). 31P-MRS characterization of sprint and endurance trained athletes. International Journal of Sports Medicine, 24, 183–189.
Juel, C. (2008). Regulation of pH in human skeletal muscle: adaptations to physical activity. Acta Physiologica, 193, 17–24.
Juel, C., Klarskov, C., Nielsen, J.J., Krustrup, P., Mohr, M. and Bangsbo, J. (2004). Effect of high-intensity intermittent training on lactate and H+ release from human skeletal muscle. American Journal of Physiology, Endocrinology and Metabolism, 286, E245–251.
Karatzaferi, C., de Haan, A., van Mechelen, W. and Sargeant, A.J. (2001). Metabolic changes in single human fibres during brief maximal exercise. Experimental Physiology, 86, 411–415.
Klausen, K., Andersen, L.B. and Pelle, I. (1981). Adaptive changes in work capacity, skeletal muscle capillarization and enzyme levels during training and detraining. Acta Physiologica Scandinavica, 113, 9–16.
Korhonen, M.T., Cristea, A., Alén, M., Mäkkinen, K., Supilä, S., Mero, A., Viitasalo, J.T., Larsson, L. and Suominen, K. (2006). Aging, muscle fiber type, and contractile function in sprint-trained athletes. Journal of Applied Physiology, 101 (3), 906–917.
Krustrup, P., Hellsten, Y. and Bangsbo, J. (2004). Intense interval training enhances human skeletal muscle oxygen uptake in the initial phase of dynamic exercise at high but not at low intensities. Journal of Physiology, 559, 335–345.
Kupa, E.J., Roy, S.H., Kandarian, S.C. and De Luca, C.J. (1995). Effects of muscle fibre type and size on EMG median frequency and conduction velocity. Journal of Applied Physiology, 79, 23–32.
Lattier, G., Millet, G.Y., Maffiuletti, N.A., Babault, N. and Lepers, R. (2003). Neuromuscular differences between endurance-trained, power-trained, and sedentary subjects. Journal of Strength and Conditioning Research, 17, 514–521.
Linossier, M.T., Denis, C., Dormois, D., Geyssant, A. and Lacour, J.R. (1993). Ergometric and metabolic adaptation to a 5-s sprint training programme. European Journal of Applied Physiology and Occupational Physiology, 67, 408–414.
Linossier, M.T., Dormois, D., Perier, C., Frey, J., Geyssant, A. and Denis, C. (1997). Enzyme adaptations of human skeletal muscle during bicycle short-sprint training and detraining. Acta Physiologica Scandinavica, 161, 439–445.
McCully, K.K., Kakihira, H., Vandenborne, K. and Kent-Braun, J. (1991). Noninvasive measurements of activity-induced changes in muscle metabolism. Journal of Biomechanics, 24 (Supplement 1), 153–161.
MacDougall, J.D., Hicks, A.L., MacDonald, J.R., McKelvie, R.S., Green, H.J. and Smith, K.M. (1998). Muscle performance and enzymatic adaptations to sprint interval training. Journal of Applied Physiology, 84, 2138–2142.
McKenna, M.J., Bangsbo, J. and Renaud, J.M. (2008). Muscle K+, Na+, and C1 disturbances and Na+-K+ pump inactivation: implications for fatigue. Journal of Applied Physiology, 104, 288–295.
Malisoux, L., Francaux, M., Nielens, H., Renard, P., Lebacq, J. and Theisen, D. (2006). Calcium sensitivity of human single muscle fibers following plyometric training. Medicine and Science in Sports and Exercise, 38, 1901–1908.
Malisoux, L., Francaux, M. and Theisen, D. (2007). What do single-fibre studies tell us about exercise training? Medicine and Science in Sports and Exercise, 39, 1051–1060.
Mendez-Villanueva, A., Hamer, P. and Bishop, D. (2008). Fatigue in repeated-sprint exercise is related to muscle power factors and reduced neuromuscular activity. European Journal of Applied Physiology, 103 (4), 411–419.
Mohr, M., Krustrup, P. and Bangsbo, J. (2003). Match performance of high-standard soccer players with special reference to development of fatigue. Journal of Sports Science, 21, 519–528.
Mohr, M., Krustrup, P., Nielsen, J.J., Nybo, L., Rasmussen, M.K., Juel, C. and Bangsbo, J. (2007). Effect of two different intense training regimens on skeletal muscle ion transport proteins and fatigue development. American Journal of Physiology: Regulatory, Integrative and Comparative Physiology, 292, R1594–1602.
Mujika, I. and Padilla, S. (2001) Muscular characteristics of detraining in humans. Medicine and Science in Sports and Exercise, 33 (8), 1297–1303.
Nordlund, M.M., Thorstensson, A. and Cresswell, A.G. (2004). Central and peripheral contributions to fatigue in relation to level of activation during repeated maximal voluntary isometric plantar flexions. Journal of Applied Physiology, 96, 218–225.
Osternig, L.R., Hamill, J., Lander, J.E. and Robertson, R. (1986). Co-activation of sprinter and distance runner muscles in isokinetic exercise. Medicine and Science in Sports and Exercise, 18, 431–435.
Pääsuke, M., Ereline, J. and Gapeyeva, H. (1999). Twitch contractile properties of plantar flexor muscles in power and endurance trained athletes. European Journal of Applied Physiology and Occupational Physiology, 80, 448–451.
Parkhouse, W.S. and McKenzie, D.C. (1984). Possible contribution of skeletal muscle buffers to enhanced anaerobic performance: a brief review. Medicine and Science in Sports and Exercise, 16, 328–338.
Pette, D. (1985). Metabolic heterogeneity of muscle fibres. Journal of Experimental Biology, 115, 179–189.
Pette D. (1998) Training effects on the contractile apparatus. Acta Physiologica Scandinavica, 162 (3), 367–376.
Pette, D. and Vrbová, G. (1999). What does chronic electrical stimulation teach us about muscle plasticity? Muscle and Nerve, 22, 666–677.
Racinais, S., Bishop, D., Denis, R., Lattier, G., Mendez-Villaneuva, A. and Perrey, S. (2007). Muscle deoxygenation and neural drive to the muscle during repeated sprint cycling. Medicine and Science in Sports and Exercise, 39, 268–274.
Sahlin, K., Tonkonogi, M. and Söderlund, K. (1998). Energy supply and muscle fatigue in humans. Acta Physiologica Scandinavica, 162, 261–266.
Sargeant, A.J. (2007). Structural and functional determinants of human muscle power. Experimental Physiology, 92, 323–331.
Simoneau, J.A., Kaufmann, M. and Pette, D. (1993). Asynchronous increases in oxidative capacity and resistance to fatigue of electrostimulated muscles of rat and rabbit. Journal of Physiology, 460, 573–580.
Simoneau, J.A., Lortie, G., Boulay, M.R., Marcotte, M., Thibault, M.C. and Bouchard C. (1987). Effects of two high-intensity intermittent training programs interspaced by detraining on human skeletal muscle and performance. European Journal of Applied Physiology and Occupational Physiology, 56, 516–521.
Takahashi, H., Inaki, M., Fujimoto, K., Katsuta, S., Anno, I., Niitsu, M. and Itai, Y. (1995). Control of the rate of phosphocreatine resynthesis after exercise in trained and untrained human quadriceps muscles. European Journal of Applied Physiology and Occupational Physiology, 71, 396–404.
Tesch, P.A. and Wright, J.E. (1983). Recovery from short term intense exercise: its relation to capillary supply and blood lactate concentration. European Journal of Applied Physiology and Occupational Physiology, 52, 98–103.
Tesch, P.A., Thorsson, A. and Fujitsuka, N. (1989). Creatine phosphate in fibre types of skeletal muscle before and after exhaustive exercise. Journal of Applied Physiology, 66, 1756–1759.
Tesch, P.A., Wright, J.E., Vogel, J.A., Daniels, W.L., Sharp, D.S. and Sjödin, B. (1985). The influence of muscle metabolic characteristics on physical performance. European Journal of Applied Physiology and Occupational Physiology, 54, 237–243.
Thomas, C., Bishop, D., Moore-Morris, T. and Mercier, J. (2007). Effects of high-intensity training on MCT1, MCT4, and NBC expressions in rat skeletal muscles: influence of chronic metabolic alkalosis. American Journal of Physiology, Endocrinology and Metabolism, 293, E916–922.
Tomlin, D.L. and Wenger, H.A. (2002). The relationships between aerobic fitness, power maintenance and oxygen consumption during intense intermittent exercise. Journal of Science and Medicine in Sport, 5, 194–203.
Trappe, S., Harber, M., Creer, A., Gallagher, P., Slivka, D., Minchev, K. and Whitsett, D. (2006) Single muscle fiber adaptations with marathon training. Journal of Applied Physiology, 101 (3), 721–727.
Widrick, J.J., Stelzer, J.E., Shoepe, T.C. and Garner, D.P. (2002). Functional properties of human muscle fibres after short-term resistance exercise training. American Journal of Physiology: Regulatory, Integrative and Comparative Physiology, 283, R408–416.
Yoshida, T. and Watari, H. (1993). Metabolic consequences of repeated exercise in long distance runners. European Journal of Applied Physiology and Occupational Physiology, 67, 261–265.