
USING THE NSIGHT GRAPHICS DEBUGGER
C.3Running a C++/OpenGL Application in Nsight

Debugging GLSL shader code is notoriously difficult. Unlike programming in typical languages such as C++ or Java, it is often unclear exactly where a shader program failed. Often, a shader error manifests as a blank screen, offering no clues as to the nature of the error. Even more frustrating is that there is no way to print out the values of shader variables during runtime, as one would commonly do when tracking down an elusive bug.
We listed some techniques for detecting OpenGL and GLSL errors in Section 2.2. Despite the help that these techniques provide, the lack of a simple ability to display shader variables is a serious handicap.
For this reason, graphics card manufacturers have sometimes provided capabilities in hardware for extracting information from shaders at runtime, and then built tools for accessing the information in the form of a graphics debugger. Each manufacturer’s debugging tool(s) work only in the presence of that manufacturer’s graphics card. NVIDIA’s graphics debugger is part of a larger suite of tools called Nsight, and AMD has a similar suite of tools called CodeXL. This appendix describes how to get started using Nsight.
Nsight is an NVIDIA suite tool that includes a graphics debugger, which makes it possible to look inside the stages of the OpenGL graphics pipeline, including shaders, while a program is running. It isn’t necessary to change the code at all, or to add any code. Simply run an existing program with Nsight enabled. Nsight allows examining shaders at runtime, such as seeing the current contents of a shader’s uniform variables.
There are versions of Nsight for Windows and for Linux/MacOS, including versions that run under Microsoft’s Visual Studio (VS) and under the Eclipse IDE. We restrict our discussion to the Windows Visual Studio-based version. (In our “sister” book Computer Graphics Programming in OpenGL with Java we describe how to make this VS version of Nsight work with Java-based programs.)
Nsight works only with compatible NVIDIA graphics cards; it won’t work with Intel or AMD graphics cards. A complete list of supported cards is available on the NVIDIA website [NS18].
C.2SETTING UP NSIGHT
Setting up Nsight is surprisingly easy. Our instructions are based on version 5.3 of Nsight.
1.If you haven’t already done so, install Visual Studio (VS), such as Visual Studio 2017 Community. Be sure to include the C++ core compiler. Note that Visual Studio installation can be extremely slow. Visual Studio 2017 is available at https://www.visualstudio.com/downloads.
Detailed steps for installing Visual Studio are given in Appendix A.
2.Install NVIDIA Nsight, Visual Studio Edition. This should be quicker than it was to install Visual Studio in step 1. While installing, the CUDA elements aren’t necessary (unless you want them for other reasons). Nsight is available at https://developer.nvidia.com/nsight-visual-studio-edition.
3.Run Visual Studio, and make sure that the Nsight menu appears at the top of the menu bar.
4.Load the program that you wish to run, if you haven’t done so already. Steps for configuring a C++ / OpenGL project are given in Appendix A.
C.3RUNNING A C++/OPENGL APPLICATION IN NSIGHT
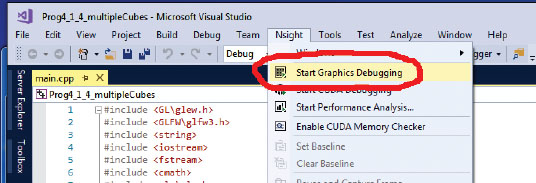
1.Under the “Nsight” menu (along the top menu bar), choose “Start Graphics Debugging,” as shown here:
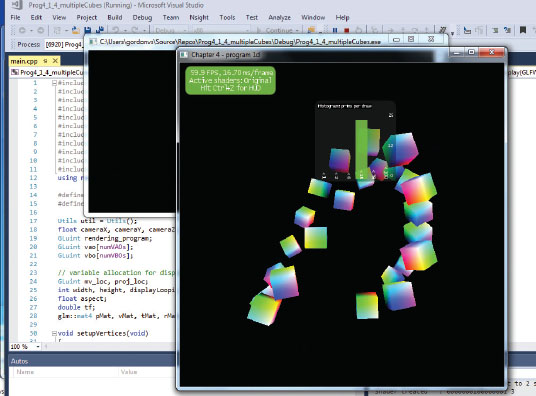
2.A window will pop up asking if you want to “connect without security?” Click on “Connect unsecurely.” This should cause your C++/OpenGL graphics program to execute. You should see both a terminal window, and your running program, appear. Nsight may superimpose some information over your running program. Here is an example:
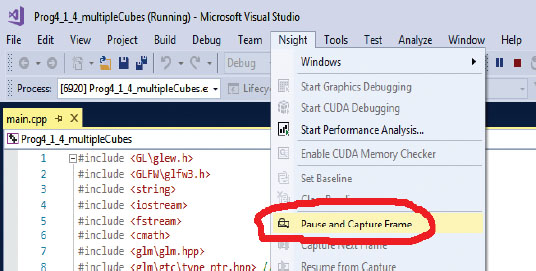
3.Once your program is running, interact with it to whatever area you wish to examine, and then from the Nsight menu, select “Pause and Capture Frame,” as shown here:
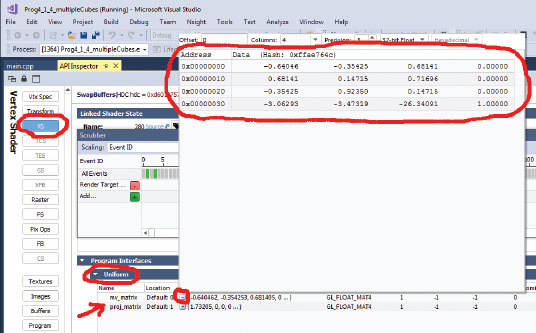
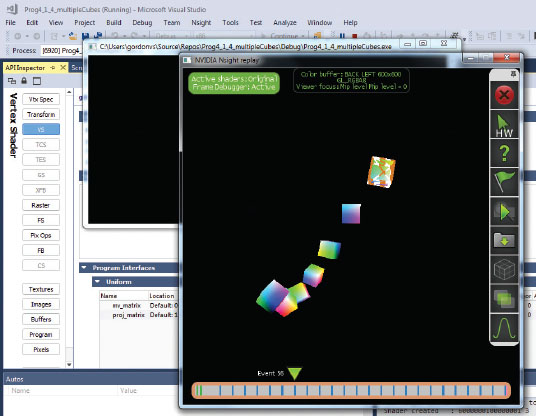
4.The Frame debugger screen should appear, along with a HUD toolbar and a horizontal selection tool called a “scrubber.” Your program will likely freeze at this point. In the center of the debugger screen is a left bar with buttons for each shader stage. For example, you can highlight “VS” for “Vertex Shader,” and in the larger center box to its right, you can scroll down and look at the contents of the uniform variables (presuming you have “API inspector” selected above it). In the following figure, the small box to the right of “mv_matrix” has been opened, revealing the contents of the 4x4 MV matrix.
5.Another interesting window that appears is one that looks similar to your running program. This window has a timeline along the bottom, which allows you to click and see the sequence of items drawn on the frame. Here is an example—note the cursor has been clicked on the left area of the timeline, and it shows those items that have been drawn up to that point:
Consult Nsight documentation for details on how to get the most out of the Nsight tool.
Reference
[NS18] |
Nsight Visual Studio Edition Supported GPUs (Full List), accessed May 2018, https://developer.nvidia.com/nsight-visual-studio-edition-supported-gpus-full-list |