Chapter 3
Genome organization and expression
3.1 Introduction to Genes and Genomes
Like all living organisms except certain viruses, plants contain the information required for their growth and functioning in the form of DNA. This molecule contains the genes that direct the synthesis of proteins via RNA intermediates, as well as intervening regions of non-gene DNA; the total DNA content of a cell is known as its genome. The term is perhaps best known in the context of the Human Genome Project, an ambitious undertaking that resulted in the publication of the essentially complete genome sequence of a human being in the year 2000. Developments in technology for determining DNA sequences mean that it is becoming progressively easier and cheaper to analyze the genomes of other organisms.
A plant's genome is more-or-less constant throughout its life span and in all its tissues. The growth, shape and behavior of the plant are determined by which parts of the DNA are acted upon at any one time; that is, which genes are being expressed. This chapter begins with an overview of the plant genome (or rather, the three plant genomes, those of the mitochondrion, the plastid and the nucleus). The structure and features of plant chromosomes are described, followed by a section on the features of typical plant genes. The remainder of the chapter addresses how plants regulate the expression of their genes, and the processes of transcription and translation that result in the synthesis of proteins.
3.2 Organization of Plant Genomes I. Plastid, Mitochondrial and Nuclear Genomes
The genome of a eukaryotic organism consists of the nuclear genome, where the majority of the genes are found, and the genomes of organelles. Mitochondria have their own genome which is found in all eukaryotic organisms including plants. However, photosynthetic eukaryotes like plants are unique in that they possess three genomes in total. In addition to the nuclear and the mitochondrial genome, they also have a plastid genome. As discussed in Chapter 4, plastids and mitochondria are derived from prokaryotic endosymbionts.
3.2.1 Plastid Genomes do not Contain all the Genes Required for Plastid Function
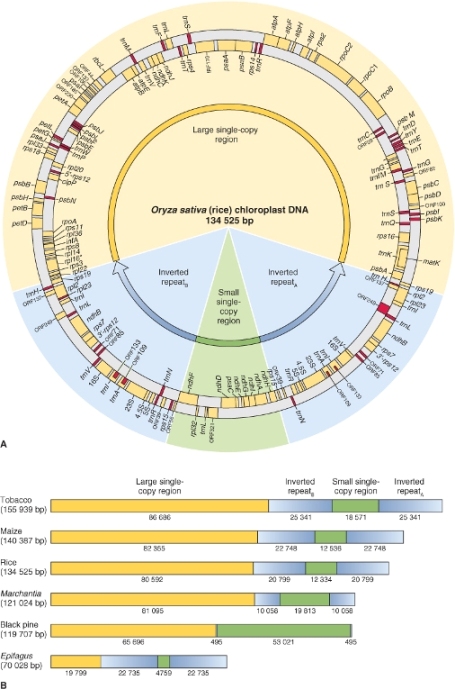
Genome sizes are described in terms of the number of pairs of DNA bases they contain. The most commonly used unit is the kilobase (kb), meaning 1000 base pairs (bp); other terms are listed in Table 3.1. The size of the plastid genome varies between plants, typically containing 120–160 kb; the largest known plastid genome, at approximately 400 kb, is that of the giant unicellular green alga Acetabularia. In illustrations the plastid genome is usually represented as a circle, but in living plastids it can adopt several different conformations including linear and branched molecules as well as circles. The organization of the plastid genome also varies between species, but it is most commonly made up of four sections (Figure 3.1). There are two regions, one large and one small, of single-copy genes (LSC and SSC regions, respectively). These regions are separated by two copies of an inverted repeat (IRA and IRB), though these are absent in plastid genomes of some conifers, algae and legume species. It is believed that IR regions were present in the common ancestor of higher plant plastids but have been lost in certain groups during the course of evolution. Where IR regions are present, they account for most of the variation in plastid genome size, since they can range from just 0.5 kb (500 bp) up to 76 kb.
Table 3.1 Terms used to describe the length of DNA.
| bp |
one pair of nucleotide bases |
| kb |
1 kilobase (kilobase pairs) = 1000 bp |
| MB |
1 megabase (megabase pairs) = 1 000 000 bp |
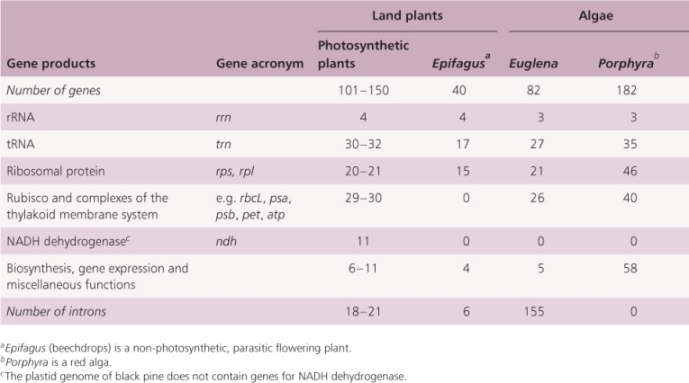
All of the non-reproductive cells in a single organism have the same set of nuclear genes but express those genes in different combinations according to cell position, environment and other factors. Likewise all plastids in a single plant contain identical DNA but may differ in the way it is expressed according to developmental stage and metabolic activity. Now that plastid genome sequences are available for almost 300 plant and algal species, it is possible to make some generalizations about the genes that they contain. Most plastid genomes contain all the genes encoding plastid ribosomal RNAs and transfer RNAs, which are different from those encoded by the nuclear genome. They also include about 100 single-copy protein-coding genes, most of which are known to encode proteins required for photosynthetic functions (Table 3.2). There are still a few sections of the plastid genome which are predicted to encode proteins, but whose proposed products have as yet unknown functions. Plastid genomes in algae are generally larger than those of land plants and contain additional protein-coding genes not found in plant plastids. For example, the plastid genome of the red alga Porphyra purpurea encodes 70 proteins that in land plants are encoded by the nuclear genome. In contrast, the plastid genomes of non-photosynthetic plants, such as the parasitic plants Cuscuta and Epifagus, are small (50–73 kb), having lost many of the genes that they no longer need for photosynthesis.
Table 3.2 Genes identified in complete plastid genome sequences.
Plastids contain by no means all the genes that they require for their own functions. Many genes that were present in the ancestral organelle soon after symbiotic assimilation were probably transferred to the nucleus some time in the course of evolution. A good example is the enzyme that is required for CO2 fixation, ribulose-1,5-bisphosphate carboxylase/oxygenase (rubisco; see Chapter 9). This enzyme, the most abundant protein in photosynthetic organisms, is a multiprotein complex with two types of subunits. The gene for the larger subunit (rbcL) is present in the plastid genome, but the gene for the smaller subunit (RBCS) is found in the nucleus. Many of the protein complexes involved in photosynthesis (see Chapter 9) are similarly encoded by a mixture of nuclear and plastid genes. However, there are also important biochemical pathways in the chloroplast and other types of plastids (see Figure 4.23) for which all of the enzymes are encoded in the nuclear genome, synthesized on cytosolic ribosomes and transported into the plastids.
3.2.2 Plant Mitochondrial Genomes vary Greatly in Size between Different Plant Species
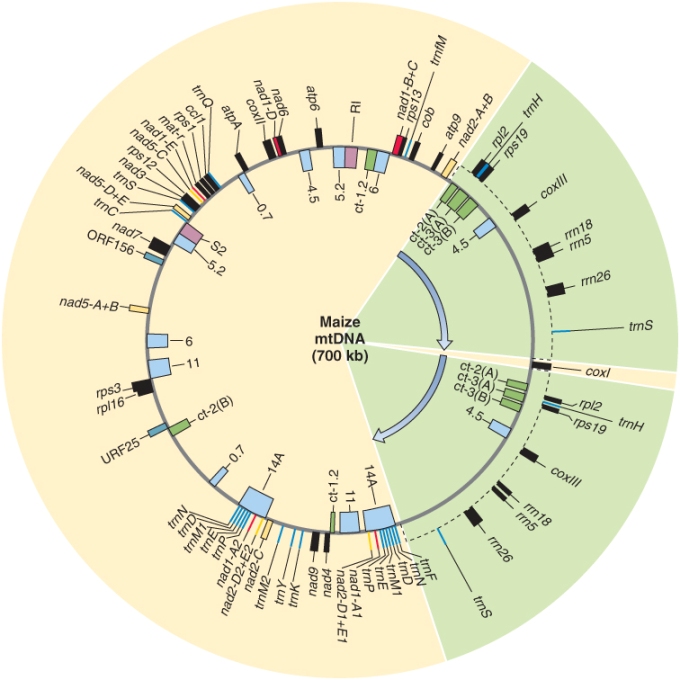
Plant mitochondrial genomes show enormous variation in size, from about 200 kb in Oenothera (evening primrose and its relatives) and Brassica species to 2600 kb in muskmelon (Cucumis melo). This is in contrast to animal mitochondrial genomes, which, for those sequenced to date, are only about 16 kb. Most of the difference between plant and animal mitochondrial genomes can be accounted for by variations in the number of non-coding sequences in the regions between genes (Figure 3.2). In the model plant Arabidopsis thaliana, for example, coding regions make up less than 10% of the 367 kb mitochondrial DNA. In contrast to much of the non-coding DNA found between genes in plant nuclear genomes, plant mitochondrial intergenic regions are not made up of repetitive DNA sequences.
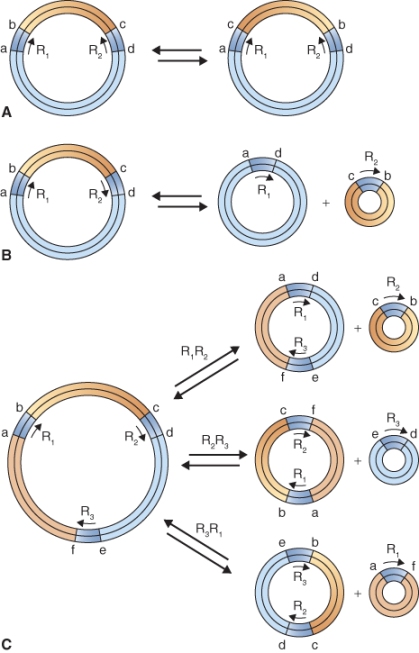
Unlike the plastid genome, it does not appear that the plant mitochondrial genome always exists as a single DNA molecule. Instead, as illustrated in Figure 3.3 for Zea mays (maize), mitochondrial genomes sometimes exist as circular DNA molecules of variable size, known as subgenomic circles. The combined DNA sequence content of the subgenomic circles can account for the entire mitochondrial genome. The largest possible Z. mays mitochondrial circular DNA molecule, called the master circle, which would, in theory, encode the complete set of mitochondrial genes, has never been isolated. The formation of subgenomic DNA circles has been observed in living plant cells, but it is not clear whether some or all subgenomic DNA circles replicate independently or whether they can be generated only from the hypothetical master circle. Not all plants form subgenomic DNA circles; for example, the liverwort Marchantia and white mustard (Brassica hirta) have homogeneous circular mitochondrial genomes, and the alga Chlamydomonas has a linear mitochondrial genome. The reasons for the diversity of organization in organellar genomes are not yet well understood.
Complete DNA sequences are now available for many plant and algal mitochondrial genomes, including those of sugar beet (Beta vulgaris), Arabidopsis, Marchantia, the green alga Prototheca, and the red alga Chondrus. Although plant mitochondrial DNAs are very variable in size, they all contain essentially the same genetic information. They do not contain many genes; most of the enzymes required for mitochondrial DNA replication and transcription are encoded by the nucleus. The products of the genes that are encoded in the mitochondrial genome are mainly ribosomal and transfer RNAs required for protein synthesis, or enzymes with roles in oxidative respiration (see Chapter 7) and ATP synthesis (Table 3.3 summarizes these products for Z. mays).
Table 3.3 Types of genes identified in the Zea mays mitochondrial genome.
| rRNAs |
rrn18, rrn26, rrn5 |
Protein synthesis |
| tRNAs |
trn |
Protein synthesis |
| Ribosomal proteins |
rps, rpl |
Protein synthesis |
| NADH dehydrogenase |
nad |
Respiratory electron transport |
| Cytochrome c oxidase |
cox |
Respiratory electron transport |
| Apocytochrome |
cob |
Respiratory electron transport |
| F0F1-ATPase proteins |
atp |
ATP synthesis |
3.2.3 Some Plant Nuclear Genomes are much Larger than the Human Genome, Others are much Smaller
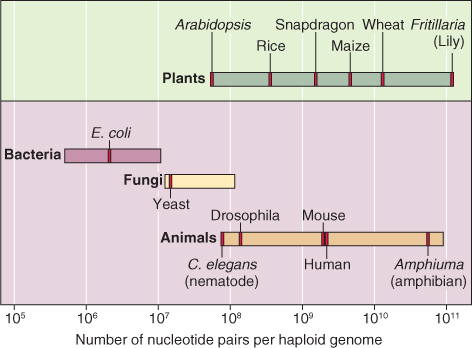
Like the nuclear genomes of other eukaryotic organisms, those of plants cover a wide range of sizes. Size may be expressed either as the number of nucleotide base pairs per genome or by the weight (in picograms, pg) of the DNA in one nucleus. The number of base pairs in a genome is determined by sequencing the genome. The model organism Arabidopsis thaliana has one of the smallest known plant genomes. Arabidopsis is a diploid species, with five pairs of chromosomes. Its haploid DNA content or C value—that is, the amount of DNA in one of the sets of five chromosomes—is 1.35 × 10⁸ bp. In contrast, the genome of the lily Fritillaria assyriaca is one of the largest, with 1 × 10¹¹ bp. The genomes of most major crop species are intermediate in size between these two extremes; rice (Oryza sativa), Z. mays, and wheat (Triticum aestivum), for example, have genome sizes of 5 × 10⁸, 6.6 × 10⁹ and 1.6 × 10¹⁰ bp, respectively. For comparison, the human genome lies in the middle of this range with 3 × 10⁹ bp (Figure 3.4).
Where sequence data are not available, plant genome size can still be determined quite accurately by flow cytometry, a technique for measuring the nuclear DNA content of individual cells in picograms. The number of base pairs can then be estimated from the weight in picograms, since 1 pg corresponds to 978 × 106 bp, meaning that Arabidopsis has a haploid DNA content of 0.138 pg, whereas F. assyriaca has a haploid DNA content of 102.25 pg. The Plant DNA C Value Database maintained by the Royal Botanical Gardens in Kew, UK (http://data.kew.org/cvalues) is a good source of information, mostly obtained by flow cytometry, about genome sizes in plants for which one knows the Latin name (binomial). It also lists the haploid chromosome number for many species.
Why do plant genomes vary so widely in size? The number of genes encoding proteins is not greatly different from one plant to another; estimates range from about 30 000 up to around 60 000, depending on species; the human genome is considered to contain between 20 000 and 25 000 genes. With plant sequence data available, we now know about many of the features of different classes of DNA that contribute to this huge size variation, although its significance for the growth and performance of the plant itself is still poorly understood. At least some of the size variation can be attributed to one or more rounds of genome duplication followed by gene rearrangements which have occurred at some point in the evolution of the species, and to the expansion of families of repetitive elements (see Section 3.2.4), as well as to polyploidy (see Section 3.3.7).
Key Points
Plants have three genomes: plastid, mitochondrial and nuclear. The nuclear genome contains the majority of the genes necessary for plant development and function. The plastid and mitochondrial genomes each have a subset of the genes required for their own functions. Many of the genes that encode chloroplast and mitochondrial proteins are found in the nuclear genome. Plant nuclear genomes vary greatly in size; some are much larger than the human genome, while others are much smaller. The larger plant genomes are dominated by repetitive DNA regions.
3.2.4 Repetitive DNA makes up much of the Genome in many Plants
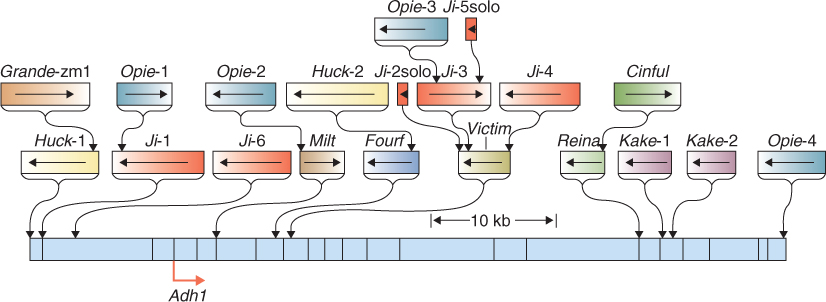
One reason for the large variation in the sizes of plant nuclear genomes is that some genomes have regions of highly repetitive DNA that, in most cases, do not encode proteins. These repetitive sequences fall into two main categories, the so-called tandem repeats and dispersed repeats. Tandem repeats are short regions of DNA, a few nucleotides or tens of nucleotides in length, that are repeated over and over to form blocks of the same sequence element. They are often associated with particular structural features of chromosomes, such as centromeres or telomeres. In many organisms, including yeast (Saccharomyces cerevisiae) and most animals, tandem repeats are commonly richer in the nucleotides A and T than in the genome as a whole. In plants, on the other hand, tandem repeats tend to be GC-rich. Dispersed repeats, found scattered throughout the genome, are often, but not always, derived from transposable elements (see below) that have propagated themselves throughout the chromosomes before becoming inactive. Large-genome species such as Z. mays contain many different families of such sequences. Figure 3.5 shows the region of the Z. mays genome that surrounds the alcohol dehydrogenase gene Adh1. All the repetitive sequences in this figure are inactive versions of former transposable elements; some are related to each other. In every case there are many more copies of the element elsewhere in the genome.
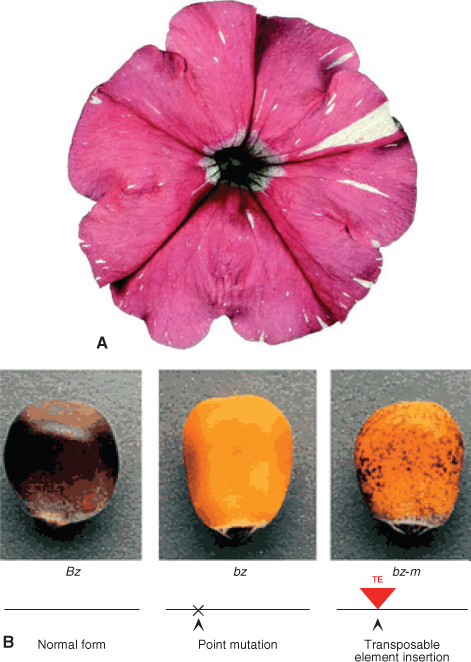
Transposable elements (TEs) are sections of DNA that move, or transpose, from one site in the genome to another. These mobile DNA elements carry genetic information with them as they transpose, making them important features of genome structure. They were first discovered in Z. mays by Nobel Laureate Barbara McClintock in the 1940s. Since then, mobile elements have been identified in most higher organisms, including yeast, insects and mammals as well as plants. When a TE inserts itself into the coding region of a gene or its regulatory elements, it disrupts gene function. The best characterized TEs in plants have been those of Z. mays and Antirrhinum, where pigmented kernels and flowers, respectively, have made it possible to trace the activity of transposable elements as they ‘jump’ in and out of genes encoding enzymes of pigment biosynthesis. This ‘jumping’ takes place continually so that even adjacent cells in the same organ can have the same gene with and without a TE insertion (Figure 3.6).
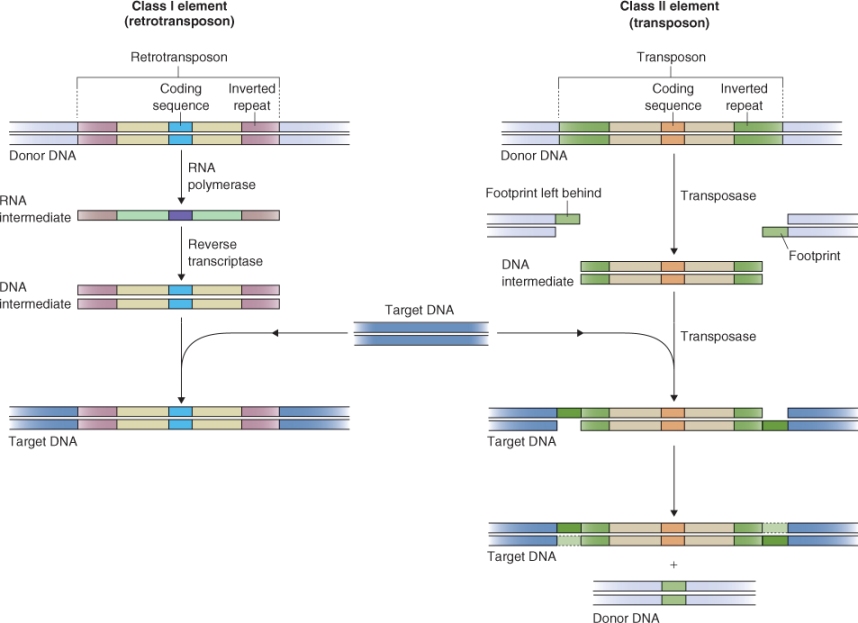
Transposable elements are classified into two main types, according to the mechanism by which they transpose (Figure 3.7). Class I elements, known as retrotransposons, synthesize an RNA intermediate as part of the transposition process. The RNA is then transcribed into DNA by a reverse transcriptase (RNA → DNA) and the DNA is inserted into another location in the genome. This process is similar to the way in which a retrovirus replicates itself throughout the genome of its plant or animal host. Therefore, these elements are believed to have originated as viruses. Retrotransposons, and degenerate, inactive (non-motile) elements derived from them, can make up a large proportion of the total genome in a large-genome plant species. In some cereals, and in many species of iris (Iris spp.) and lily (Lilium spp.), 50–90% of the genome can consist of retrotransposon-derived sequences. Sometimes these sequences are organized in a complex manner making it possible to infer the sequence of events that gave rise to the present-day genome. Figure 3.8 illustrates a group of nested transposable elements in the Z. mays genome. It was possible to determine the relative ages of different elements by sequencing the whole region and comparing sequence similarities between different members of this array of insertions.
Class II elements, often called transposons, move via a DNA rather than an RNA intermediate (see Figure 3.7). An element is cut out of one site; it is then inserted into another site. Each active Class II TE encodes one or two gene products that are needed for transposition. They also have inverted repeats, about 10 bp long, flanking their coding sequence. These repeats are recognized by transposase, an enzyme that binds to them and integrates the transposon into its target site in the genome. When a Class II element is excised from one position, a portion of the element remains in the original location.
Most plant genomes contain only a small number of active TEs that have the potential to move around. Over time, a much large number of TEs have undergone mutations, including DNA deletions, which have rendered them inactive. These inactive elements contribute to the size and organization of the plant genome, but are not known to have other effects.
The transposition of active elements can cause mutations if they insert into the protein-coding or regulatory regions of genes, thereby inactivating those genes or causing them to be incorrectly regulated. An important difference between Class I and Class II elements is that the original Class I element remains in position, whereas a Class II element is removed from one place and transposed to another. Thus while Class I elements cause stable mutations, Class II elements generally produce unstable mutations which can be partially or fully reversed when the transposable element is excised. However, since a portion of duplicated sequence remains after excision, its position will determine whether the mutation is reversible. If it inserts in a regulatory or a coding region portion of the gene, the gene may remain non-functional. Many of the variegated patterns in flowers and in Z. mays kernels (see Figure 3.6B) result from excision events involving Class II transposable elements.
3.2.5 Related Plant Species show Conserved Organization of Gene Content and Order
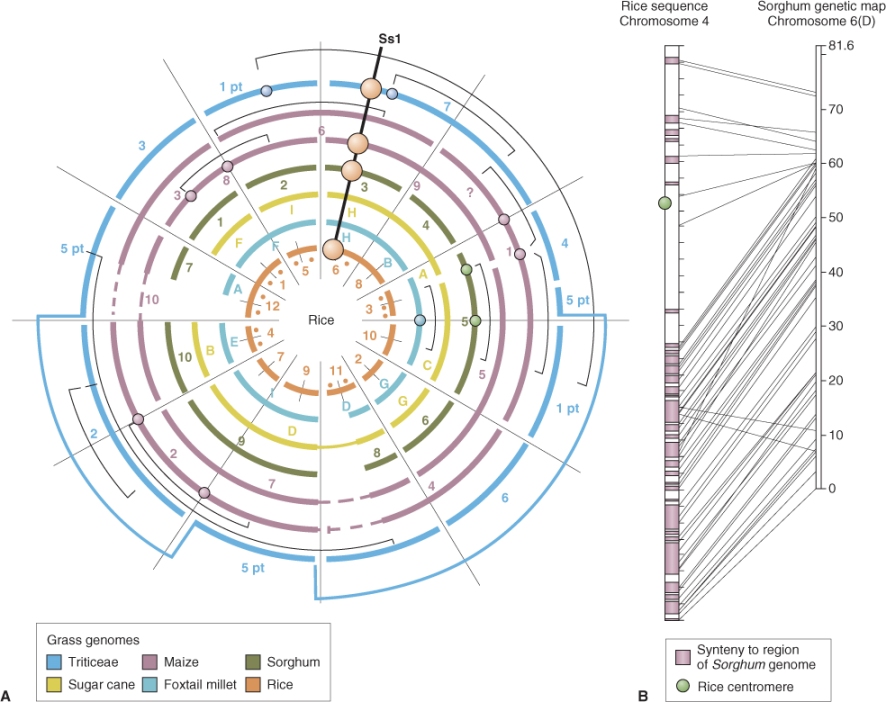
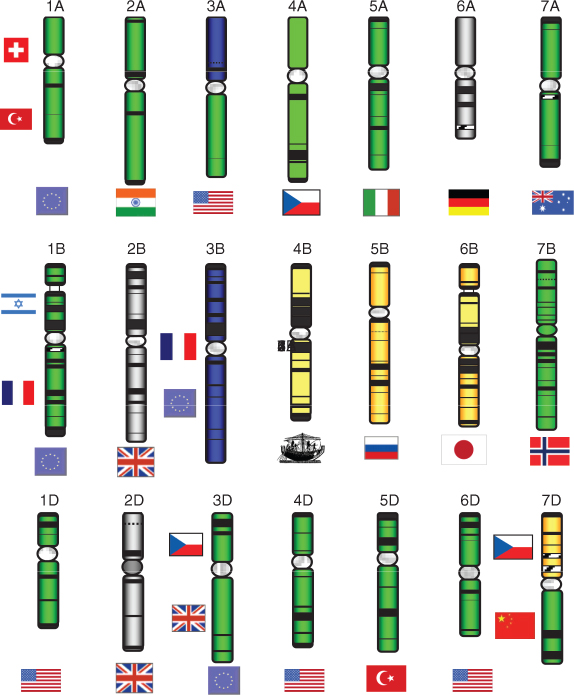
Related species of plants often have similar gene content and order across large segments of their chromosomes. This phenomenon is known as synteny. The first, and still the most striking, example of synteny is found in cereal and other grass species—wheat, rye (Secale cereale), rice, forage grasses and others all show a remarkable conservation of gene order (Figure 3.9). As more genomes are sequenced, it is becoming clear that similar relationships occur in other plant groups, including the family Solanaceae (which includes tomato (Solanum lycopersicum), potato (S. tuberosum), bell pepper (Capsicum annuum), eggplant (S. melongena) and so on) and the legumes soybean (Glycine max), common bean (Phaseolus vulgaris), alfalfa (Medicago sativa) and clover (Trifolium spp.), etc. The lengths of genome over which synteny extends decrease as progressively more distantly-related species are compared, but even between species that diverged 50 million years ago it is still possible to detect short blocks of synteny (microsynteny).
3.3 Organization of Plant Genomes II. Chromosomes and Chromatin
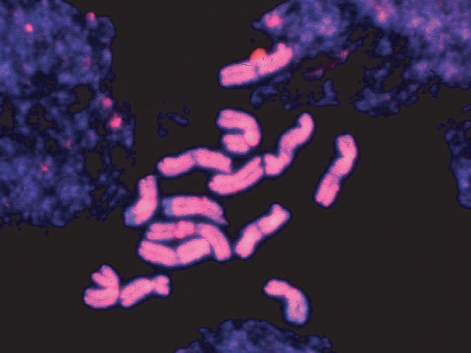
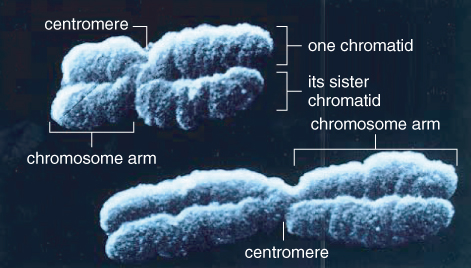
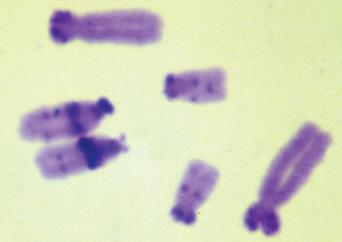
Since the early 20th century, chromosomes have been known to carry the hereditary material in eukaryotes; by the middle of the century, the hereditary material had been identified as DNA. It is now known that each chromosome contains just one double-stranded DNA molecule that may be many centimeters, in some cases even meters, in length. This molecule and its associated proteins can be packaged so compactly that chromosomes are only microns in length during mitosis (Figure 3.10). Highly condensed chromosomes, visible during nuclear division, have characteristic morphological features including a centromere where sister chromatids are joined, arms that extend out from the centromere in both directions and a telomere at the end of each arm (Figure 3.11). While these features have been observed for years, we can now characterize them in terms of their DNA sequence.
3.3.1 Chromosome Arms are Gene-Rich
Chromosome arms stretch from the telomeres to close to the regions near the centromeres (the pericentromeric regions) and are where the majority of plant genes are found. In a species such as Arabidopsis thaliana, which has a small genome, chromosome arms consist of genes and little else. There is an average of one gene every 4.5 kb in the Arabidopsis genome, with each pair of genes being separated by, on average, 2 kb of DNA that does not encode a gene product but usually contains regulatory regions. Most plant species have genomes larger than that of Arabidopsis. Since these large genomes do not have many more genes, it follows that the average gene density is lower for most plants. In Z. mays, for example, about 80% of the genome consists of repetitive DNA, most of which encodes retrotransposons. The Z. mays genome can be thought of as consisting of gene islands, each containing at most seven genes, in oceans of retrotransposons which can extend for hundreds of kilobases.
Key Points
Repetitive regions in the genome may be tandem repeats—regions of DNA, a few nucleotides or tens of nucleotides in length—that are repeated over and over to form blocks of the same sequence element. Alternatively, they may be dispersed repeats, often derived from transposable elements, that can move around the genome. When a transposable element inserts itself into a gene, the function of that gene is disrupted. Transposable elements are classified into two types. Class I elements, also known as retrotransposons, synthesize an RNA intermediate, which is then transcribed into DNA by a reverse transcriptase and the DNA is inserted into another place in the genome. This normally causes a stable mutation. Class II elements, often called transposons, do not synthesize an RNA intermediate. Instead, a Class II element is cut out of one site, leaving a portion of itself behind, and inserted into another site in the genome by an enzyme called transposase. The portion left behind may continue to disrupt gene function, but in some cases a mutation caused by Class II element insertion is reversed when the element is excised. In related plant species, the organization of gene content and order are conserved.
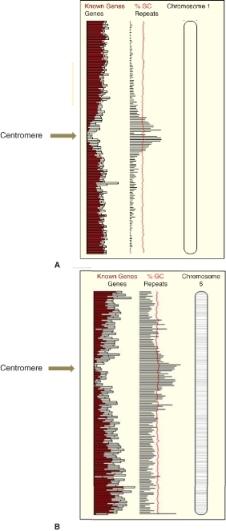
In all plants so far studied, the density of genes is greater towards the ends of the chromosome arms than closer to the centromeres. This is more striking in the large-genome species, but is also observed in Arabidopsis. Figure 3.12 shows the distribution of known genes in Arabidopsis and in rice.
3.3.2 Each Chromosome Arm Terminates in a Telomere
At the end of each chromosome arm is a telomere, a specialized structure that protects the chromosome end, ensures that it is replicated accurately, and prevents what would otherwise be a natural tendency to shorten at each successive round of DNA synthesis (because the mechanism of DNA replication results in the loss of 50–100 nucleotides from the 5′ end of the sequence). Telomeres also seem to have a role in maintaining ‘non-sticky’ ends on the chromosome. When chromosomes break, which can happen, for example, in response to radiation, the broken ends are very sticky, readily joining with any other available DNA fragment. In intact chromosomes, telomeres prevent this. Finally, telomeres appear to play a role in the organization of chromosomes in the nucleus, attaching the chromosome to the inner surface of the nuclear envelope.
Telomeres are composed of multiple repeats of a short DNA sequence. In most plants so far studied, this is TTTAGGG, though in species in the order Asparagales (which includes asparagus, onions, agave, yucca and orchids) it is TTAGGG, identical to the version found in humans and other vertebrates. The overall length of each telomeric region depends on the species and genotype. In Arabidopsis, for example, there are 2–5 kb regions of perfect repeats of the TTTAGGG motif at the extreme end of each chromosome, followed by several kilobases more of degenerate (imperfect) versions of the motif. Tobacco (Nicotiana tabacum), in contrast, has telomeric regions about 150 kb long.
3.3.3 The Centromere is a Complex Structure Visible as a Constriction in the Chromosome
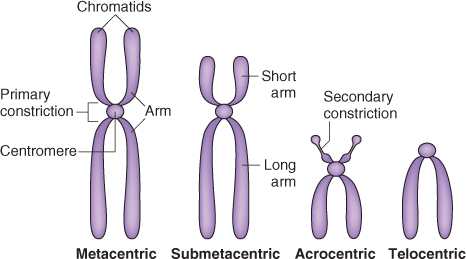
Like all eukaryotic chromosomes, each plant chromosome contains a centromere. Centromeres are constrictions in chromosomes, which are clearly visible when the chromosomes condense during the cell division cycle (see Figure 3.11). As discussed in more detail in Chapter 11, the spindle fibers attach to centromeres to facilitate the separation of replicated chromatids in mitosis and meiosis. Despite the name, centromeres are not necessarily found at the physical centers of chromosomes. Figure 3.13 illustrates examples of plant chromosomes that have their centromeres located in different positions. Variation in centromere location between different chromosomes in a species can be a useful cytogenetic tool for distinguishing one chromosome from another.
Plant centromeres are large and complex structures. In Arabidopsis, for example, centromeres mainly consist of tandem arrays of 180 bp DNA sequence, repeated over and over, while Z. mays centromeres contain a different, 150 bp, repeat. There is considerable variation in the number of copies of a given repeat sequence among different chromosomes within a plant, and even for the same chromosome in different varieties within a species. In addition to these tandem repeats, centromeres often contain retrotransposon elements that are usually centromere-specific. The amount of repetitive DNA in centromeres has made sequencing in and around this region technically difficult, so the exact size of most plant centromeres has not yet been established. Rice is an exception; two of its 12 centromeres have been completely sequenced and analyzed. They have been shown to be between 1 and 2 megabases (Mb) in length. The centromeres in Arabidopsis have been estimated to be 1 Mb each, although there is also evidence to suggest that they may be larger.
3.3.4 Chromosomes have other Distinctive Structural Features
In addition to the major morphological landmarks on chromosomes, there are characteristic regions that can be distinguished by their DNA sequences. These include pericentromeric regions found on all chromosomes and nucleolar organizer regions (NORs) and heterochromatic knobs that are located on specific chromosomes. Adjacent to each centromere are two pericentromeric regions that are many megabases long and contain few genes. As discussed further in Chapter 11, these normally show low rates of genetic recombination during meiosis. They generally contain large numbers of transposons and retrotransposons.
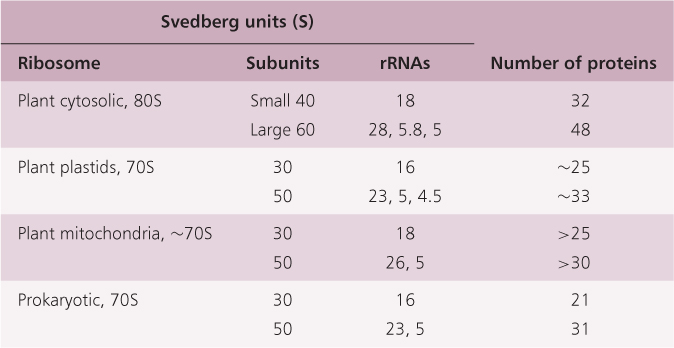
Nucleolar organizer regions are the sites where the genes for ribosomal RNA are found. The nucleolus forms around the NORs and cytosolic ribosomes are assembled here. Ribosomes are needed in very large quantities for protein synthesis in active cells, and it would be impossible for one or a few copies of a gene to keep up with the demand for ribosomal RNA synthesis. Each subcellular compartment in which protein synthesis takes place—the cytosol, plastid and mitochondrion—has its own ribosomes with characteristic S values (Table 3.4). Ribosomes and their individual subunits are designated using the sedimentation coefficient S (Svedberg, named for the Swedish chemist Theodor Svedberg) value, which indicates the speed at which they would sediment during centrifugation in a gradient of increasing sucrose concentration. The function of ribosomes is discussed in Section 3.6.2.
Table 3.4 Summary of the composition and properties of various ribosome types.
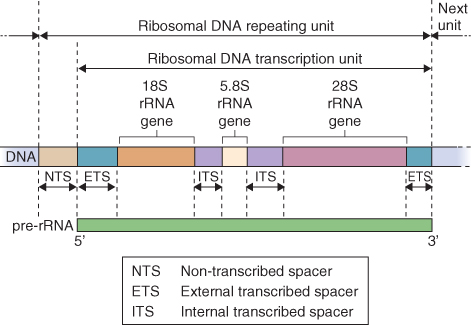
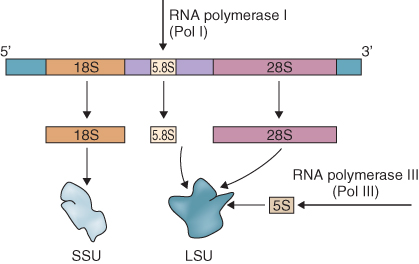
Cytosolic ribosomes contain four RNA species. The NORs consist of tandem repeats of a sequence about 10 kb long that encodes the 28S, 18S and 5.8S RNA components of the ribosome (Figure 3.14). The coding sequences of these ribosomal genes are highly conserved across species, even across the boundary between the plant and animal kingdoms. However these coding regions are separated by the intergenic spacer (IGS), which is much more variable. It has been used for exploring relationships between species by analyzing the extent of IGS sequence divergence. The number and chromosomal location(s) of NORs have been determined in many plant species. In Arabidopsis, for example, there are two NORs, each about 4 Mb in size, one on chromosome 2 and one on chromosome 4. In addition to the 28S, 18S and 5.8S RNA components, each ribosome contains a 5S RNA. This RNA is also encoded in tandem arrays that are found at other locations in the genome from the 28S, 18S and 5.8S RNA cluster, often on different chromosomes altogether.
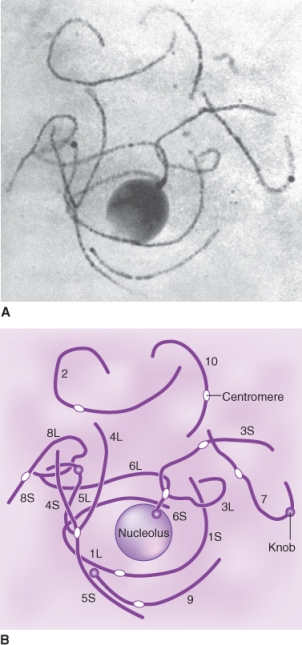
Heterochromatic knobs are regions of highly condensed chromatin found in locations separate from the centromeres. They are commonest in plants with large genomes, and have been well-characterized in Z. mays (Figure 3.15). Arabidopsis has a single heterochromatic knob in its haploid genome, on chromosome 4. Sequencing has shown that it consists mainly of retrotransposons.
3.3.5 DNA in the Nucleus is Packaged with Histones to Form Chromatin
So far, chromosomes have been described solely in terms of their DNA composition. But plant chromosomes, like those of other eukaryotes, consist of more than just DNA. Chromosomal DNA is associated with a number of different proteins. These proteins are important both in maintaining the structure of a chromosome and in regulating gene expression. DNA and its associated proteins are called chromatin. A large portion of the proteins in chromatin are histones. Histones are very basic proteins (that is, they carry a positive charge), and this facilitates their interaction with the acidic DNA molecule. During interphase, regions of chromatin, called heterochromatin, are tightly coiled and stain darkly with dyes; heterochromatin is usually considered to be relatively ‘inert’ DNA in which genes are undergoing little or no transcription. In contrast other regions, designated euchromatin, are more loosely packed, stain lightly and often contain genes that are undergoing active transcription.
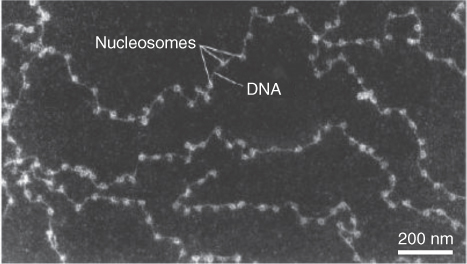
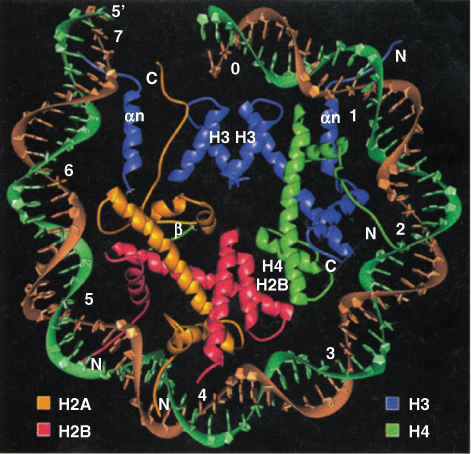
Using scanning electron microscopy at the highest levels of resolution, chromatin resembles a ‘beads on a string’ structure (Figure 3.16), about 10 nm in diameter. The ‘beads’ represent a nucleosome array. A nucleosome consists of DNA wrapped two full turns (166 bp) around a globular cluster of eight histone proteins—two tetramers, each consisting of H2A, H2B, H3 and H4 (Figure 3.17). One additional histone, H1, binds outside the nucleosome core; one of its functions is to stabilize both the nucleosome array and higher-order chromatin structures (Figure 3.18). The core histones H2A, H2B, H3 and H4 can all undergo covalent modifications to their protein structures. These modifications may include, among others, methylation, acetylation and phosphorylation. These alterations affect interactions between histones and DNA, and in some cases they are involved in the regulation of gene expression.
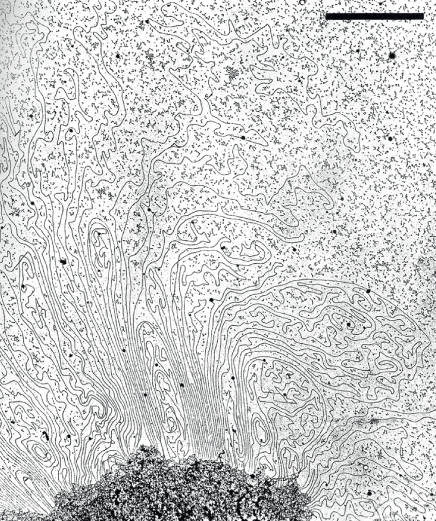
The ‘beads on a string’ assembly in turn undergoes higher-order coiling, producing the so-called ‘solenoid’ structure, 30 nm in diameter, so that the genome adopts a very compact conformation in the nucleus. The solenoid structure is further compressed when it attaches to nuclear scaffold proteins resulting in the formation of variably-sized looped domains of chromatin (Figure 3.19). These various levels of compression are essential, because while the higher plant nucleus is only a few micrometers in diameter, the total length of DNA in, for example, a single Z. mays nucleus is about 4 m. Thus DNA needs to be packaged so that it fits into the nucleus and does not suffer breakage or become tangled.
3.3.6 Each Species has a Characteristic Chromosome Number
The number of chromosomes per nucleus is characteristic of a species. As was the case with genome size, there is huge variation between species in the number and sizes of chromosomes. At the lower end of the range, three species (Brachycome dichromosomatica, Zingeria biebersteiniana and Haplopappus gracilis) have haploid chromosome numbers (n) of two; at the other extreme, some plants of the genus Equisetum (horsetails) have more than 100 chromosomes in their haploid set. There is no correlation between the number of chromosomes and the total DNA content. For example, the soft rush Juncus effusus, which is used commercially in Japan for the weaving of tatami mats, has 23 tiny chromosomes in its haploid complement, but a nuclear DNA content of 0.3 pg, less than twice that of Arabidopsis (n = 5). In contrast, Crepis capillaris, a member of the daisy family, packs its 2.1 pg of DNA into just three chromosomes (Figure 3.20).
3.3.7 Polyploidy and Genome Duplication are Common in Plants
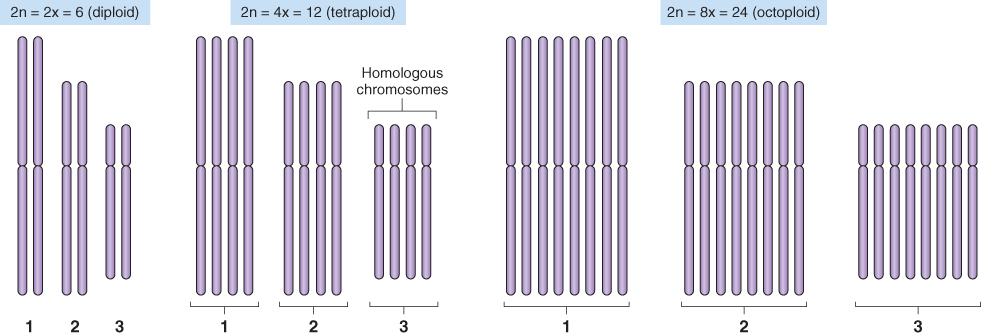
Humans, like most mammals, are diploid—they have just two full sets of chromosomes, one set derived from each parent. In contrast plant species with more than two sets of chromosome are commonly found; this condition is called polyploidy. Tetraploid and hexaploid species, with four and six full sets of chromosomes respectively, are common, and octaploids also exist.
Polyploids may arise in one of two ways. If the entire chromosome complement of a diploid plant is doubled the result is an autotetraploid: a plant that has four sets of chromosomes, two chromosome sets from each parent. Autotetraploids may arise spontaneously or may be induced by using drugs such as colchicine, which disrupt the mitotic spindle. Formally, if the parent plant had 2n = 6, the autotetraploid would have 12 chromosomes and would be designated 2n = 4x = 12 where n = the new haploid number of chromosomes and x = the original haploid number. If the chromosome set were doubled again, the resulting plant would be an octoploid: 2n = 8x = 24 (Figure 3.21).
As more plant genome sequences become available, there is increasing evidence that there have been many genome duplication events throughout the history of plant evolution. The timing of these duplications—anything from a few million years ago to more than 100 million years in the past—can be inferred from the extent to which the duplicated sequences have become different from one another. Protein-coding sequences are used for these analyses, since the non-coding regions of the genome are under less strong selective pressure, and often rapidly diverge to the point at which their common origin is no longer recognizable. Where coding sequences of two genes, in the same or different plant species, are still identifiably related, the genes are called homologs. More specifically, when homologous genes are found in different plant species they are known as orthologs. The term given to two or more homologous genes in the same species is paralogs.
Following genome duplication events, individual duplicate genes can be lost or undergo changes in gene function. These changes can occur because, following duplication, at least one of the duplicate genes is free to diverge or evolve without needing to maintain its original function that might have been essential for an organism's survival. The end result may be that one of the duplicated genes takes on a different role than that of its original parent. Alternatively, the two duplicates together may cover the roles that were originally fulfilled by the parent gene; for example, one may be expressed in leaves and the other in roots; or one during early development and one later on. In both cases, these changes can affect either the gene's protein-coding region or its regulatory regions.
The other class of polyploids, allopolyploids, arises from events in which the genomes of two or more ancestral species are combined into a single new species, without reduction in the total number of chromosomes. Such interspecific hybridization events are infrequent in nature and the progeny are often sterile. However, genetic analysis has shown that a large proportion of modern plant species underwent interspecific hybridization at some point in their evolutionary history. Many important crop species are allopolyploids, probably as a result of early human attempts to improve yield and quality by bringing together the best traits of wild species. For example, bread wheat (Triticum aestivum) has three sets of chromosomes, derived from three ancestral diploid species. Its genome is described as 2n = 6x = 42 (Figure 3.22).
Key Points
In the nuclear genome, the hereditary material, DNA, is carried on chromosomes. Each chromosome has two arms, which terminate in telomeres and are separated by a complex structure called the centromere. Chromosomes have other distinctive structural features including nucleolar organizer regions and heterochromatic knobs. The chromosome arms are gene-rich, whereas the region immediately around the centromere has few genes. Nuclear DNA is packaged with histone proteins to form chromatin, which consists of a series of nucleosomes in a ‘beads on a string’ conformation; the nucleosomes undergo further coiling to produce a compact ‘solenoid’ structure. Each plant species has a characteristic number of pairs of chromosomes: this may be anything from two to over 100 pairs in the nucleus of every cell. Polyploidy and genome duplication are common events in plants.
3.4 Expression of the Plant Genome I. Transcription of DNA to RNA
For a gene to be expressed, the DNA of which it is composed must be transcribed into RNA. In most cases the RNA is then translated into protein. However, the products of transcription include not only mRNA, which is the template for protein synthesis, but also a number of RNA molecules that either are components of the machinery of protein synthesis or play regulatory roles (Table 3.5). With very few exceptions, only one strand (the coding strand) of any region of the DNA double helix actually encodes a protein, and it may be either strand. Thus protein-coding genes on a given section of a chromosome may be transcribed to RNA in either direction. This process is under the control of regulatory elements that determine whether, and to what extent, a gene is expressed at a given time and under given conditions. We will consider the processes of transcription and translation of nuclear genes and examine ways in which gene expression is regulated.
Table 3.5 Different types of RNA are transcribed by different types of RNA polymerase.
| Pol I |
18S, 5.8S and 25S ribosomal RNAs |
| Pol II |
Messenger RNA, micro RNAs |
| Pol III |
5S ribosomal RNA, transfer RNAs |
| Pol IV |
Small interfering RNAs (siRNAs) |
3.4.1 Plant Nuclear Genes have Complex Structures
We have discussed the general structure and composition of plant genomes. Now let us look at the organization of individual plant genes. Plant nuclear genes are organized like the genes of other eukaryotes. On average, the part of a gene that codes for its gene product stretches over about 1300 DNA bases (1.3 kb). However, in most cases, these bases are interspersed and surrounded by other non-coding sequences, so that the typical eukaryotic gene covers 4 kb or more. The physical location of a gene in a chromosome is knows as its locus (plural: loci).
The sections of a protein-coding gene that encode the gene product are called exons, while the intervening stretches of non-coding DNA are known as introns. Initially, when a protein-coding gene is transcribed into RNA, the whole exon–intron region is transcribed to produce a primary transcript. Subsequently, the sections corresponding to the introns are excised, in a process known as splicing (see Section 3.4.11) to produce the messenger RNA (mRNA) that is translated into the protein product.
The non-coding sequence that flanks the 5′ end of the gene (5′ leader sequence) usually contains DNA elements that have roles in the regulation of gene transcription. The 3′ flanking region contains sequence elements for modifying mRNA and a transcription stop site, and may contain additional regulatory elements (Figure 3.23). Sometimes determining where the 3′ flanking region of one gene ‘ends’ and the 5′ flanking region of the next gene ‘begins’ is not easy. These intergenic regions contain much of the DNA that makes some plant genomes so large, including tandem repeats and active or inactivated transposable elements.
3.4.2 Histones and Chromatin Organization Play Important Roles in Gene Expression
Before a nuclear gene can be transcribed, chromatin must be remodeled to make the gene accessible to the transcription machinery. The chromatin surrounding a gene that is being, or is about to be, transcribed is less condensed than genomic chromatin as a whole. These regions of the genome can be recognized because they are hypersensitive to digestion by the enzyme DNase I.
In addition to their role in chromatin structure, two of the histones, H3 and H4, can affect gene transcription if they have undergone post-translational modification by the addition of components to their polypeptide chains after they have been synthesized. These changes can affect gene transcription both by altering chromatin structure and by promoting or reducing transcription factor binding. The two major forms of modification that histones H3 and H4 undergo are acetylation and methylation. During acetylation, an acetyl group is transferred from acetyl coenzyme A to one or more of five lysine residues in either of the two histones. The enzymes that carry out this process are known as histone acetyl transferases (HATs). Acetylated histones form nucleosomes that are less compact and generally more accessible to transcription factors (Figure 3.24). Methylation of histones H3 and H4 also affects lysine residues. It is carried out by histone methyl transferases (HMTases) that transfer methyl groups from S-adenosylmethionine or S-adenosylhomocysteine to the histones. Depending which lysine residues are acetylated, methylation can result in either increased gene expression or heterochromatin formation and silencing of genes. It is becoming increasingly clear that histone modifications and chromatin structure play important roles in gene expression in plants and other eukaryotes, but our understanding of these processes is far from complete.
3.4.3 Higher-order Chromatin Structure also Regulates Gene Expression
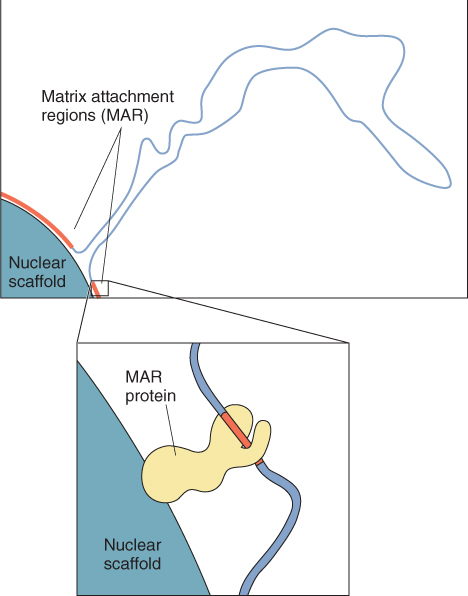
The chromosomes of higher eukaryotes are attached at many points to a nuclear scaffold structure, forming variably-sized looped domains of chromatin (see Figure 3.19). The sequences where attachment occurs, known as matrix attachment regions (MARs), are AT-rich DNA sequence motifs which are 200–1000 bp long. MARs are believed to facilitate transcription of a gene or a group of genes by causing a reduction in chromatin condensation (Figure 3.25). The loops created by different MARs are independent of one another and show various degrees of supercoiling, which is known to influence gene expression.
Several plant genes have been identified as having associated MARs which appear to influence gene structure or function; examples are known from pea (Pisum sativum), bean (P. vulgaris), soybean (Glycine max), Nicotiana tabacum, sugarcane (Saccharum officinarum) and Zea mays. MARs are often found flanking the coding regions of genes, and in many cases they are associated with regulatory elements. For example, in P. vulgaris, the 5′ flanking region of the β-phaseolin gene contains a MAR that acts together with a transcriptional enhancer sequence to promote transcription of the gene.
Key Points
Plant nuclear genes have complex structures. The sections of a protein-coding gene that encode the product are called exons; they are separated by intervening non-coding regions, the introns. The regions that flank the protein-coding portion of the gene include promoters and other regulatory regions that control the timing and extent of gene expression. For a gene to be expressed, an RNA copy of its DNA must be made, in a process called transcription. In most cases, the RNA then undergoes translation into protein. However, some products of transcription are RNA molecules that are components of the machinery of protein synthesis, or that play regulatory roles. With very few exceptions, only one strand (the coding strand) of any region of the DNA double helix actually encodes an RNA product, and either strand may be the coding strand. The expression of DNA is regulated at many levels: histones, chromatin organization and higher-order chromatin structure all play important roles in gene expression.
3.4.4 Promoters and other Regulatory Elements Control the Timing and Extent of Gene Transcription
The transcription of DNA to RNA is carried out by a class of enzymes called RNA polymerases. For transcription to occur, a polymerase must bind to a specific promoter sequence upstream (i.e. some distance before the 5′ region) of the gene to be transcribed. In a broad sense, a gene promoter includes a variety of sequence elements that control the recruitment of proteins called transcription factors which are required for, or enhance, transcription of a gene. A gene's promoter is often considered to be the 1–2 kb of sequence immediately upstream of the gene itself. It consists of core elements and promoter regulatory elements. Core elements are sequences that are required for binding of the RNA polymerases and therefore for the transcription of genes; they are usually within 50 bp upstream (to the 5′ side of) or downstream (to the 3′ side) of the site at which transcription is initiated. Promoter regulatory elements are responsible for the activation, repression or modulation of gene expression. Transcription factors bind to these regulatory elements and influence the rate at which the genes are transcribed by the appropriate RNA polymerase. Promoter regulatory elements are upstream of, and close to, the transcription initiation site and core elements. However, other regulatory elements may also be found in a gene's introns, downstream of the coding region, or at distances of many kilobases from the gene, on the same or a different chromosome. Regulatory elements that are located in the same chromosome and on the same DNA strand as the coding region of the gene they influence, and in close proximity to it, are known as cis elements; whereas proteins (or other molecules) encoded elsewhere in the genome that interact with the promoter or promoter-associated proteins are called trans-acting factors.
The promoters of some plant genes contain DNA sequences that confer specificity of gene expression in response to factors such as nutrient status, hormone concentration or environmental stress. These responsive elements (also often called response elements) generally have a short, highly-conserved core DNA sequence, which is essential for response to a particular factor, surrounded by a less highly-conserved region. For example, the abscisic acid responsive element (ABRE), which is found in over 2000 genes in both Arabidopsis and rice, contains the core sequence AGCT. The presence of this sequence in a gene's promoter region means that expression of the gene can be induced by abscisic acid. Elements responsive to ethylene, iron deficiency and dehydration have also been well characterized in plants.
3.4.5 RNA Polymerases Catalyze Transcription
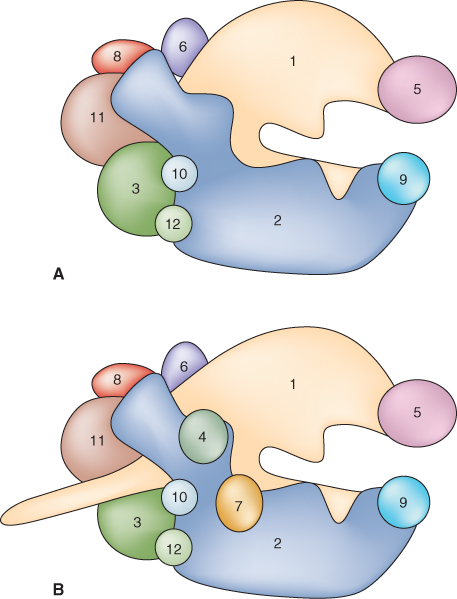
Plants have four different nuclear RNA polymerases, each of which is involved in transcribing different classes of genes in the nucleus. There are additional RNA polymerases for the transcription of mitochondrial and plastid genes. The types of genes transcribed by each of the nuclear polymerases are summarized in Table 3.5. RNA polymerases I, II and III are multisubunit enzymes that are evolutionarily related to each other, and are found in all eukaryotes. Each consists of two large subunits and 10–15 smaller subunits (Figure 3.26). Some of the subunits are common to two or to all three of the other polymerases. Each of the four polymerases has its own characteristic core promoter type or types.
RNA polymerase I (Pol I) is involved solely in the transcription of the group of ribosomal genes (18S, 5.8S and 25S sequences; see Section 3.3.4) that are transcribed in tandem to produce a 45S ribosomal RNA precursor (Figure 3.27). This transcript is subsequently processed to excise spacer sequences and produce the individual rRNA components.
The Pol I core promoter is found about 50 bp upstream of the ribosomal genes. This core promoter normally contains a highly conserved region around the transcription start site (TATATA(A/G) GGG) but otherwise it is not yet known what the critical regulatory elements are. Even though transcription by Pol I of the multiple RNA genes in growing cells can represent up to 80% of all RNA synthesis, there is still little understanding of how this transcription is regulated. The fourth RNA component of cytosolic ribosomes, 5S RNA, is transcribed by Pol III.
RNA polymerase II (Pol II) is responsible for the transcription of all protein-coding genes in the nucleus. Pol II promoters have been studied in more detail than other promoters. The Pol II promoter associated with a gene plays an important part in regulating when, in which cell types, and in response to what environmental conditions the gene is expressed.
Many Pol II core promoters contain a region called a TATA box. The TATA box is the DNA sequence TATAA, usually followed by three more A-T base pairs and surrounded by GC-rich regions, and it is found about 25 bp upstream of the starting point for RNA synthesis. When Pol II promoters were first identified, it was believed that the TATA box was present and essential for them all, whether from plants, animals or fungi. Now that whole-genome sequences are becoming more widely available, it turns out that the TATA box occurs only in about one Pol II promoter in three. The genes that have this feature are mainly ones that are highly expressed, at least under some conditions. There are whole classes of genes—for example, those involved in photosynthesis—for which there is no TATA box. These genes usually have an alternative region known as the downstream promoter element located 3′ of the transcription factor IIB (TFIIB) binding site.
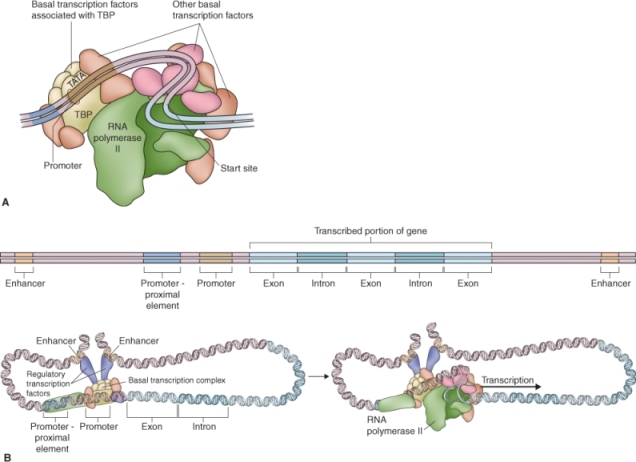
Initiation of transcription by Pol II requires the interaction of a number of factors to ensure accurate transcription of a protein-coding gene. Generalized transcription factors (TFIIs), such as TFIIB, work together with the TATA-binding protein, TBP, to ensure the correct binding of RNA polymerase to the core promoter of every protein-coding gene (Figure 3.28A).
Specific transcription factors that are involved in the transcription of particular genes or groups of related genes interact with the basal transcription complex to regulate the initiation of transcription (see Section 3.4.6). Additional TBP-associated factors mediate the interactions between the transcription complex and specific transcription factors, thus playing a part in regulating the way different genes are expressed.
Regulatory elements bind transcription factors; they may be found both in the promoter itself and far upstream from the TATA box, in the untranslated 5′ leader sequence of the gene and even in its introns. These regulatory elements often act as enhancers, increasing the efficiency of RNA Pol II in initiating gene transcription (Figure 3.28B). Enhancer sequences can be located at a considerable distance from the coding region of the gene. However, as cis elements, they must by definition be on the same DNA strand as the gene(s) they influence. Enhancers may have roles in regulating the specificity of gene expression, controlling whether, and to what extent, a gene is expressed in a particular tissue or in response to a certain environmental factor such as light or pathogen attack. The term silencers is used for elements similar to enhancers that act to downregulate, rather than increase, gene expression.
The remaining two RNA polymerases, Pol III and Pol IV, are less well studied. Pol III is the most complex of the RNA polymerases: it is composed of 17 subunits, five of which have no equivalents in Pol I and Pol II. It transcribes genes encoding a number of small RNAs, including tRNAs, 5S ribosomal RNAs and others. Pol IV is completely distinct from Pol I–III. It was discovered relatively recently and appears to be unique to plants. Pol IV synthesizes small interfering RNAs (siRNAs). These are RNA molecules, typically 20–25 nucleotides long, that play a variety of roles in eukaryotic cells. They were first discovered in plants, in the late 1990s, but have since been identified in insects, mammals and other organisms. One function of siRNAs is RNA silencing. In this process an individual siRNA can suppress expression of a gene to which it has sequence homology. They also play a part in resistance to certain viruses.
3.4.6 Transcription Factors Bind to DNA Regulatory Sequences
For proper plant development and function, it is essential that the correct genes are expressed at the right time and in response to the right stimulus. As we have seen, for protein-coding genes, this control is achieved by interaction between the promoter regulatory cis elements and trans-acting DNA-binding proteins (transcription factors). This interaction is required to ensure that RNA Pol II transcribes the gene appropriately.
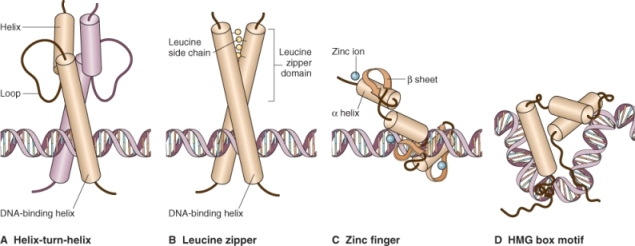
Most transcription factors have at least two domains that are essential for their function. One of these is required for recognition and binding of the cis element target sequence associated with the gene itself; the other domain functions in organizing additional proteins involved in activating transcription (Figure 3.28). The majority of the known transcription factors can be classified into groups based on their structural motifs. They fall into four major categories: helix-turn-helix motifs, basic leucine zippers, zinc fingers and high-mobility group box (HMG-box) motifs (Figure 3.29). These motifs are conserved between species, and can be found either in the DNA-binding domain or in the protein-binding domain of the transcription factor.
Transcription factors are often encoded by families of genes that code for a set of related proteins. Members of a family may be involved in the transcription of closely related genes, or of the same genes in different tissues or environments. Those transcription factors that act as heterodimers, formed when two different members of a transcription factor family interact, allow for further fine tuning of the DNA binding specificity.
3.4.7 Homeobox Proteins are Important in Regulating Development and Determining Cell Fate
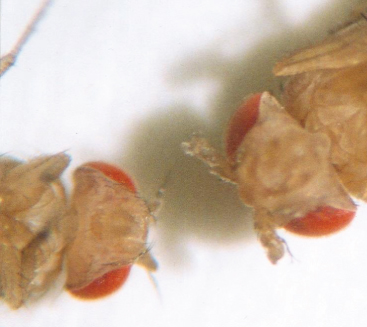
One class of transcription factors deserves a special mention, because of their importance in regulating development and in determining the fate of cells and organs. They are known as homeobox proteins (or homeodomain proteins) because genes that encode them all share a common sequence, approximately 180 bp long, called the ‘homeobox’. Homeobox genes were first discovered in the fruit fly Drosophila melanogaster. In the fly, mutations in homeobox genes produce dramatic developmental effects such as the replacement of an antenna by a leg (Figure 3.30). Subsequently, homeobox genes have been found in all multicellular eukaryotes investigated to date, including plants. They are believed to control the expression of other regulatory proteins, including transcription factors, and thereby act as ‘master genes’. Genes, like homeobox genes, that regulate tissue or organ identity are called homeotic genes.
The transcription factors encoded by homeobox genes are all of the helix-turn-helix class. Their DNA-binding domains are encoded by the highly conserved 180 bp homeobox. They regulate their target genes in a precise, coordinated pattern in time and space. Despite the high degree of conservation of the DNA-binding domain itself, homeobox genes are able to achieve specificity by differential associations with other regulatory proteins or cofactors, or by variations in the DNA flanking the homeobox which alter binding efficiency. Outside the homeobox domain, the DNA sequence is not conserved between homeobox genes among species, or even within species. In Zea mays, for example, two families of homeobox genes, KNOX, named for the Knotted1 (Kn1) gene, and ZMH1/ZMH2, have been identified. The amino acid sequence of the homeodomains is highly conserved between Kn1 and the ZMHs (57 of 64 amino acids in the two proteins are identical), but the remaining sequences are very different.
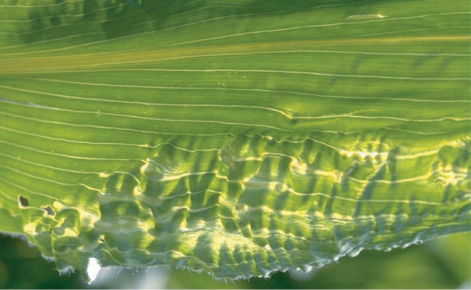
The Z. mays Kn1 gene was the first plant homeobox gene to be identified. Mutations in the gene alter leaf structure by causing vascular tissue to be produced outside its normal position (Figure 3.31). Since the discovery of Kn1, additional homeotic genes have been isolated from Z. mays, Arabidopsis and many other plants. Because the homeodomains from plants and animals, including humans, are so similar, it is likely the homeobox genes arose as a way of regulating development before the stage in evolution at which animals and plants diverged.
3.4.8 The MADS-box Family Includes Homeotic Genes and Regulators of Flowering Time
The MADS-box genes arose early in the development of eukaryotic organisms, and are found in species ranging from yeast and flies to humans and plants. The name is derived from four members of the gene family: MCM1 from budding yeast, Saccharomyces cerevisiae, AGAMOUS from Arabidopsis thaliana, DEFICIENS from the snapdragon Antirrhinum majus and SRF (serum response factor) from Homo sapiens. The MADS-box is a highly conserved region of about 56 amino acids towards the N terminus of the protein, which is a DNA-binding domain. Plants contain many MADS-box genes—for example, there are at least 30 in Arabidopsis—and they have evolved to perform a range of functions. Several are homeotic genes, which specify the identity of different parts of flowers; thus a mutation in the MADS-box gene APETALA3, for example, results in flowers with petals transformed to sepals and stamens converted to carpels. Others genes in this group are not homeotic, but are important in ensuring the correct timing of flowering in response to environmental factors such as day length and temperature.
3.4.9 Many Genes are Named after Mutant Phenotypes
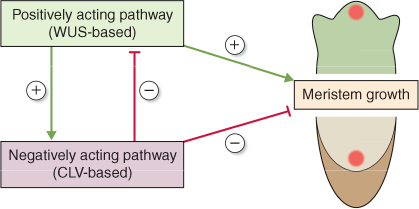
Analysis of mutants and other genetic variants has been essential for identifying plant genes and understanding their regulation. Different versions of the same gene, with one or more variations at the DNA sequence level, are called alleles, and some allelic variations give rise to mutant phenotypes. Mutants are often given descriptive names (in some cases not entirely serious!) which, usually in abbreviated form, become attached to the corresponding malfunctioning genes when they have been isolated and sequenced. The convention is to notate the name of the mutant gene in lower case, and the wild-type (functional) variant in UPPER CASE. Gene names are usually written in italics, and the corresponding protein translation product is non-italicized. Regulatory pathways are represented as interacting networks of functioning versions of mutant genes. The inhibitory influence of one gene, or gene product, on another is usually represented by a bar-ended line; a positive interaction is shown by an arrow. For example, Arabidopsis mutants identified by the production of disorganized groups of leaves and shoots were given the name wuschel, meaning ‘tousled hair’ in German. Another kind of mutant, in which meristems grow as a band or a ring instead of as a point, was called clavata (from the Latin for ‘club-shaped’). The corresponding wild-type genes are WUSCHEL (WUS) and CLAVATA (CLV), encoding the proteins WUS (a homeobox transcription factor) and CLV (a receptor kinase), respectively. Figure 3.32 shows a regulatory model, based on analysis of mutants, in which WUS and CLV are components of opposing pathways that interact to regulate the patterning of meristem growth (see Section 12.3.3).
3.4.10 Transcription Proceeds via Initiation, Elongation and Termination
With the transcription initiation complex containing the necessary transcription factors in place, the process of transcription can begin. RNA Pol II separates the two strands of the DNA molecule, maintaining a region of about ten nucleotides over which the strands are held apart. Ribonucleotides complementary to the template (non-coding) strand of this region are added one at a time by RNA Pol II to produce an RNA molecule that is a copy of the DNA-coding strand, except that each thymine residue in the DNA is represented by a uracil in the RNA. When transcription is complete, RNA Pol II dissociates from the DNA and the transcript of the gene is released. Multiple RNA Pol II molecules can associate with a single DNA template at any one time, producing many copies of the gene transcript.
Key Points
Transcription of DNA to RNA is carried out by RNA polymerases. The nuclear genome is transcribed by four different RNA polymerases, each of which is responsible for transcribing a different class of gene. Protein-encoding genes are transcribed to messenger RNA by RNA polymerase II. Transcription requires the binding of proteins called transcription factors to promoter regions in the DNA. There are several classes of transcription factors, which are classified according to their structural motifs. Transcription factors are often encoded by families of genes, and members of a family may be involved in the transcription of structurally-related genes, or of the same genes in different environments or parts of the plant. Homeobox proteins are a special class of transcription factor, important in the regulation of development and in determining cell fate. Genes of the MADS-box family are widespread in plants, and play regulatory roles in the development of plant parts and in the control of processes such as flowering in response to environmental cues.
3.4.11 Messenger RNA Molecules Undergo Post-transcriptional Modifications
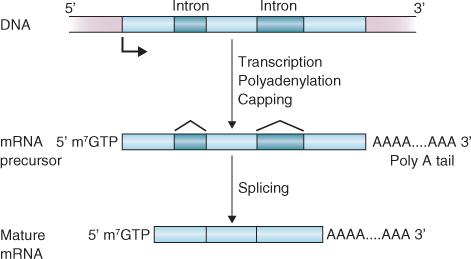
The initial product of transcription of a protein-coding gene is a 1:1 RNA copy of the gene's DNA sequence, including the non-coding introns as well as the coding exons. This primary transcript must undergo considerable modification to form a mature messenger RNA that will be translated into protein. These modifications include the addition of a 5′ structure known as a cap, splicing to remove introns and the addition of a chain of adenylic acid residues at its 3′ end (the poly(A) tail). Figure 3.33 shows the relationship between primary transcript and mature mRNA.
The 5′ cap is added to the growing mRNA molecule, just after it exits the RNA polymerase complex. A guanosine residue is first attached to the existing 5′ nucleotide by a triphosphate bridge. The guanine then undergoes methylation at the N-7 position. The 5′ cap has an important role during initiation of mRNA translation. It is also believed to help protect mRNA from being degraded while it is being synthesized because mRNA is normally very susceptible to attack by nucleases.
Once transcription is complete, introns are excised from the primary RNA transcript and the exons are joined together to yield the mature RNA sequence in a process called RNA splicing. Small nuclear ribonucleoproteins (snRNPs) recognize and bind to intron–exon boundaries. The bound snRNPs then aggregate to form a spliceosome that catalyzes the removal of the exon and the joining of introns to form the sequence that will be used to synthesize a protein.
Before most nuclear-encoded mRNAs move from the nucleus to the cytoplasm for translation, a sequence of between 25 and 250 adenosine residues is added to their 3′ ends. This poly(A) tail is not encoded in the gene but is added post-transcriptionally. It facilitates the process of mRNA export from the nucleus and, like the 5′ cap, it plays a role in stabilizing the mRNA against degradation by nucleases and in the initiation of translation.
Unlike nuclear-encoded mRNAs, those encoded by plastid and mitochondrial genomes lack the 5′ cap and long poly(A) tail. A small proportion of plastid mRNAs do have a short poly(A) segment, or an A-rich region, at the 3′ end. In this case these regions appear to regulate degradation of the mRNA; they do not function in the initiation of translation.
Key Points
Transcription of DNA to messenger RNA proceeds in three phases: initiation, elongation and termination. A transcription initiation complex, containing transcription factors and other regulatory proteins, and RNA polymerase II, is assembled on the DNA to be transcribed. RNA polymerase II holds the two DNA strands apart over a short region, and adds ribonucleotides complementary to the template (non-coding) strand of this region one at a time, to produce an RNA molecule that is a copy of the corresponding DNA coding strand, except that each thymine residue in the DNA is represented by a uracil in the RNA. At the termination stage, RNA polymerase II dissociates from the DNA, releasing the RNA transcript of the gene. Messenger RNA molecules undergo post-transcriptional modifications that include the addition of a 5′ structure known as a cap; removal of the introns by splicing to leave only the coding portion of the RNA; and addition of the poly(A) tail, a chain of adenylic acid residues at the 3′ end. Gene expression can be regulated at the post-transcriptional level by interaction between micro RNAs and messenger RNAs. A typical plant micro RNA is 21–23 nucleotides long, and contains a sequence complementary to part of the protein-coding region of one or more messenger RNAs. This sequence allows the micro RNA to form a section of double-stranded RNA with its mRNA target. The double-stranded region promotes destruction of the messenger RNA by enzymatic cleavage.
3.4.12 Micro RNAs are Regulators of Gene Expression at the Post-transcriptional Level
Micro RNAs (miRNAs) are one of several classes of small RNA molecules found in eukaryotes that have roles in regulating gene expression; another of these classes, siRNAs, was described in Section 3.4.5. A typical miRNA is 21–23 nucleotides long and is single-stranded. A ribonuclease called Dicer produces miRNAs by cleaving longer RNA precursors. In plants a miRNA usually has a sequence that is complementary (or nearly complementary) to part of the protein-coding region of one or more messenger RNAs. Therefore a miRNA can form a section of double-stranded RNA with its target mRNA; this double-stranded region promotes enzymatic cleavage of the mRNA. Thus miRNAs regulate gene expression at a point after transcription has occurred, but before the message can be translated (see Section 3.5). They have been shown to have a wide range of roles in plants, both during normal development and in response to abiotic stresses and to bacterial and fungal pathogens. The way miRNAs and siRNAs function is known as RNA interference (RNAi).
3.5 Expression of the Plant Genome II. Epigenetic Regulation of Gene Expression
Traditionally, scientists believed that all the heritable traits that determine whether and when genes are expressed, and hence the appearance and behavior of an individual, are encoded in the primary sequence of its DNA, its genome. However, for decades there has been evidence that there can be changes in gene expression that are stably passed on from cell to cell (mitotically), and sometimes from generation to generation (meiotically), but that do not seem to involve any alterations in the organism's primary DNA sequence. These changes may reveal themselves through an alteration such as loss of pigmentation in flowers or cereal grains. Other, less apparent, changes are now recognized as being more widespread than previously thought. These changes are said to be epigenetic; a new field of research, epigenetics, has developed that studies these changes. There are many ways in which epigenetic changes can arise in plants; some of the best understood are described below.
3.5.1 DNA Methylation is an Important Mediator of Epigenetic Regulation of Gene Expression
DNA methylation is the best studied, though not the only, mechanism that accounts for epigenetic changes which are inherited both mitotically (within the cells of a given organism) and meiotically (from one generation to the next). Cytidine groups in genomic DNA undergo methylation; in plants this normally occurs where there is a CpG dinucleotide (the p represents a phosphodiester bond) or a CpNpG site, where N can be any nucleotide. When the parent strand of a newly-replicated region of DNA contains methylated CpG or CpNpG sites, the new strand is a strong substrate for DNA methyltransferase which ensures that pre-existing methylation patterns are passed on to both the daughter chromosomes that result from a cell division. DNA methylation can affect chromatin structure which, in turn, can affect patterns of gene transcription.
3.5.2 Epigenetic Changes through Paramutation can be Passed on From One Generation to the Next
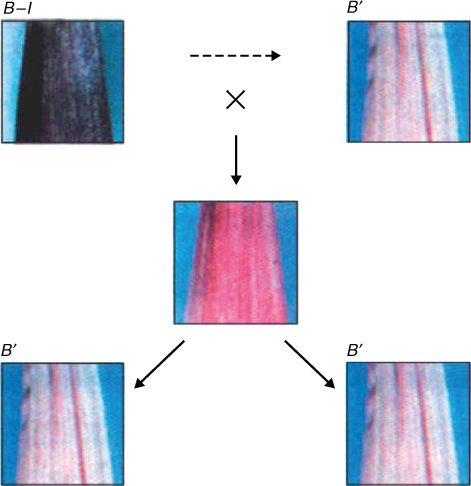
Paramutation is a type of epigenetic change that is meiotically heritable—that is, it can be passed on from one generation to the next. The term describes an interaction between two alleles in which the expression of one allele in a heterozygote is altered by the presence of the other. Figure 3.34 illustrates one example from Zea mays, in which a gene controlling pigmentation can be present in one of two forms. One of these, the allele B-I of the gene b (booster), is strongly expressed and gives intense coloration, so plants with two copies are intensely colored. The B′ allele is weakly expressed, and plants with two copies of this allele are less intensely colored. However, in heterozygous plants with one copy of each allele (B-I/B′) the color intensity is low, and only B′ alleles are transmitted sexually from these heterozygous plants via pollen and seed to the next generation. The two b alleles, B′ and B-I, have identical DNA sequences, yet their rates of transcription differ by 10–20-fold.
3.5.3 Transgenes can Silence a Plant's Own Genes by Cosuppression
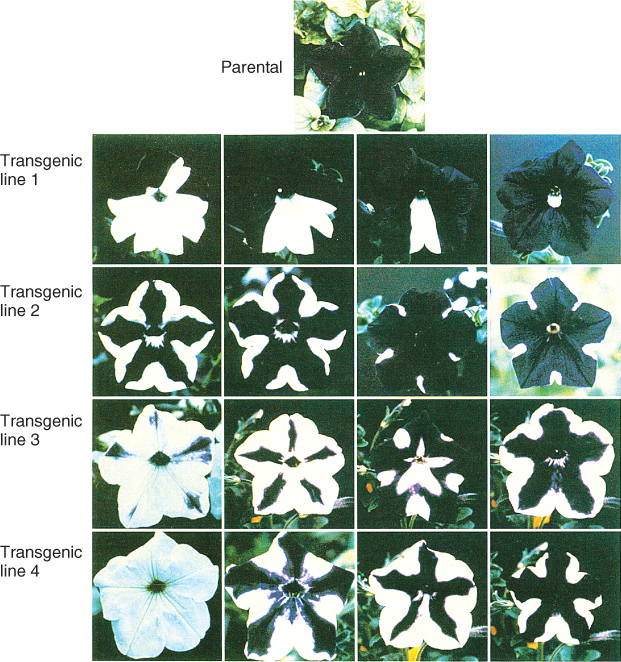
In some cases, the suppression of gene expression without any change in the DNA sequence of the gene (epigenetic gene silencing) does not result in heritable changes of gene activity. When it first became possible to make transgenic plants, researchers made the surprising discovery that inserting an engineered gene (a transgene), that was similar or identical in DNA sequence to a gene that was already present in the plant, caused the endogenous gene to be silenced. This phenomenon is known as cosuppression. One of the best-known examples comes from an attempt to intensify flower color in Petunia by introducing a transgene encoding an enzyme in the pigment biosynthetic pathway (see Chapter 15). The transgene not only did not result in increased pigment synthesis, it actually suppressed activity of the corresponding endogenous gene by causing degradation of the gene's mRNA transcript. This meant that the pigment was not synthesized at all, resulting in colorless flowers (Figure 3.35). Several transgenic studies, in Arabidopsis and Nicotiana tabacum as well as Petunia, have shown a correlation between repetition of genes at a given position in the genome and silencing. The more copies of the transgene that are present at one position, the greater the chance that expression from those linked transgenes will be silenced, and the greater their ability to silence related genes, whether transgenes or part of the plant's own DNA complement, elsewhere in the genome. Cosuppression does not lead to a permanently heritable change because endogenous gene activity is restored once the transgene is separated from the endogenous gene by recombination during meiosis to form gametes. It may take several rounds of sexual reproduction to accomplish this separation.
3.5.4 Imprinting Occurs only at Certain Stages in Plant Development
Imprinting is an example of epigenetic change that operates only during certain stages of plant development. It happens when the expression of certain alleles differs, depending on whether the allele came from the male or the female parent. Examples of imprinting are known in mammals and fungi as well as in plants.
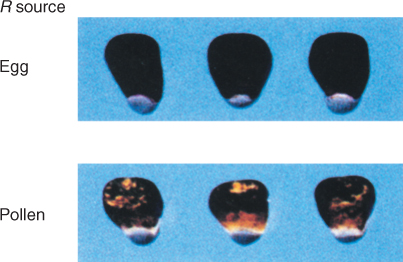
Imprinting is particularly evident during some phases of reproductive development, and has been intensively studied in the endosperm of the seed in flowering plants. Figure 3.36 shows imprinting in the case of the red gene (r) that affects endosperm color. Certain alleles of the gene (the R alleles) are strongly expressed, giving a solid seed color, when transmitted through the female egg but weakly expressed (variegated seed color) when transmitted through the male pollen. This reflects a male-specific epigenetic change in r gene activity.
3.6 Expression of the Plant Genome III. Translation of RNA to Protein
The process of cytoplasmic and mitochondrial protein synthesis in plants is similar to that in other eukaryotic organisms, except that translation of some mRNAs can be regulated by light. Protein synthesis in plastids is unique to plant cells. In photosynthetically active tissue, about 75% of the total protein synthesis takes place in the cytosol, using mRNAs transcribed in the nucleus as templates. The products can total more than 25 000 different proteins, whereas chloroplasts and mitochondria together account for, at most, 300 different proteins.
Key Points
Some changes in gene expression can be passed on from cell to cell in an organism, and in certain cases from one generation to the next, but nevertheless do not involve changes to the primary DNA sequence. These changes are described as epigenetic. DNA methylation at cytidine residues, affecting chromatin structure, is one important mechanism for epigenetic regulation of gene expression. Paramutation is a type of epigenetic change in which the expression of one allele in a heterozygous individual is altered by the presence of the other allele; this class of alteration can be passed on to subsequent generations. Cosuppression is a form of epigenetic gene silencing in which overexpression of a transgene results in suppression of the expression of the plant's own copy of the gene. In imprinting, the expression of certain alleles differs depending on whether they came from the male or the female parent.
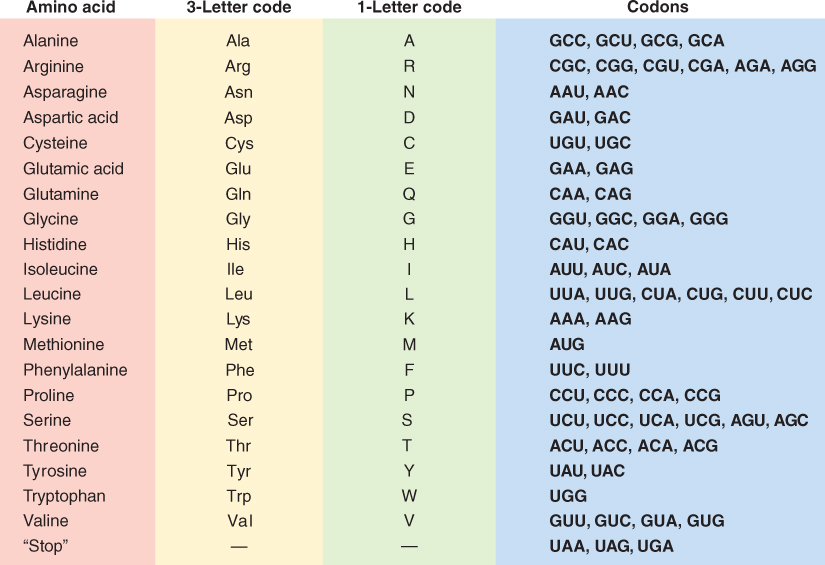
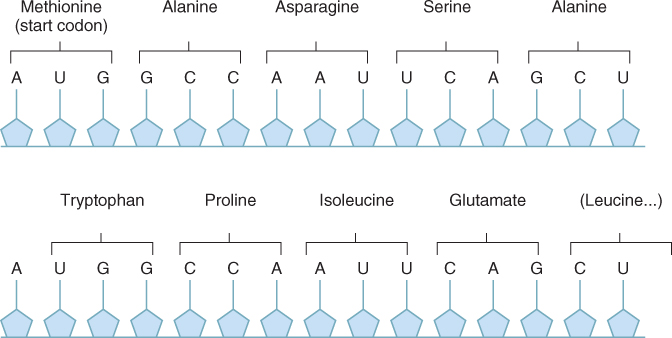
Once mature mRNA has been moved out of the nucleus into the cytosol it can be translated to produce a protein. Translation is the mechanism by which the sequence of nucleotides in mRNA is decoded and used as a template that specifies the order of amino acids in a protein. The genetic code specifies the relationship between the sequence of nucleotides in the mRNA and the corresponding sequence of amino acids in the protein. The mRNA is translated three nucleotides at a time, and each trinucleotide sequence, or codon, encodes one amino acid (Figure 3.37). The genetic code is said to be degenerate, because there is more than one codon for most of the 20 amino acids that are found in proteins. There are 64 possible mRNA codons; three of them are reserved for use as stop codons, which identify the position where translation of the mRNA terminates. It is important that the protein synthesis machinery initiates translation at the correct point in the sequence; in the example shown in Figure 3.38 if translation were initiated at the U instead of the A in the AUG, a protein with an entirely different—and probably non-functional—amino acid sequence would be produced.
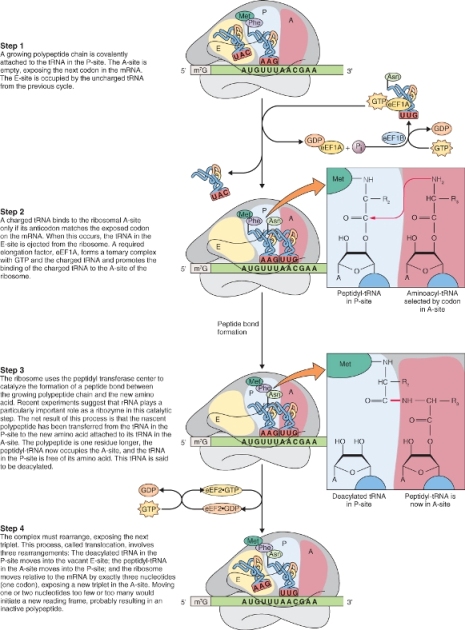
The process of translation requires transfer RNA (tRNA), an adaptor molecule that recognizes codons in mRNA and the amino acids for which they code. Translation also needs ribosomes, the structures that will catalyze the formation of peptide bonds between amino acids. In the following sections we examine these participants in more detail and then discuss the process of protein synthesis and the production of functional proteins.
3.6.1 Transfer RNAs are the Link between mRNA Codons and Amino Acids
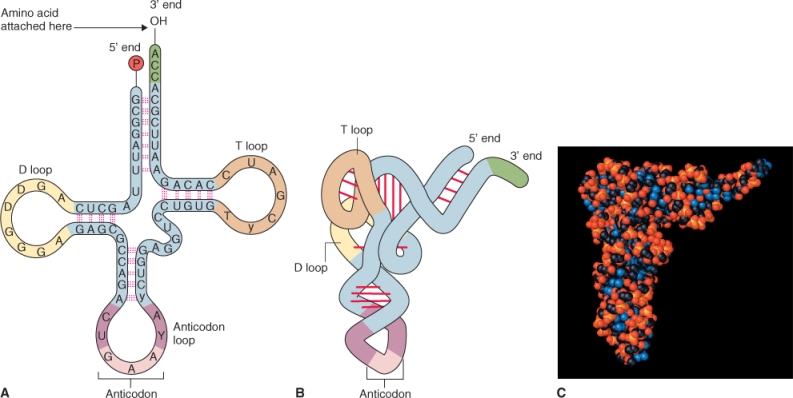
Transfer RNAs are small RNA molecules, generally 70–90 nucleotides long. Each tRNA has a position to which a specific amino acid can be attached and a three-nucleotide anticodon sequence that base-pairs only with the mRNA triplet that encodes the bound amino acid. Base-pairing within the tRNA sequence results in an L-shaped three-dimensional conformation that exposes the anticodon and enables base-pairing with the complementary codon in the mRNA sequence (Figure 3.39). The attachment of specific amino acids to the 3′ ends of tRNA molecules is catalyzed by specific aminoacyl-tRNA synthetases. A tRNA with an attached amino acid is said to be aminoacylated or ‘charged’ and is represented as aa-tRNAaa (e.g. Phe-tRNAPhe). Together the ribosome and aa-tRNAs participate in decoding the information carried in the nucleotide sequence of the mRNA.
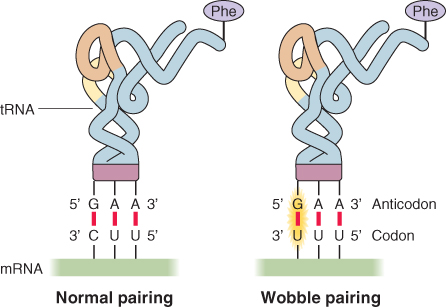
While there are 61 codons that specify amino acids, there are only 30–40 different tRNAs, depending on species. This is possible because some of the tRNAs can recognize more than one codon for their particular amino acid; for example, both the codons 5′-UUU-3′ and 5′-UUC-3′ are translated to the same amino acid: phenylalanine. This is possible because the 5′-GAA-3′ anticodon of a single phenylalanine tRNA can pair with either of the two phenylalanine codons in mRNA (Figure 3.40). One is an exact match; the other has a mismatch at the third nucleotide of the codon, resulting in what is known as wobble-pairing. This phenomenon allows 30–40 different tRNAs to read the 61 codons that specify amino acids in the genetic code. Wobble-pairing can only occur with certain combinations of anticodon–codon, which is why more than 30, not just 20, different tRNAs are required to translate the 61 possible codons into amino acids.
3.6.2 Protein Biosynthesis takes Place on Ribosomes
Protein synthesis takes place on structures called ribosomes, which contain ribosomal RNA (rRNA) and proteins (see Table 3.4). The ribosomes found in the cytosol are larger (80S) than those found in mitochondria and plastids (70S); organellar ribosomes resemble those found in prokaryotic cells. Each ribosome consists of two subunits, referred to as the large and small subunits, based on their relative S values. Each subunit in turn contains one or more rRNAs, which fold into highly ordered structures and associate with proteins. Plant cytosolic ribosomes can contain up to 80 proteins that are highly conserved between species. They are mostly basic (positively charged), which facilitates their interaction with negatively charged rRNA. However, cytosolic ribosomes also contain a small family of acidic proteins, called the P-proteins. One of those found in plants, P3, is not found in other eukaryotes.
A ribosome reads the mRNA-coding sequence in a 5′ to 3′ direction, directing the addition of the amino acid corresponding to each codon and extending the growing polypeptide chain from the amino (or N) terminus to the carboxy (or C) terminus (Figure 3.41). Proteins are synthesized on ribosomes in a process comprising three distinct phases: initiation, elongation and termination. Each of these phases requires the participation of specific protein factors named according to the phase in which they are involved: respectively eukaryotic initiation factors (eIFs), eukaryotic elongation factors (eEFs) and eukaryotic release factors (eRFs). In the next several sections we will explore each of these phases and the roles that protein factors play in each.
3.6.3 Protein Synthesis is Initiated from the 5′ End of the mRNA
Protein synthesis begins at the universal start codon AUG that encodes the amino acid methionine. Thus a methionine residue or a derivative is at the N terminus of every nascent (growing) polypeptide. Often the N-terminal methionine is removed during post-translational processing. There are two different tRNAs that carry the anticodon that specifies methionine. One of these is a specific initiator, tRNAiMet, which only functions to deliver the N-terminal methionine to the start codon. The other Met-tRNAMet species carries the rest of the methionines incorporated into the elongating polypeptide chain. Initiation at the start codon establishes the reading frame (the phase in which the triplets in the mRNA are read).
Key Points
Translation of messenger RNA to the protein it encodes is dependent on the triplet code, in which each group of three nucleotides, or codon, in the DNA of the gene encodes an amino acid in the protein product. There are 64 possible trinucleotide codons; three of them are used as stop codons, identifying positions in the DNA where transcription of the mRNA terminates, and the other 61 encode amino acids. The genetic code is said to be degenerate because in most cases a given amino acid can be specified by more than one codon. Transfer RNAs are the adaptor molecules that recognize codons in mRNA and ensure that they are translated into the correct amino acids. Protein biosynthesis takes place on ribosomes, structures that contain ribosomal RNAs and proteins.
During the initiation phase of protein synthesis, a 40S ribosomal subunit with an attached Met − tRNAiMet binds to the 5′ end of an mRNA. It then scans along the mRNA until it encounters a start codon. This process is complex and requires the participation of a number of auxiliary proteins referred to as eukaryotic initiation factors (Figure 3.42). First, the factor eIF2 interacts with initiator Met-tRNAMet and GTP to form an RNA–protein ternary complex. Next, the ternary complex binds to a free 40S ribosomal subunit to form a preinitiation complex, a process that is facilitated by several other eIFs (Figure 3.42). Members of the elF4 initiator family assemble around the 5′ cap of an mRNA, allowing the ribosomal subunit–Met-tRNA-eIF complex to bind. The complex scans down the mRNA until it encounters the Met start codon where the initiator Met-tRNAMet base-pairs with the start codon. At this point, the eIFs of the initiation complex are released. Finally, the large ribosomal subunit associates with the small subunit, positioning the initiator Met-tRNAMet in the P site (peptidyl-tRNA-binding site) on the large subunit. Members of the eIF5 family participate in positioning the large subunit and in the release of GDP, the product of GTP hydrolysis (Figure 3.42). Now everything is in place and protein synthesis can begin. Translation-level regulation of gene expression in eukaryotes occurs primarily at the initiation step. In this respect, the participation of eIF2 and GTP and the release of GDP are important control points.
3.6.4 Polypeptide Chain Elongation Occurs by the Sequential Addition of Amino Acid Residues to the Growing Polypeptide Chain
At the end of the initiation phase there is an initiator tRNAMet in the P site of the ribosome; in subsequent steps in the synthesis cycle this site will be occupied by the aa-tRNA that holds the growing polypeptide chain. During the elongation phase of protein synthesis, a ribosome holds mRNA and tRNAs loaded with amino acids in position and the peptidyl transferase site of the ribosome catalyzes the formation of peptide bonds between successive amino acids to build up the polypeptide chain (Figure 3.43). The addition of amino acids to a growing polypeptide chain requires three sites on the fully assembled ribosome, known as the A, P and E sites. These three sites are used in turn, in a cycle that takes as little as a twentieth of a second to add an amino acid to the chain. The process of chain elongation requires three elongation factors: eEF1A, eEF1B and eEF2.
Elongation factor eEF1A binds to aa-tRNAs and GTP delivers them to the A site (aminoacyl-tRNA-binding site; also known as the decoding site) on the ribosome where the next codon on the mRNA is exposed. If the aa-tRNA anticodon is complementary to the mRNA codon in the A site, GTP is hydrolyzed, causing a conformational change in the aa-tRNA in the A site. This brings the amino acid on that tRNA closer to the amino acid on the tRNA in the P site. Also eEF1A-GDP is released during this step; it is subsequently cleaved by eEF1B to allow recycling of eEF1A.
Now, the peptidyl transferase center of the ribosome catalyzes the formation of a peptide bond between the amino acids attached to the tRNAs in the A and P sites. During this process, the growing polypeptide chain is passed from the tRNA in the P site to the aa-tRNA in the A site. The ribosome then moves along the mRNA in a process called translocation that is catalyzed by eEF2 and requires GTP hydrolysis. As the ribosome moves the now deacylated tRNA is transferred from the P site to the E site (exit site) from which it will leave the ribosome during the next cycle. Simultaneously, the tRNA with the attached peptide chain is repositioned to the P site and a new codon is exposed at the A site. The next cycle of amino acid addition to the peptide chain can begin.
A single 80S ribosome occupies about 30–35 nucleotides on an mRNA. Once a ribosome has started to read an mRNA, it moves downstream. This exposes the start codon, and allows a second ribosome to initiate translation of the same mRNA. Thus, when an mRNA is being actively translated, it is usually associated with several ribosomes, separated by as few as 80–100 nucleotides, forming a polyribosome or polysome (Figure 3.44). Depending on the proteins they are synthesizing, polyribosomes may be free in the cytosol or attached to the endoplasmic reticulum (ER).
3.6.5 Protein Synthesis Terminates when a Stop Codon is Reached
When a ribosome reaches one of three stop codons on the mRNA (UAA, UAG or UGA), this is a signal that polypeptide chain elongation should cease (Figure 3.45). For protein synthesis to terminate, two specific proteins, known as release factors, eRF1 and eRF3, must bind to the A site. eRF1 is a protein that structurally mimics tRNAs and recognizes all three stop codons. It binds eRF3, which has a bound GTP. Interaction between the RFs and the ribosome sets off a series of events. Hydrolysis of GTP by RF3 catalyzes the cleavage of the bond between the completed polypeptide chain and the final tRNA molecule at the P site, releasing the polypeptide from the ribosome. It also stimulates the release of the RFs from the ribosome. At this point the tRNAs and the ribosome are also released from the mRNA and become available to participate in another cycle of translation. The ribosome may dissociate into its small and large subunits at this point, a process promoted by eIF6. However, this may not occur until small subunits are required for further translation, so intact ribosomes lacking an mRNA often accumulate when initiation of translation is limited, such as under conditions of stress (for example, hypoxia, heat shock or dehydration stress).
3.6.6 Most Proteins Undergo Post-transcriptional Modifications
A newly synthesized polypeptide frequently undergoes further modifications to reach its final form as a mature, functional protein. First, some of the amino acids may undergo covalent modification by the addition of acetyl, phosphate or other groups. Second, the polypeptide must be folded into its correct three-dimensional structure. Examples of three-dimensional protein structures are shown elsewhere in this book. Third, many proteins consist of two or more subunits, which must assemble to form a functional protein. For example, the major lectin of mistletoe (Viscum album), which is highly toxic to humans and other animals, is a heterodimer (Figure 3.46), meaning that it has two non-identical subunits. Its 1A subunit is 254 amino acids in length, while the 1B subunit is 263 amino acids long. Lectins are carbohydrate-binding molecules, and in the mistletoe lectin, the 1B subunit binds to the sugar-containing backbone of the 28S ribosomal RNA subunit while the 1A subunit cleaves an adenine base from the ribosomal RNA, blocking protein synthesis at the elongation stage and leading to cell death.
Key Points
The synthesis of a protein is initiated from the 5′ end of the mRNA, at the start codon AUG. Initiation requires several proteins known as initiation factors, in addition to mRNA and ribosomes. Elongation of the polypeptide chain occurs by the sequential addition of amino acid residues. A ribosome holds the mRNA and transfer RNAs loaded with the appropriate amino acids in position so that the peptidyl transferase site of the ribosome can catalyze the formation of peptide bonds between successive amino acids. Elongation continues until a stop codon is reached; then the new polypeptide is released and the ribosome and mRNA dissociate. Newly-synthesized polypeptides often undergo post-transcriptional modifications to become mature, functional proteins. These modifications include covalent additions of acetyl, phosphate or other groups, and folding of the polypeptide into the correct secondary, tertiary and, where appropriate, quaternary structure.
3.7 Expression of Organellar Genes
So far we have focused on the transcription and translation of nuclear genes. As described in Section 3.2, chloroplasts and mitochondria also have genomes that encode RNAs and proteins. The expression of chloroplast and mitochondrial genes is in many important respects like that of nuclear genes. It consists of DNA transcription by RNA polymerase to produce RNA, followed, in the case of protein-coding genes, by translation of mRNA on ribosomes to make polypeptides. However, the details of the gene expression process in chloroplasts and mitochondria more closely resemble what takes place in bacteria, reflecting the origins of these organelles as prokaryotic endosymbionts. Chloroplast gene expression has been much more intensively studied than plant mitochondrial gene expression. Mitochondrial gene expression in plants is similar to that in other eukaryotes, and will not be further discussed here.
3.7.1 The Machinery of Chloroplast Gene Expression Resembles that of Bacteria more than that of Nuclear Genes
The main RNA polymerase of chloroplasts is similar to that of bacteria, consisting of a core of four subunits (two of them identical) and one of the several regulatory subunits encoded by the plastid genome. This polymerase recognizes genes with promoter regions similar to the bacterial −10 and −35 sequences, so called because they lie approximately 10 and 35 nucleotides, respectively, upstream from the transcription initiation site. However, not all chloroplast genes have such promoter sequences. Plants also have a nuclear-encoded RNA polymerase that is imported into the plastid and can recognize alternative promoter sequences.
The ribosomes, messenger RNAs, enzymes and other components needed for the synthesis of chloroplast-encoded proteins are different from those used for the synthesis of nuclear-encoded proteins. The numbers and functions of specific initiation factors in the plastid are considerably different from those of the cytosol. Bioinformatic analysis has shown that plastids have homologs to the bacterial initiation factors IF1, IF2 and IF3. Similarly, the elongation factors, the termination factors and the ribosome recycling factor of plastids have sequence homology to the bacterial equivalents rather than the eukaryotic ones.
Plastid ribosomes contain homologs of almost all the ribosomal proteins found in bacteria, but there are also plastid-specific ribosomal proteins (PSRPs) that have no bacterial equivalents. The number of these PSRPs varies between different plant species; for example, spinach chloroplast ribosomes have six of them, four in the small subunit and two in the large subunit. It has been suggested that some of the PSRPs may have roles in the regulation of protein synthesis by light, an important property of chloroplasts but not of mitochondria or the majority of bacteria.
3.7.2 Transcripts Encoded by the Plastid Genome are often Polycistronic and are Translated by Prokaryotic-type Mechanisms
One of the key differences between the translation systems of the chloroplast and cytosol is the way in which the initiation signal on the mRNA is selected. While cytosolic mRNAs have a 5′ cap, which flags the 5′ end for initiation factors, plastid mRNAs are not capped. Like bacterial mRNAs, they are often transcribed in the first instance as polycistronic messages with the potential to be translated to several proteins.
In bacterial systems, the correct AUG codon for initiation is selected by the 16S rRNA in the small (30S) subunit, which can base-pair with a short sequence found just upstream of the initiation AUG. This sequence, which is called the Shine/Dalgarno sequence after its discoverers, directs selection of the start codon by the 30S subunit. The secondary structure of the mRNA is also important in determining the efficiency of translational initiation.
The plastids of some plants use a mechanism similar to the bacterial system. In such species, the chloroplast mRNAs contain a Shine/Dalgarno sequence upstream from the start codon (Figure 3.47). This sequence, together with the secondary structure of the mRNA surrounding the start codon, plays an important role in initiation of translation. In contrast, plastid mRNAs of other plant species do not contain a Shine/Dalgarno sequence within 20 nucleotides of the start codon. In these mRNAs the translational start site is specified by the presence of an AUG region of the mRNA with little or no secondary structure (Figure 3.48) and evidence suggests that in many of these cases a nuclear-encoded protein is also required to facilitate initiation.
Key Points
The expression of chloroplast and mitochondrial genes follows the central dogma of molecular biology: DNA → RNA → protein. Organellar DNA is transcribed by RNA polymerase to produce RNA and, in the case of protein-coding genes, RNA is then translated on ribosomes to make polypeptides. The details of ribosome structure, initiation factors and gene expression in chloroplasts and mitochondria are more similar to those of eubacteria than to those of the nucleus and cytoplasm, reflecting the endosymbiotic origins of plastids and mitochondria. Mitochondrial gene expression in plants is similar to that in other eukaryotes. The main RNA polymerase of chloroplasts resembles that of bacteria, and can recognize promoter regions similar to bacterial promoter sequences. Because some chloroplasts lack such promoter regions, chloroplasts also import a nuclear-derived RNA polymerase that can recognize alternative promoters. Selection of the correct site for translation initiation on plastid RNAs is achieved by one of two mechanisms. The first is similar to that used in bacteria, whereas the other appears specific to plastids.
