1
Prime suspect: murder in Britain1
Introduction
Murder is part of our everyday lives. Depending on the television schedules, we are exposed to far more fictional murders per day in Britain than actually occur across the whole country in a week, a month or even a year. The few actual murders that take place (between one and two a day on average) are brought vividly to our attention through newspapers, radio and television news. Murder sells the media. It buys votes through fear. Its presence almost certainly leads to many of us curtailing our daily activities, treating strangers in strange ways, avoiding travelling through parts of towns and cities, worrying who our children will meet. Our daily exposure to the fact and fiction of murder seeps into our subconscious and alters our attitudes and behaviour. The majority of people in Britain have traditionally favoured a return of the death sentence for the perpetrators of this rarest of crimes. They would sanction this murder, because they see murder as the isolated acts of individuals and so they think that if you kill the killer the killing goes away. What, though, really lies behind murder?
A classic, and ever more popular, way in which murder is portrayed is through the eyes of its victims. The pathologist has taken a lead role in the story of murder that they tell through the bodies and reconstructed lives of their silent witnesses, second only to the murder detective. What would we see if we were to take that approach, but not with one murder, a dozen, or even a hundred or so, but with the thousands of murders that have taken place across the whole country over many years? Such an approach has the disadvantage of reducing each event to just a short series of facts, and turning detailed individual stories into numbers and rates. However, it has the advantage of preventing extrapolation from just a few events to produce unjustified generalisations and encourages us to look deeper for the root causes of murder. It also makes us treat each murdered victim as equal, rather than concentrating on the most complex, unusual or topical of murders, and it can be turned back into individual stories of particular people in places and times. This chapter attempts to illustrate the advantages of such an approach to the study of murder. To follow this story you need to follow the twists and turns of homicide statistics, social indices, and population estimates, rather than modus operandi, suspects, bodies and weapons; but this is just as much a murder story as the conventional one. Here, however, is a factual story of 13,000 murders rather than one, and of a search for underlying rather than superficial causes.
This chapter is structured through asking five simple questions:
- who was murdered?
- when were they murdered?
- where were they murdered?
- with what were they murdered? and, finally,
- why were they murdered?
The killer, as is traditional, is not revealed until the end and, as is tradition, there is a twist to the plot. But, although this story is told in a dispassionate way, it is a story of real people and actual events. The story behind the thousands of murder stories is more a testament to our shared inhumanity than a thriller. Murder, behind the headlines, is the story of the connected consequences to our collective actions. Murder, despite being the rarest of crimes, tells us in the round a great deal about millions of us who will never be even remotely connected to such a death directly.
Who was murdered?
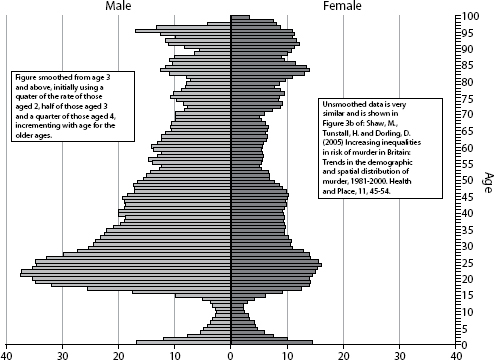
Between January 1981 and December 2000, approximately 13,140 people were murdered in Britain, on average 1.8 per day. The number is approximate because about 13 per cent of deaths which were initially recorded as murder are later determined not to have been murders and thus the numbers are revised periodically (these deaths have been excluded here). Similarly, deaths not thought to have been murders can subsequently be reclassified as murder. Figure 1 shows the rates of murder in Britain by single year of age and sex.2
Figure 1 tells us many things. The overall 20 year average British murder rate that can be calculated from it of 12.6 murders per year per million people is of little meaning for anything other than international comparisons (British rates are low), for reassuring the population (99.88 per cent of people are not murdered), or for scaring them (you are 176 times more likely to be murdered than win the lottery with one ticket). More usefully, the rate for men, at 17 per million per year is roughly twice that for women (at nine per million per year). The single age group with the highest murder rate are boys under the age of one (40 per million per year) and then men aged 21 (38 per million per year). A quarter of all murders are of men aged between 17 and 32. A man’s chance of being murdered doubles between the age of 10 and 14, doubles again between 14 and 15, 15 and 16, 16 and 19 and then does not halve until age 46 and again by age 71 to be roughly the same then as it stood at age 15. Rates rise slightly at some very old ages for both men and women although at these ages the numbers of deaths attributed to murder are very small (as the population falls).
We often tend to concentrate far more upon the characteristics of the direct perpetrators and the immediate circumstances leading up to murder than on the characteristics of the victims or the longer-term context in which murder occurs. For instance, 50 per cent of female homicide victims killed by men are killed by their current or former male partner; it is almost always parents but occasionally other family or acquaintances who kill infants; and alcohol is a factor in just over half of murders by men of men (Brookman and Maguire, 2003). However, researchers commissioned to consider the short-term causes of homicide also know that:
… there is evidence of a strong correlation between homicide rates and levels of poverty and social inequality, and it may be that, in the long-run, significant and lasting reductions in homicide can best be achieved by strategies which take this fully into account. (Brookman and Maguire, 2003, p 2)
Figure 1 suffers from only telling us what the chances of an average person of particular age and sex are of being murdered in Britain in a year. For any particular person those rates will vary dramatically according to knowing more about exactly who they are, where they live and so on. Before turning to those facts the next step is to determine the importance of when they were murdered.
Figure 1: Rate of murder per million per year, in Britain, 1981-2000, by sex and age
When were they murdered?
Both the number of murders and the rate of murder have doubled in England and Wales in the 35 years since the official series began. Figure 2 shows this series (Flood-Page and Taylor, 2003, Table 1.01). It is very likely that the numbers for the last two years will be reduced as some of these offences come to be no longer regarded as homicide in the future, but it is unlikely that they will be reduced by much. Thus, until recent years the increase in the murder rate was slowly falling. In the first half of the 1970s the smoothed murder rate rose by 22 per cent in five years, it rose by 13 per cent in the subsequent five years, by four per cent in the first half of the 1980s, three per cent in the latter half of the 1980s, eight per cent in the first half of the 1990s and 14 per cent in the latter half of that decade. In answer to the question of when, victims are more likely to have been murdered more recently.
Figure 2: Offences currently recorded as homicide, England and Wales, 1967-2001
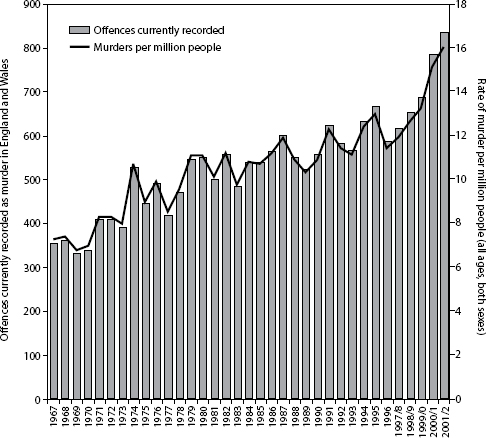
Note: The bars are number of murders now thought to have been committed in that year taking into account later reclassifications and acquittals (scale on left hand axis), the line is the rate of murder per million people (for which the scale is provided on the right hand axis).
At first glance, Figure 2 appears to imply that murder rates have risen. However, for the majority of the population this turns out, on closer inspection, not to be the case. From here on, data for deaths occurring in the years 2001 or 2002 will not be used as we cannot yet be sure of their reliability.3 Instead the four five-year time periods from 1981 to 2000 will be compared (see Rooney and Devis, 1999 for more details of time trends). It is important to remember that in calculating a murder rate it is not only the number of people who are murdered that changes over time, but also the number of people living who could be murdered.
Figure 3 shows the percentage changes in the murder rates that taken together all contribute to the overall change shown in Figure 2. Most strikingly, for all ages of women, other than infant girls, the murder rate has either fallen or hardly changed; for women aged 65 to 69 it fell to less than half its early 1980s levels. Murder rates have also fallen for men aged 60 and above and boys under five. For a majority of the population, given their ages and sexes, their chances of being murdered have fallen over time, in some cases considerably. How then has the overall rate increased? For all males aged between five and 59, murder rates have increased significantly.
Figure 3: Change in the murder rate, Britain, 1981–1985 to 1996–2000 by age group and sex
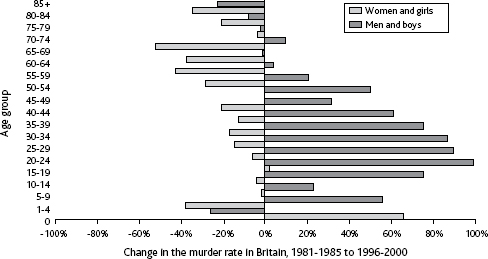
At the extreme they have doubled for men aged 20 to 24 over the course of these two decades. The increase in the murder rate of men, and particularly young men is enough to more than outweigh the decreases that most groups have experienced over time. Of course, this is not true of all people, and so we next turn to where these changes have occurred.
Where were they murdered?
Having considered who is most likely to be murdered given their age and sex and how these rates are changing over time, the next step in the process is to consider where these murders take place. As already touched on, it is obvious to the public at large, and to criminologists who consider murder in detail, that place matters. Living in the United States is more dangerous no matter whatever age you are, compared with Britain. But then there are many places within the US with lower murder rates than places in Britain. Places are far harder to categorise than people’s ages or sex, or time. However, we know that the key component to what makes one place more dangerous to live in than another is poverty. The poorer the place you live in, the more likely you are to be murdered. But just how much more likely and how is that changing?
In Britain the most sensible measure of poverty is the Breadline Britain index, which can be used to calculate, for each ward in the country, the proportion of households living in poverty (Gordon, 1995)4. The results of applying this methodology are simple to interpret and also remarkable. They are shown in Table 1. The first line of this table indicates that in the least poor areas of Britain, we find that for every 100 people we would expect to be murdered given how many people live there, only 54 were murdered at the start of the 1980s and only 50 by the end, a fall of four per 100 expected (or four per cent).
Table 1: Standardised mortality ratios (SMRs) for murder in Britain, by ward poverty, 1981–2000
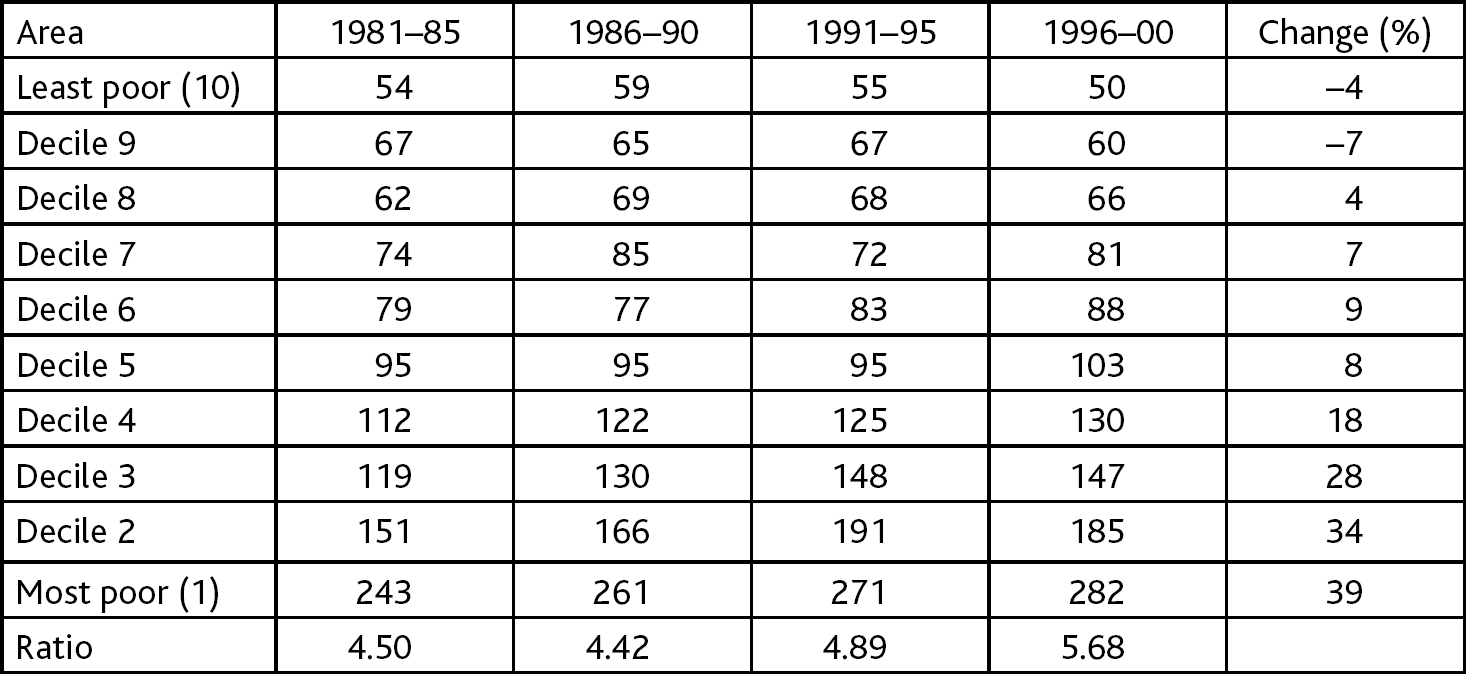
Note: Expected values are based on 1981–85 national rates (100 is the national average)
In the five years 1981-85, people living in the poorest ten per cent of wards in Britain were four and a half times more likely to be murdered than those living in the least poor 10 per cent. Furthermore, the SMR for murder rises monotonically (always in the same direction) with poverty: for every increase in poverty there is a rise in the murder rate, such that people living in the poorest tenth of Britain were 143 per cent more likely than average to be murdered. This rose in the successive five year periods to 161 per cent, 171 per cent and then 182 per cent above the average SMR of 100. Most surprisingly, despite the overall national doubling of the murder rate over this time, people living in the least poor 20 per cent of Britain saw their already very low rates of murder fall further. The increase in murder was concentrated almost exclusively in the poorer parts of Britain and most strongly in its poorest tenth of wards. By the 1990s the excess deaths due to murder in the poorest half of Britain amounted to around 200 per year, that is murders that would not occur if these places experienced average rates. Just over half of that number related to excess murders amongst the poorest tenth of the population. The rise in murder in Britain has been concentrated almost exclusively in men of working age living in the poorest parts of the country.
With what were they murdered?
What is causing these murders? How are they being committed? Is it a rise in the use of guns? These are superficial questions. It is what lies behind the murder rate that matters. A rise in drug use? Again superficial, it’s what might lie behind that. Nevertheless, it is worth looking at how people by place are killed if only to help dispel some myths. The cause of death by method is specified on the death certificates of a proportion of those who are murdered. In many cases the exact cause is unspecified. If we take those cases for which a cause is specified then five main causes account for almost all murders: a fight (ICD E960), poison (ICD E962), strangling (ICD E963), use of firearms (ICD E965) or cutting (ICD E966). Figure 4 shows the proportion of murders attributed to these methods and all other causes for all murders in each ward of Britain grouped by poverty rate between 1981 and 2000.
Figure 4: Methods of murder by ward poverty, Britain, 1981–2000
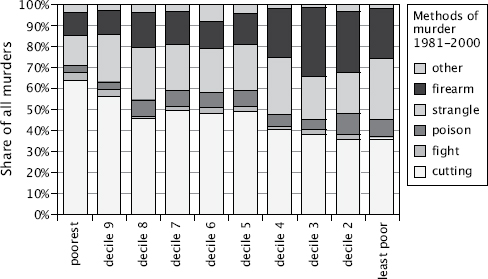
Wards of Britain ranked and grouped into equalpopulation sized groups by poverty rates
The most important myth to dispel is that of gun crimes being a key factor behind the high murder rates in poor areas. Firearms account for only 11 per cent of murders in the poorest wards of Britain compared to 29 per cent of murders in the least poor areas. The more affluent an area, the more likely it is that guns will be used when murders are committed. The simple reason for this is that there are more guns in more affluent areas. There might be more legal shotguns rather than illegal handguns over the 20 years, but mortality is raised by roughly an additional five murders a year (roughly one extra murder per million people living there). There has been no change in the proportion of murders committed with firearms in richer areas, despite the introduction of legislation designed to limit their use.
The most common way in which people are murdered in the poorest fifth of areas in Britain is through being cut with a knife or broken glass/bottle or (in only four per cent of cases, but still the largest proportion of any decile area) in a fight – usually through kicking. A higher proportion of people are poisoned or strangled in more affluent areas. In fact the use of poison in murder has increased its share by 15 per cent in the least poor areas over the 20 years. Perhaps those murders still occurring in more affluent areas are becoming a little more premeditated there? In almost all areas the proportion of murders attributable to strangling is falling. This may well reflect the fall in the murder rate of women by men. This brief summary has concentrated on what is changing. In the round, however, much the same methods of murder are used now as were used 20 years ago, just more often in poorer areas and less often in the less poor parts of Britain.
Why are they murdered?
Our final, fifth, question is ‘why?’ Why are some people much more likely to be murdered than others and why are the rates of murder in Britain changing as they are? These are the most difficult of all the questions to address, but clearly the most important. In a way, the answer to the second part of the question – why are the rates changing as they are? – can help answer the first – why are some people much more likely to be murdered? Table 2, is complicated but attempts to show how the changes can be examined in much more detail to try to uncover the reasons behind the rising overall murder rate.
Table 2 shows the murder rate of all men in Britain by age from 11 to 50. The table begins in 1993 because this was the first year in which deaths were recorded by year of occurrence rather than registration (year-on-year variations are unreliable before then). The rates have been smoothed slightly to make them more reliable, which has the effect of reducing the highest rates slightly. The first line of the table shows that the murder rate of 11-year-old boys has fluctuated between one and three per million over these eight years while the murder rate of the group now most at risk of murder, 21 year old men, has risen from 31 per million in 1993 to 51 per million by 2000. The figures in the table are shaded to allow for easier reading and it is the pattern to the shading that provides our clue as to why murder rates are rising. The shading forms a triangle and, on these kinds of figures a triangle indicates what is known as a cohort effect. A cohort effect is something which affects people born in a particular year or group of years.
Take a man born in 1960. At age 33, in 1993, his cohort suffered a murder rate of 24 per million; this went up and down slightly as he aged but was still 24 per million by the time he was 40 in 2000. The murder rates that these, now older, men experience in Britain are not falling as they age, and, in general, each successive cohort is starting out with a higher murder rate at around age 20 to 21 and carrying that forward. However, for one particular group of men their murder rate is actually generally increasing as they age – men aged 35 or below in 2000, men born in 1965 and after. Why should they be different to men born in 1964 or before? Most men born in 1965 left school at the age of 16 in the summer of 1981 (some may have left at 15 slightly earlier, only a small minority carried on to take A Levels. The summer of 1981 was the first summer for over 40 years that a young man living in a poor area would find work or training very scarce, and it got worse in the years that followed. When the recession of the early 1980s hit, mass unemployment was concentrated on the young, they were simply not recruited. Over time the harm caused in the summer of 1981 was spread a little more evenly; life became more difficult for slightly older men, while most of the younger men were, eventually, employed. However, the seeds that were sown then; that date at which something changed to lead to the rise in murders in the rest of the 1980s and 1990s, can still be seen through the pattern of murder by age and year shown in the figure. Above the cohort of the 1965 line, shown in bold in Table 2, murder rates for men tend to rise as they age.
Table 2: Murder rates per million in Britain, by age/cohort, 1993–2000

Notes: The statistics in this table are the murder rates per million per year of all men in Britain by single year of age and by the year in which they were murdered (due to small number problems the statistics have been smoothed by two passes of a simple two dimensional binomial filter). To aid reading, the table cells are shaded by value. A bold line demarcates the cohort of 1965 who were aged 28 in 1993 and 35 in 2000.
Table 2 concerns all men, there are too few murders and we know with too little accuracy the numbers of men by single year of age living in each ward in the country in each year to be able to produce the same exhibit for men living in poor areas. Nevertheless, we can be almost certain that this rise is concentrated in the poorest parts of Britain and is far greater there. Most worryingly, in the most recent years the rates for the youngest men have reached unprecedented levels. If these men carry these rates with them as they age, or worse, if their rates rise as have those before them, overall murder rates in Britain will continue to rise despite still falling for the majority of the population in most places.
There is no natural level of murder. Very low rates of murder can fall yet lower as we have seen for older women and in the more affluent parts of the country. For murder rates to rise in particular places, and for a particular group of people living there, life in general has to be made more difficult to live, people have to be made to feel more worthless. Then there are more fights, more brawls, more scuffles, more bottles and more knives and more young men die. These are the same groups of young men for whom suicide rates are rising, the same groups of which almost a million left the country in the 1990s unknown to the authorities, presumably to find somewhere better to live. These are the same young men who saw many of their counterparts, brought up in better circumstances and in different parts of Britain gain good work, or university education, or both, and become richer than any similarly sized cohort of such young ages in British history. The lives of men born since 1964 have polarised, and the polarisation, inequality, curtailed opportunities and hopelessness have bred fear, violence and murder.
Why is the pattern so different for women? One explanation could be that the rise in opportunities (amongst them work, education and financial independence) for women outweighed the effects of growing inequalities. Extreme ‘domestic’ violence leading to murder, almost always of women, has fallen dramatically over this time period. Women’s rates of suicide are also falling for all age groups of women and there has been no exodus of young women from Britain as the 2001 census revealed had occurred for men. Women working in the sex industry still suffer very high rates of murder, but to attempt to identify these deaths through the postcodes of the victims would be taking ecological analysis a step too far. There were also several hundred people, mostly elderly women, murdered by Harold Shipman and these deaths are not included in any of the figures here (he wrote the death certificates and only a few cases were formally investigated at his trial – and thus officially reclassified as murders). But even taking these into account, the fall in extreme violence suffered by women in Britain implies that when a group gains more self-worth, power, work, education and opportunity, murder falls.
Conclusion
Murder is a social marker. The murder rate tells us far more about society and how it is changing than each individual murder tells us about the individuals involved. The vast majority of the 13,000 murders that have been considered here were not carefully planned and executed crimes; they were acts of sudden violence, premeditated only for a few minutes or seconds, probably without the intent to actually kill in many cases (often those involved were drunk). There will have been hundreds of thousands of similar incidents over this time period that could just as easily have led to murder, but did not. There will have been millions of serious fights, and assaults beyond this and beyond that tens of millions, even hundreds of millions of minor acts of violence and intimidation. Murders are placed at the tip of this pyramid of social harm and their changing numbers and distributions provide one of the key clues as to where harm is most and least distributed. Behind the man with the knife is the man who sold him the knife, the man who did not give him a job, the man who decided that his school did not need funding, the man who closed down the branch plant where he could have worked, the man who decided to reduce benefit levels so that a black economy grew, all the way back to the woman who only noticed ‘those inner cities’ some six years after the summer of 1981, and the people who voted to keep her in office. The harm done to one generation has repercussions long after that harm is first acted out. Those who perpetrated the social violence that was done to the lives of young men starting some 20 years ago are the prime suspects for most of the murders in Britain.
Endnote
This paper was originally published as a chapter in the booklet Criminal Obsessions: Why Harm Matters More Than Crime published by the Crime and Society Foundation in 2005. The day after the booklet was published The Times newspaper ran a story on the research. Referring to the last sentence of that story I sent a letter to The Times that day but they did not have space to print it. Below is what it said. The patterns to the trends in murder suggest that threats of violence are not what deters violence. Similarly, record rises in the incarceration rates of young men have been accompanied by the rise in violence reported above. The rise in incarceration is not due to the rise in the murder rate of young men. Only a tiny minority of men who are in prison are convicted of murder or attempted murder. Neither killing nor locking up the killer makes the killing go away. Instead, when a group gains more respect they become more powerful and are less likely to become victims. Take away respect and you increase vulnerability.
Dear Sir
Your report on my Crime and Society Foundation study (Alcohol fuels murder rate for young men, The Times, 17 October) ended with the statement that it “found that the number and rate of murder had doubled since 1967 – just after hanging was abolished.” The study made no link between the abolition of hanging and the rise in the national murder rate. The only mention of hanging in the report was that it is false to think that “if you kill the killer the killing goes away.” National murder rates rose not only after 1967, but after 1969, 1970, 1973, 1975, 1977, 1978, 1979, 1981 and so on. The date of 1967 was included in the report because that was when the Home Office data series began. The view that abolishing hanging increased the overall murder rate does not explain why murder rates reduced for almost all groups of women, children and pensioners over this period. Indeed the United States, where the death penalty is still in use in many states, reports much higher rates of murder than does the UK.
Yours sincerely,
Danny Dorling