4
Unequal Britain
A new report highlights the growing gap between rich and poor in Britain – it’s a mess and it’s getting worse…
The Joseph Rowntree Foundation released two reports last week. One showed that the British public says the gap between rich and poor is too large. The other, which seven colleagues and I produced, mapped how poverty and wealth have been distributed and redistributed across Britain since 1968. It shows that the gap between rich and poor is currently the highest it has been in 40 years.
We began in 1968, not because it was a year of student unrest and the time of the “summer of love”, but because towards the end of that year and into 1969 the first national survey of poverty in Britain was quietly being undertaken.
A year that began with the Tet Offensive in Vietnam and ended with the earth being photographed from Apollo 8 is not remembered for the surveying of British living conditions on a national scale for the first time – a survey that revealed, among other things, that most ordinary folk did not take a holiday in those years. However, 1968 was the time we began to care in earnest – and the study of poverty stopped being the preserve of the sons of rich men and became part of public policy.
This started through the efforts of Peter Townsend and his fellow researchers at the University of Essex. Townsend’s was the first national survey of poverty, and the first fully computerised census took place just a few years later. Because of this the late 1960s to early 1970s is as far back as we can go to look at the distribution of poverty using modern social science methods and modern concepts, such as social exclusion.
Poverty since those times has been defined as being excluded from participation in the norms of society due to lack of material resources.
Holiday
Today, being able to afford an annual holiday that amounts to more than simply staying with your relatives is considered part of the norms of society.
Not being able to afford such a holiday is a marker of poverty.
Because most people in 1968 did not take an annual holiday, lack of holidays was not a marker of poverty then. It is now. As material living standards rise, what it means to be poor changes.
Figure 1: Poverty in Yorkshire in 1980 and 2000
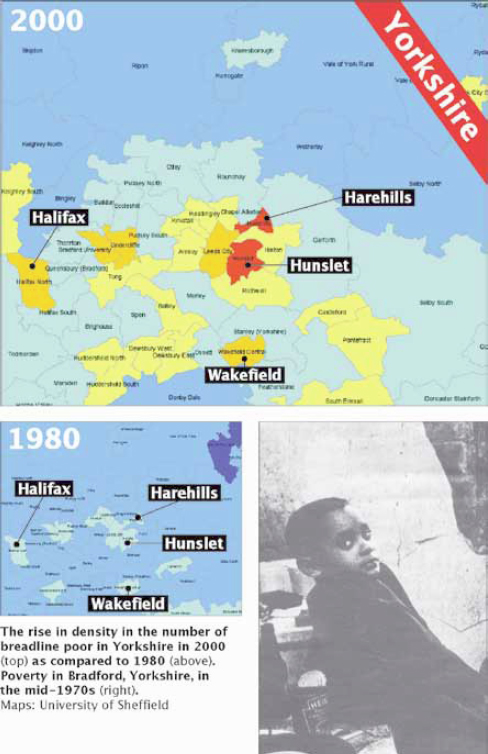
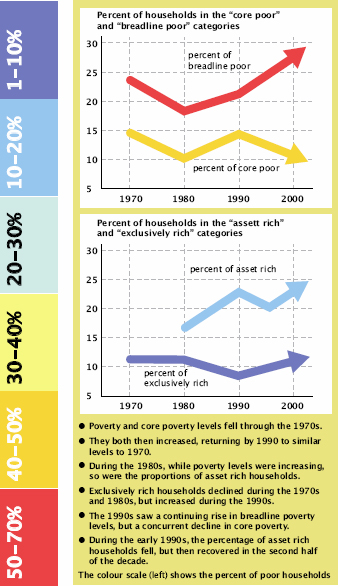
Figure 2: Time Trends
Go back another 39 years to see how this works. Living standards in 1968 were materially far better than in 1929, and yet looking back on 1968 from today we would not say that the standards were fine.
People should be able to take a holiday at least once a year, have access to hot water in their home and so on. Yet at the time when Townsend’s survey was taken many thought that poverty had been all but eradicated. Today many would argue in just the same way that even the poorest have never had it so good.
But everyone knows that you are poor when you cannot afford an annual holiday in Britain and have problems making ends meet each month, while others jet around the world and find it hard to buy enough to spend their “spare” money. We call this “breadline poverty”.
Figure 3: Poverty in London and the South East in 1980 and 2000

A Labour MP recently told me that in his not too affluent northern England constituency people had never had it so good. People had possessions their parents never had and although he knows there are more riches “in the south”, his constituents were not that poor.
His equivalent in 1929 could have said much the same thing, and it would have been true then. But had his equivalent said that and been content with his and his constituents’ lot in 1929, the Britain of 1968, let alone 2007 would have been a very different place.
The material living standards of the poorest in 1968 were only as good as they were because of the dissatisfaction of those who received the scraps in the 1920s and 1930s. This dissatisfaction was expressed through votes in that famous general election of 1945.
Without the growth of equality between 1929 and 1968, poverty in 1968 would have been far greater, and we would still have slums today.
Come forward to 2007 and think about poverty and wealth today. There are those who are less concerned with equality, including some in the current government.
Equality
Most of those who in their hearts are truly unconcerned about equality – and hence poverty – sit on opposition benches in parliament. A Tory MP recently told me that his real concern was freedom, not equality. But I find it hard to see the difference between the two.
For instance, the introduction of the NHS made people more equal, and also freed many from the fear of some of the repercussions of ill health. Poverty, wealth, health, education and many other policies are all bound together. The level of poverty that we live with is a measure of the degree of freedom that we live without.
Our report maps how poverty rates declined from 1968 to the mid-late 1970s, but then rose continuously. It shows how this has been accompanied by a rise in the geographical segregation of the poor.
Geographical segregation is when groups live apart from each other. When people are moving further apart from each other, geographical segregation is said to be growing. It is a term usually used to talk about people in different ethnic or religious groups in Britain – but in general people are much more segregated by poverty and wealth than by race or religion.
We also map how many people are “asset rich” – measured primarily through housing wealth – and “exclusively rich” – those who can afford to exclude themselves from normal society. We found the former group growing slightly in number, and the latter being more stable.
The combined effect of these trends was that in 1980 two thirds of households were neither rich nor poor. By 2000 only half of households were in this “normal” category.
The overall geographical and social gaps between rich and poor narrowed over the period when Harold Wilson’s Labour governments of the 1960s were in power.
Although the current government has ruled over a period when that gap has grown, there is also some good news. In the most recent period “core poverty” – the number of households with people who are simultaneously income poor, materially deprived and describe themselves as poor – fell. Such very poor households also became less geographically concentrated.
Gap
Minimum wage and tax credits policy reduced that gap, just as government indifference, complacency or a simple lack of determination has allowed the other gaps – between very rich, rich, average and poor – to widen.
It was only in the 1980s under Margaret Thatcher’s administration that everything got worse at once. That took some spectacular callousness to achieve.
The government1 in Britain is no longer so callous, but it has not achieved what earlier Labour governments have achieved, or kept inequalities down to the lower levels that the majority of other rich capitalist countries have managed to attain. And there is growing evidence that this failure is damaging the lives of the wealthy as well as those of the poor.
Before scoffing at the idea that we should be concerned about the wealthy, stop to think for just a minute over the implications of growing inequality damaging the life chances, freedoms, and wellbeing of all.
If well paid MPs began to realise that their own lives and those of their children would be improved were inequalities in Britain to be reduced, then I suspect they might be a little more effective in their efforts to narrow various gaps than they are at present.
The most geographically segregated social group are those who are so wealthy that they can afford to exclude themselves from the schools, hospitals, cleaning, childcare, recreation and other norms for most people in society. The rich used to be more spread out but are now corralled into affluent enclaves.
Wealthy
I know it is hard to shed a tear for those who are so affluent. But if you are still thinking for that minute about the problems of riches, how do these rich folk have honest relationships with their husbands, wives, children, parents and friends?
All the while in the background is the issue of money – not upsetting daddy for fear of losing part of the inheritance, wondering why she asked you to sign the prenuptial agreement? I can’t see how these can be especially happy lives even if largely lived in leisure.
Figure 4: Poverty in Britain in 1970, 1990 and 2000
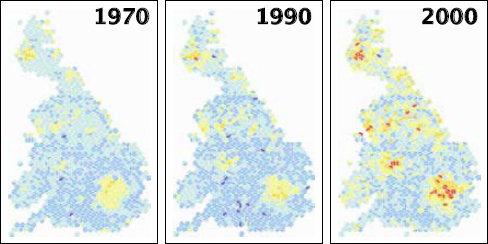
Poverty hotspots across Britain in 1970, 1990 and 2000. The maps show the growing concentration of poor areas.
Note: See Figure 2 above for the key to the shades in these maps
There is, of course, more bad news for the poor. In the most recent period we surveyed, for the first time we saw large parts of many cities with over half the population becoming poor. Here in effect it is now normal to be poor. There are far fewer average households than there once were.
Get out of poverty in the south of England, become average, and there are fewer and fewer places you can afford to live! Meanwhile the affluent watch those above them become rich and feel that they are not rich enough.
Some of the affluent even think they are poor. Society in Britain has become so divided that very few people live anywhere where they can see how a representative range of folk live.
It’s a mess, it’s getting worse, and at the same time we have enough resources for all to live decent lives on this island.
Currently our thinking – like our levels of inequality – is back in the 1930s:“Mustn’t grumble, it could be so much worse.” It could – but it could be so much better than this, for everyone.2
Summary
- Poverty and core poverty levels fell through the 1970s.
- They both then increased, returning by 1990 to similar levels to 1970.
- During the 1980s, while poverty levels were increasing, so were the proportions of asset rich households.
- Exclusively rich households declined during the 1970s and 1980s, but increased during the 1990s.
- The 1990s saw a continuing rise in breadline poverty levels, but a concurrent decline in core poverty.
- During the early 1990s, the percentage of asset rich households fell, but then recovered in the second half of the decade.