14
UK medical school admissions by ethnicity, socioeconomic status, and sex1
Ethnic minorities and women are no longer underrepresented in UK medical schools, but lower socioeconomic groups still are.2 Given the strong political pressure on higher education institutions to develop “widening participation” programmes3, 4, a valid quantitative index of the impact of such programmes is needed urgently. Such an index should be derived from robust and accessible primary data, reflect the impact of multiple independent variables in different population subgroups, allow comparisons across institutions and over time, and be readily understandable by non-statisticians. Statistics on the entry profile of UK medical schools are usually expressed as the selection ratio (the proportion of admissions to applications). 5 We propose that the standardised admission ratio (see box), which expresses the number of pupils admitted to medical school as a proportion of the number who would do so if places were allocated equitably across all socioeconomic and ethnic groups and equally by sex, should become the standard measure of widening participation. It would not, of course, be an index of discrimination at selection stage.
See extra table at end of this chapter for the detailed results of applying this formula to 82 population subgroups in the UK.
Definition of the standardised admission ratio for applicants to medical school
Number of admissions from a particular population subgroup as a proportion of all admissions
Proportion of the general population that belongs to that subgroup
Methods and results
We calculated standardised admission ratios using data from the Universities’ Central Admissions Service database (www.ucas.ac.uk/figures) on UK medical school admissions from 1996 to 2000 (the last year for which full figures are so far available, and the last year in which socioeconomic status was measured in traditional social class bands) as a numerator and the labour force survey (www.statistics.gov.uk) as a denominator (see Figure 1 above). Using the values for 2000, we found that standardised admission ratios varied around 10-fold by ethnicity – from 6.07 in Asians (over-represented) to 0.73 in white people (under-represented) – and around 30-fold by social class – from 6.76 in social class I to 0.20 in class V (see table appended to the end of this chapter). But when we calculated the ratios by ethnicity and social class they varied 600-fold from the most over-represented group with a significant denominator (Asians from social class I, 41.73) to the most under-represented group with fewest admissions (black people from social class IV, 0.07; note that no black people from social class V were admitted to medical school from 1996 to 2000).
Figure 1: Standardised admission ratios by social class and ethnicity for UK medical school admissions 1996–2000 (log scale)
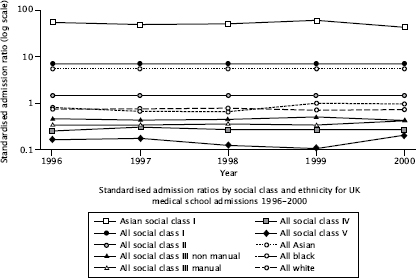
White and black pupils from social class I were around 100 times more likely to gain a place at medical school than those from classes IV or V. Asian pupils seemed to compensate better for poor origins, but those from social class I were still 6-10 times more likely to gain a place than those from classes IV or V. The standardised admission ratio for women increased from 1.08 in 1996 to 1.15 in 2000, and that for men fell correspondingly. Sex specific standardised admission ratios did not vary significantly by socioeconomic status, but they did vary by ethnicity, with Asians having similar ratios for men and women but black and white men being significantly under-represented compared with women.
Comment
We found massive inequalities in medical school admissions by social class. Although the confidence intervals around individual values are likely to be high, especially in subgroups with small denominators, the overall picture is valid. It should not be assumed that the ideal situation is for the standardised admission ratio for all population subgroups to be 1.0, since this would imply that all contain equal proportions of pupils who are suitable for a medical career – an implausible hypothesis.6 The standardised admission ratio is a composite index – being derived from both the proportion of people who apply to medical school in any subgroup and the proportion of applicants who get accepted – and hence should be interpreted with caution.
With these caveats, we believe the standardised admission ratio will be a useful “bottom line” index for quantifying the inequalities in medical school entry (and entry to any higher education course) between subgroups as widening participation initiatives are implemented and evaluated. In a companion paper, the reasons for the wide differences in admission by social class are explored.7
Acknowledgements
We thank Janet Grant for advice on medical admissions datasets, George Davey Smith for advice on the measurement of social class, and three referees for helpful comments on earlier drafts of this paper.
Funding: None. This project was part of a BSc dissertation by Kieran Seyan.
Extra table
The standardised admission ratio for measuring widening participation in medical schools: analysis of UK medical school admissions by ethnicity, socioeconomic status, and sex.
Standardised admission ratios for UK medical schools 2000
