17
Little progress towards a fairer education system1
HEFCE’s ‘Young participation in higher education’ report was published this week and, as Sir Howard Newby makes clear in his forward, it is the first to have results accurate enough to chart the changing participation chances of those from different backgrounds. The results might come as something of a shock for those who have assumed that university intakes have been widening socially in the recent years.
Instead the worst inequalities are found to be deep and persistent. On the way to reaching this conclusion interesting results crop up that are quite unexpected. Remember the surge in participation in 1997 to avoid the introduction of tuition fees? (it never was). Think that the participation of the poor fell when maintenance grants were abolished? (it didn’t). Or that the rich have responded to ‘mass higher education’ by securing postgraduate study for the new elite? (not yet). The first use of accurate participation rates makes this report essential reading for anyone interested in the debate on university funding and student fees as, to put it simply, your preconceptions of the facts are likely to be wrong.
In fact the results are so accurate that it is now possible to chart the changing chances of young people going to university given just the month of their birth. For example, a boy born in September is now 15 per cent more likely to go to university than one born in August. That is the magnitude of the effect of being one of the youngest in your school year in England.
Sex inequality has grown to a similar level: in just six years young women have risen from a 6 per cent advantage in 1994 to being 18 per cent more likely than men to participate in higher education (HE) by the year 2000. The bad news for young men doesn’t stop there: tracking them through their time in HE shows that they are two-thirds more likely to drop-out than their female friends. This, together with a simple extrapolation of participation trends, suggests that we might well see 50 per cent more young graduate women than young graduate men from the children who started secondary school last September.
However, for those of you now worried about your summer-born boys, or who are reassured over the chances of your autumn-born girls – all this is irrelevant in the light of what this report really shows matters for children’s chances. What matters is where our children grow up, as the chances of going to university between areas doesn’t vary by percentage points, but by 5 or 10 fold between substantial groups of young people divided by where they live.
There are widening differences between the regions. Young people in London are now nearly 60 per cent more likely to go to university when compared to those living in the North East – at a stroke inequalities greater than the combined effects of sex and birth month. But to concentrate on these differences is an over-simplification and hides the real geographical divides that exist throughout the country.
For example, looking at parliamentary constituencies shows that in some areas going to university is a matter of course for young people, with more than two thirds doing so. And these areas are not always where you might think. The four highest participating constituencies in Britain have two representatives in the north – Hallam in Sheffield and Eastwood in Scotland – with the other two, more predictably, being Kensington and Chelsea, and Westminster. Any child growing up in these four parliamentary constituencies is at least six times more likely to get to university than are the children represented by the members of parliament for Sheffield Brightside, Nottingham North, Leeds Central or Bristol South. In these areas going to university makes you the odd one out, only one in ten, or less, currently go.
Neighbourhood inequalities in access to higher education
Zoom into the maps of participation further and the inequality progressively deepens. The 30,000 or so young people living in the most advantaged wards are more than ten times as likely to go to university than the matching 30,000 in the least advantaged wards. Feel it is unfair that the older girls in your summer-born son’s class are now over 30 per cent more likely to go to university than he is? Spare a thought then for what the children living in some areas, through a (similar but now geographical) accident of birth, might make of their more advantaged peers being around 1000% more likely to have the opportunity to enjoy the benefits of higher education.
Over the cohorts considered by this report (those reaching 18 between 1994 and 2000) these huge geographical inequalities have hardly altered. A number of groupings are used to track these inequalities and they all give the same message: little has changed. There is, of course, interesting detail. Generally, the most disadvantaged areas have shown the highest growth rates when measured proportionally, which has reduced the relative participation inequality slightly. But this growth is from such a low base that, in absolute percentage point terms, it is very much smaller than that of most advantaged groups. This means that the majority of ‘extra’ young HE places have gone to children from already advantaged areas and so the participation gap between the groups has increased.2
A surprise to some will be that the participation for the poorest areas has steadily increased over the period: no obvious ‘deterrent’ effect from tuition fees or the abolition of grants can be seen. Young people, in contrast to what many commentators on higher education assumed they would do, have apparently acted as if they have ignored the fee and grant changes. This finding occurs several times in the report.3 The small perturbations seen in overall participation rates seem to be explained by year-on-year population changes and GCSE improvements. Even when some young people had a choice to avoid fees, by bringing forward their plans or changing where they study, they seem not to have taken it.
What has made these area inequalities in young participation so deep and persistent? Finding the true causes for ‘why’ is notoriously difficult, and the report steers clear of claiming this, but some clues are to be found in its description of what high and low participation areas are like. This shows that these areas differ not just in participation rates but in almost every respect, to the extent that different parts of Britain are now so educationally distinct that they could be different countries.
Through both statistics and visiting these areas it is clear that low participation areas are disadvantaged in many ways. Indeed these areas face so many disadvantages that it is hard not to feel that access to higher education is unlikely to be the most pressing concern of people living there. One relationship that is particularly striking for small areas is the association between the level of young participation and the proportion of adults holding a higher education qualification. The near five-fold difference in the proportion of graduate adults between the highest and lowest participating 20 per cent of areas very closely mirrors the difference in young participation.
Clearly, geographical inequalities in access to higher education reflect wider geographical inequalities in society, in schools, in young people’s home environments in the aspirations and expectations of themselves and their parents. These represent embedded disadvantage that will take a generation of measures like Sure Start, and much more besides, to reduce substantially. Interventions at the HE application stage, such as taking into consideration the circumstances under which A-levels were gained, are welcome and might help to even-up the institutional distribution of those entering HE slightly. But they are not going to have any material impact on the deep participation inequalities between neighbourhoods shown so clearly in the report.
Inequality is most evident in the detailed maps of participation, released as a supplement to the report on HEFCE’s website. These show that there is a line which snakes its way around the country separating groups of young people into those with good chances and those with poor chances of participation (and much more besides). This line runs through the core of our cities with many cities split internally by social cliffs separating young people living within a few hundred yards of each other but in educationally opposed worlds. If you have ever wondered where the wrong and right side of the tracks lay in Britain, HEFCE have now mapped them in detail (www.hefce.ac.uk/polar, see Figure 1 for the national map).
In looking at the experiences of entrants from different backgrounds the report delivers a final statistical surprise. It finds that if you make it into higher education and stay the course to get a degree, then whether you are from advantaged or disadvantaged backgrounds you have pretty much the same chance of going on to postgraduate study. Indeed, young qualifiers who originally came from low participation areas are, thanks mainly to postgraduate teaching qualifications, slightly more likely to carry on to postgraduate study. Of course, this encouraging finding needs to be tempered by the fact that so few young people from disadvantaged areas get a degree that, in terms of numbers, those from advantaged areas utterly dominate the postgraduate population as they do the undergraduate population.
Social inequalities in access to study for all and postgraduate study
The postgraduate finding is particularly interesting since all the preceding educational stages have a common theme of low achievement by those from disadvantaged backgrounds leading to a high level of attrition on the progression to the next educational level. In contrast, at this rarefied transition we have an unexpected jewel of apparently equal progression. We do not know what it is about the mix of support we currently provide for young postgraduate students that has allowed this relative equality – largely unmeasured and untended – to flourish. Finding out might help us preserve it, saving the next generation from having access to postgraduate study as its widening participation battleground.
Figure 1: Young participation by Learning and Skill Council areas: England only*
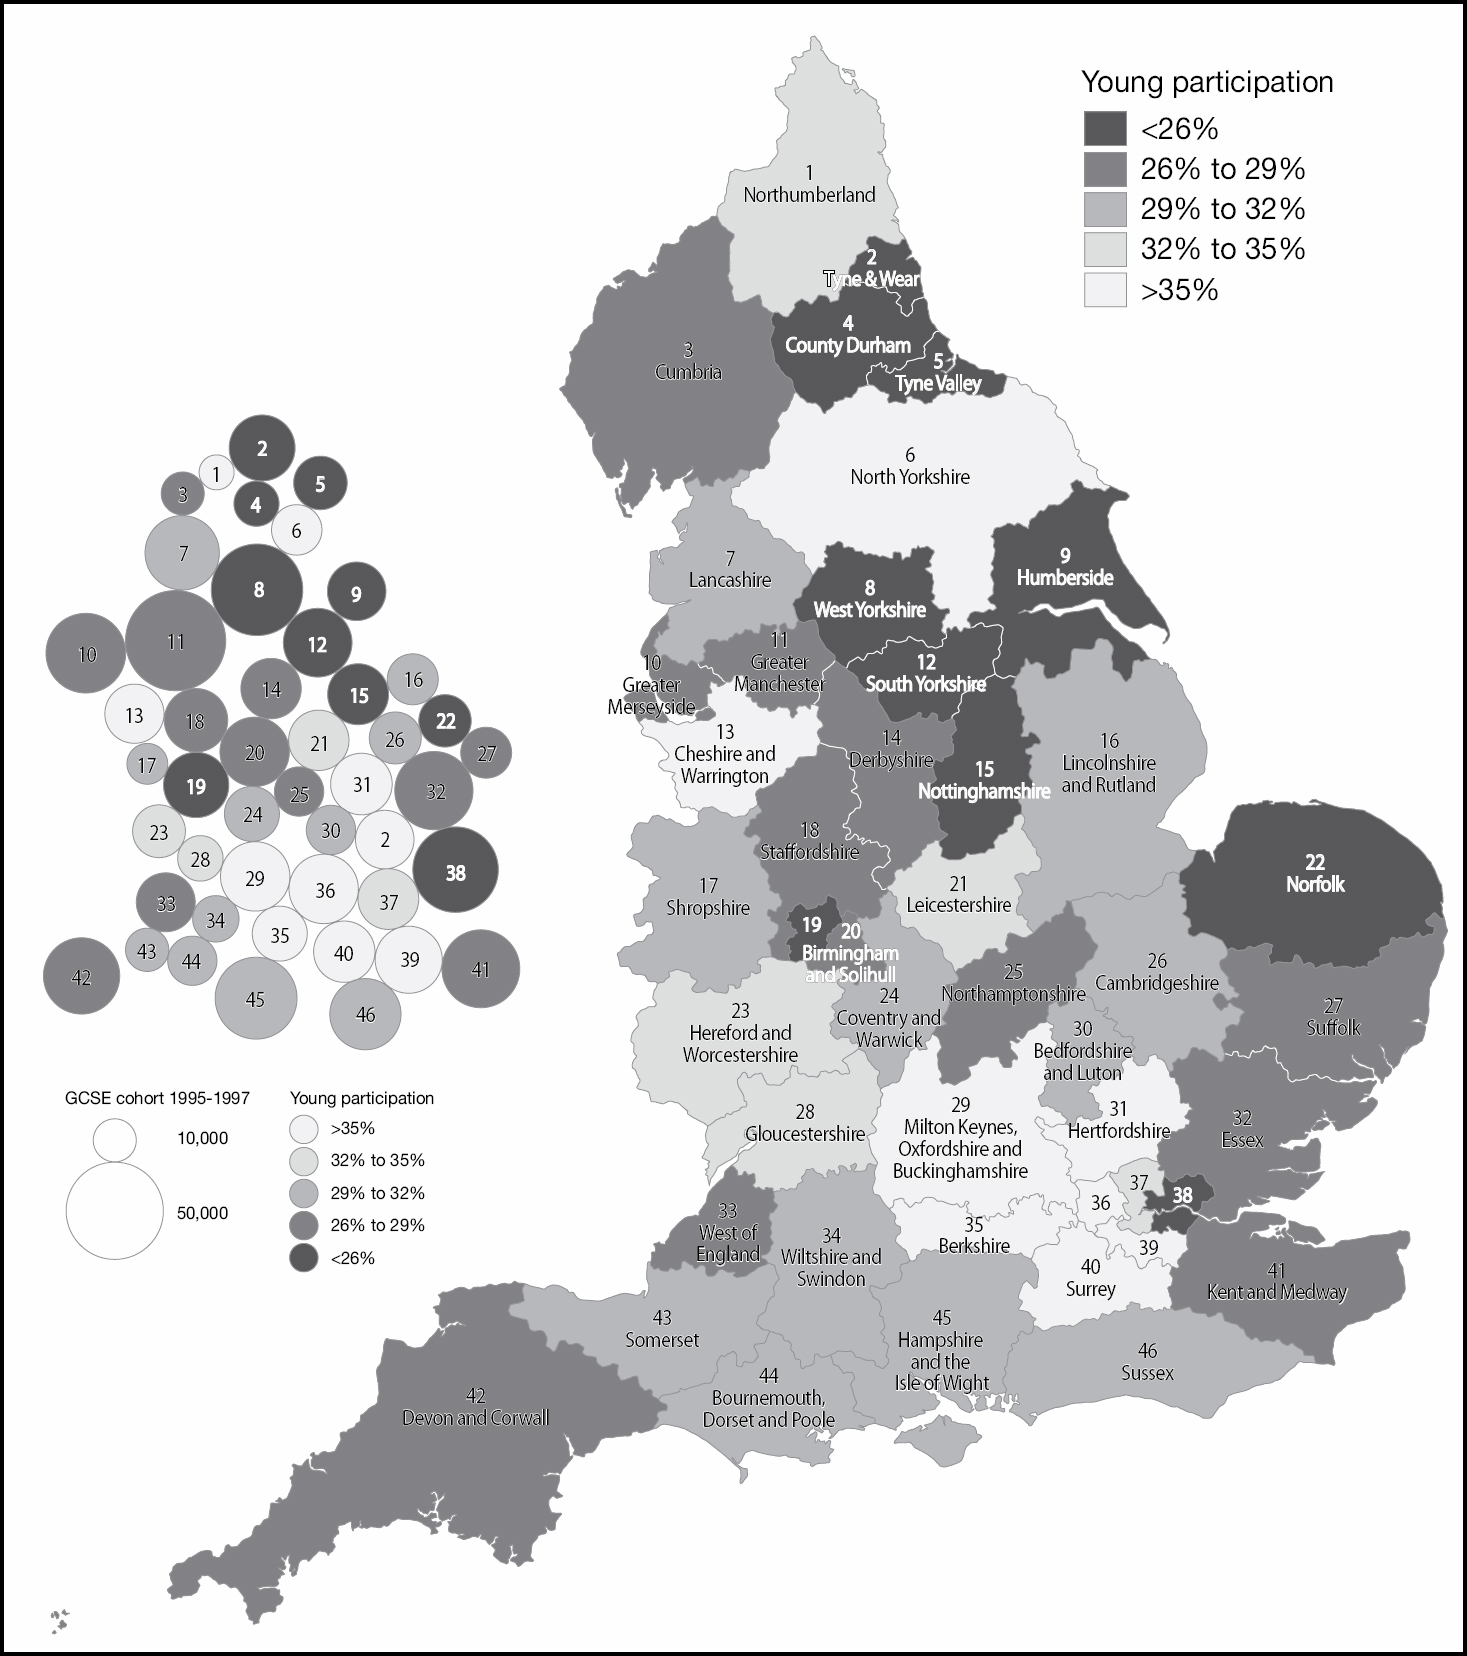
* The rates shown are of young people gaining access to university. This map and inset cartogram was not included in the original article but it does highlight what is seen on the polar website, which also included many far more detailed maps and their more useful population cartogram counterparts. See: www.hefce.ac.uk/widen/polar/nat/map/lsc_GB.pdf
The history of debates on educational participation in Britain – on the introduction of elementary education, on secondary education, on comprehensive schooling – shows a common path. In response to the first concerns raised, an argument is put forward that not all young people need to have access to the same educational opportunities as others. Then this argument is always eventually lost, and participation widens in the long term. The argument then moves on from participation to inequality in provision, such as the disparity in school GCSE results.
If young participation in higher education were to follow this pattern, then it is clear that we have barely started on this path: it is difficult to find social statistics more polarised than our measures of young participation.
The government’s aspiration of 50 per cent participation refers to a wider age group than the 18 and 19 year olds covered by this report, but reaching it would translate to at the very most an extra 7 percentage points or so on our measures. Suppose each group of young people enjoyed this same percentage point rise in participation: this is optimistic since the report finds that young people living in the most advantaged areas get more than their fair share of extra participation. Currently the most advantaged 20 per cent of young people have around 4.7 times the participation of the least disadvantaged, even this near-impossibly of optimistically equally distributed growth would, on average, reduce this advantage to 3.3 times.4
Is that enough? If not then we have some difficult choices. We could propose changing our HE admission system to deny places to well qualified applicants from advantaged backgrounds to reduce inequalities. This would be unpalatable, especially to the influential people who live in high participation areas and, besides, it is not the fault of these children that they were born into advantaged families and so penalising them for that may well appear unfair. This leaves the alternative of providing enough extra young HE places to accommodate both the expectations of the advantaged and our hopes for the disadvantaged.
Over half the young people living in the most advantaged 20 per cent of areas go to university and, by and large, they seem to benefit from the experience and go on to graduate jobs afterwards. So, unless you believe that children born in some areas are somehow inherently less able to benefit from higher education than others, then there seems to be no reason why all children should not enjoy this level of opportunity, regardless of where they live.
To raise all English young people to the current participation level of autumn-born young women in the most advantaged areas would need a doubling of the number of young people going to university.
You can blame the parents, the schools, the social environment for the divides we see in young participation; but unless there are significant increases in higher education places in future these divides simply cannot materially diminish. To raise the participation rate of all English young people to that of the current participation level of autumn-born young women in the most
advantaged 20 per cent of areas would need a doubling of the number of young people going to university. There will come a time when very many extra university places will be needed in the course of a fairer education system in this country, but as yet we are far from that point.5