4
Fuel Cells
““Yes, but water decomposed into its primitive elements,”” replied Cyrus Harding, ““and decomposed doubtless, by electricity, which will then have become a powerful and manageable force, for all great discoveries, by some inexplicable laws, appear to agree and become complete at the same time. Yes, my friends, I believe that water will one day be employed as fuel, that hydrogen and oxygen which constitute it, used singly or together, will furnish an inexhaustible source of heat and light, of an intensity of which coal is not capable … I believe, then, that when the deposits of coal are exhausted we shall heat and warm ourselves with water. Water will be the coal of the future.””
“I would like to see that,” observed the sailor.
“You were born too soon, Pencroft,” returned Neb.
From the The Mysterious Island, Jules Verne, 1874.
In this chapter, the reader is introduced to electrochemical fuel cells. The fuel cell is explained by building on the understanding of electrochemical storage developed in Chapter 3. The focus of this chapter is on the polymer electrolyte membrane fuel cell, which is the technology of choice for automotive applications. The relative efficiency and energy density of the fuel cell compared to the IC engine make the fuel cell a competitive technology for mobile applications. Topics such as fuel cell sizing and the sourcing of the hydrogen fuel are also considered.
4.1 Introduction to Fuel Cells
A fuel cell is an electrochemical device which converts the chemical energy of a fuel, for example, hydrogen, and an oxidant, for example, air, to electrical energy and heat. Similar to the electrochemical battery, the electrical energy is output in the form of dc power. Unlike a battery, the fuel and the oxidant are stored outside of the cell and transferred into the cell as the reactants are consumed. The fuel cell converts energy rather than storing it and can continuously provide power as long as fuel is provided.
Fuel cells have been around for a long time. The first recorded development of a fuel cell was in England by William Grove in 1838. However, the first commercial development of a fuel cell was in the 1950s for the National Aeronautics and Space Administration (NASA) in the United States. Fuel cells are now regularly used for primary power production on space craft. For example, fuel cells power the International Space Station. Given that hydrogen gas is the rocket fuel for spacecraft, it makes sense to also use that fuel for on‐board power generation. The proton exchange membrane or polymer electrolyte membrane (PEM) fuel cell of interest for today’s vehicles was originally invented at General Electric (GE) in the United States by Willard Thomas Grubb and Leonard Niedrach in the 1950s. There are a number of different types of fuel cells. For example, solid‐oxide fuel cells have been productized for stationary power backup applications, while alkaline fuel cells have been commonly used for space craft. All of these fuel cells can consume hydrogen fuel.
The PEM fuel cell is the technology of choice for automotive applications due to its low operating temperature range (less than 100 °C), small size, high efficiency, and wide operating range. Challenges for the fuel cell have been the costs of platinum for the electrodes, lifetime, sensitivity to impurities, and the significant accessory system, known as balance of plant, required to manage the fuel cell. The voltage of the PEM fuel cell is quite low, in the range of 0.5 to 1 V over the load range. Thus, automotive fuel cells are typically arranged in stacks with hundreds of cells in series. Stacks can be paralleled in order to increase power capability.
There have been many approaches over the decades at developing fuel cell vehicles for the automotive industry. Several car companies experimented with fuel cell vehicles in the 1960s and 1970s before a resurgence in the twenty‐first century. In an environmentally‐ sensitive age, the fuel cell vehicle is attractive as its only emission at the point of use is water vapor. Fuel cell vehicles are particularly attractive as they combine the energy density of a fossil fuel with the powertrain efficiency of an electric vehicle. However, the development of fuel cells has been relatively slow due the hurdles of cost, size, manufacturability, and lifetime. In recent years, these challenges are being addressed, and new vehicles are coming onto the market. Thus, the Hyundai Tucson was introduced in 2014, the Toyota Mirai in 2015, and the Honda Clarity in 2017. New and improved vehicles are forthcoming from many different manufacturers.
The fuel cell is of particular interest for heavy‐duty vehicles because of the high energy density of hydrogen and the fast rate of refueling. These two factors are major challenges for battery‐electric vehicles. The primary competitors for long‐range heavy‐duty fuel cell vehicles are diesel and compressed natural gas (CNG) vehicles. However, these fossil‐fuel‐burning vehicles can generate significant particulate matter, hydrocarbons, and NOx at the point of use, emissions which are experiencing greater curtailment, especially within urban environments. In addition, the diesel‐fueled vehicle is relatively heavy in weight and requires significant maintenance. The fuel cell can achieve the required energy and power densities without the use of on‐board fossil fuels. A fuel cell can be viewed as being a “combustion‐less engine” as it produces electrical energy through the electrochemical reaction of hydrogen and oxygen.
4.1.1 Fuel Cell Vehicle Emissions and Upstream Emissions
Presently, hydrogen is generated in large quantities by the petroleum industry via the reformation of hydrocarbon gas. The reforming process is as follows: CNG (mostly methane CH4) reacts with steam at very high temperatures to produce hydrogen and carbon monoxide (CO). The chemical reaction is

The carbon monoxide is captured during the production and can be used for multiple other processes such as the carbonization of soft drinks.
Natural gas has become the fuel of choice in many countries for electricity generation due to its lower carbon content compared to oil or coal. Abundant resources of shale gas have expanded the role of gas in electricity generation, especially in the United States. Significant concerns exist regarding fracking and methane leakage.
Per the GREET model [1], the efficiency of producing and converting natural gas to hydrogen by steam reformation, transporting the compressed fuel, and finally fueling the vehicle is about 60%.
The powertrain energy efficiency of the fuel cell electric vehicle (FCEV) is about 45%, as per the discussion in Chapter 1, Section 1.7, and the overall well‐to‐wheel efficiency of about 27% is comparable to electric vehicles which are powered from a conventional grid.
The well‐to‐wheel emissions for the FCEV can also be improved by reforming the hydrogen from fermented biomass or by producing hydrogen using electrolysis, either at nuclear plants, where steam heat is also available, or by renewable sources.
While the efficiency of charging a battery electric vehicle (BEV) from renewables is higher than for the FCEV, the density of energy storage makes the FCEV an extremely attractive option for heavy‐duty vehicles, such as large buses and trucks, which have to travel long distances and move heavy cargoes. The refueling infrastructure is more easily established for these types of vehicles as they often operate from centralized locations. The existing options are based on diesel and CNG – both of which result in significant pollutants at the point of use.
4.1.2 Hydrogen Safety Factors
Since the crash of the flaming fireball that was the LZ 129 Hindenburg airship on May 6, 1937, in a New Jersey field, perceived safety in particular has been a factor for hydrogen in the public eye. Even now, after all these years, there have been many theories as to the causes of the fire but no confirmed hypothesis or indication that the use of hydrogen for buoyancy was a significant contributing factor. Hydrogen has been widely used for a long time, and, as mentioned, is the fuel commonly used for spacecraft.
There are many factors which must be considered in assessing the safety of hydrogen compared to the competitive fuels. A number of these factors are presented in Table 4.1 for hydrogen, natural gas, and gasoline. Hydrogen and natural gas are colorless, odorless gases, whereas gasoline is a liquid. Natural gas and gasoline can both be toxic.
Table 4.1 Various safety factors for different fuels.
| Hydrogen | Natural gas | Gasoline | |
| Physical state at 25°C and 1 atm | Gas | Gas | Liquid |
| Color | None | None | Clear to amber |
| Odor | None | None | Yes |
| Toxicity | None | Some | High |
| Buoyancy relative to air | 14.4× lighter | 1.6× lighter | 3.7× heavier |
| Diffusion coefficient in air (cm2/s) | 0.61 | 0.16 | 0.05 |
| Detection | Yes | Yes | Limited |
| NPFA 704 Diamond 0 = none, 4 = Severe Red (top): Flammability Blue (left): Health Yellow (right): Reactivity White (bottom): Special hazard |
 |
 |
 |
Hydrogen is significantly lighter than natural gas or gasoline vapor, and so the hydrogen gas tends to rise and disperse rapidly when it leaks in open space, as measured by the diffusion coefficient. Leakages of hydrogen and CNG are both easily detected.
The National Fire Protection Association (NFPA) in the United States provides a simple easily recognized standard for labeling hazardous materials. The applicable standard is NFPA 704, and the required labeling identifies on a scale of 0 (minimal hazard) to 4 (most severe) the safety hazards posed by the material for health (blue on left), flammability (red on top), reactivity (yellow on right), and special hazards (white on bottom). As noted in Table 4.1, both CNG and hydrogen are highly flammable, while hydrogen poses less of a hazard to health than CNG or gasoline.
4.2 Basic Operation
An oxidation‐reduction reaction, commonly termed a redox reaction, is the basis of operation of an electrochemical fuel cell, and also of the electrochemical battery cell. As with the battery, a simple electrochemical fuel cell comprises two electrodes and an electrolyte, as shown in Figure 4.1.
Figure 4.1 Electrochemical fuel cell.
The fuel cell is composed of two half‐cells. One half‐cell is the site of the oxidation reaction, and the other half‐cell is the site of the reduction reaction.
The anode is the solid metal connection or electrode within the fuel cell at which oxidation occurs. The anode is at the negative terminal of the fuel cell.
The cathode is the solid metal connection or electrode within the fuel cell at which reduction occurs. The cathode is the positive electrode of the fuel cell.
An electrolyte is a substance which contains ions and allows the flow of ionic charge. The fuel cell features a polymer electrolyte. PEM is the commonly used name for this type of fuel cell, and refers to the proton exchange membrane or polymer electrolyte membrane which is designed to conduct the positive charges and insulate the electrodes. Platinum is typically included as a catalyst for both the anode and the cathode in order to split the hydrogen molecules into ions and electrons at the anode and to facilitate combination of the hydrogen and oxygen at the cathode.
The hydrogen and oxygen are absorbed into the gas diffusion layer (GDL), which acts as an electrode and allows the reactants to diffuse along the membrane, and also helps remove the water.
The full assembly of the electrodes and membrane is known as the membrane electrode assembly (MEA).
The half‐cell and cell reactions for the PEM fuel cell are shown in Table 4.2. During discharging of the cell, the hydrogen fuel is converted to hydrogen ions and electrons at the anode. The electrons flow externally to power the load, and the hydrogen ions flow through the electrolyte to the cathode. The oxygen molecules, hydrogen ions, and electrons combine at the cathode to generate water molecules. A nominal half‐cell voltage of 1 V is generated at the cathode. The half‐cell voltage at the anode is 0 V. Thus, the overall cell voltage is 1 V.
Table 4.2 Cell parameters for a PEM fuel cell.
| Chemistry | Electrode | Reaction | Equation | Voltage (V) |
| PEM discharge |
Cathode | Reduction |  |
1 |
| Anode | Oxidation |  |
0 | |
| Cell |  |
1 |
Note that the voltages presented for the anode or cathode are with respect to a standard hydrogen electrode, the commonly used basis for determining the voltage from a half‐cell.
The fuel cell must feature a water and thermal management system as water and heat are outputs from the fuel cell, in addition to electricity and unused fuel. Excessive heat and high temperatures can result in failure of the fuel cell. One of the advantages of the PEM fuel cell is its relatively low temperature operation. Water management is also critical as too much or too little water in the membrane can either flood or dry out the membrane, reducing the power output.
4.2.1 Fuel Cell Model and Cell Voltage
The electrochemical model of the fuel cell is similar to the earlier battery model, and so a related cell voltage model is now developed. As with the battery, the focus here is on a simplified static model rather than on a dynamic model featuring capacitive effects.
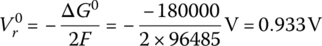
The open‐circuit reversible voltage of an electrochemical cell Vr0 is the no‐load open‐circuit voltage of the cell, and is related to the change in the Gibbs free energy ΔG0 by the equation:
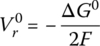
where the number 2 represents the number of moles of electrons transferred according to the balanced equation for the redox reaction, and F is Faraday’s constant (96,485 J/V‐mol).
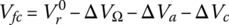
Similar to the battery, the voltage of the fuel cell Vfc can be modified to include the effects of the reaction quotient as described by the Nernst equation:
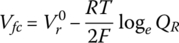
where R is the ideal gas constant, T is the temperature, and QR is the reaction quotient. Again, the Nernst equation strictly only applies when there is no current in the cell. The cell terminal voltage is dependent on the cell current. This relationship is governed by a number of voltage drops within the cell. There are three main voltage drops: ohmic, activation polarization, and concentration polarization.
Ohmic drop is the internal battery resistance composed of ohmic drops due to the terminations and current collectors.
The ohmic voltage drop ΔVΩ can be simply modeled by

where RΩ is the fuel‐cell‐specific resistance in Ωm2, and ifc is the fuel cell current density in A/m2.
Activation polarization is the internal resistance due to charge‐transfer reactions faced by the electrons at the electrode–electrolyte junctions. This effect is dominant from low‐power to full‐power operation of the fuel cell.
The activation voltage drop ΔVa is governed by the equation
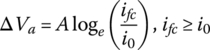
where i0 is known as the fuel cell exchange current density, and A is the activation loss coefficient. This equation is often known as the Tafel equation, named for the Swiss chemist Julian Tafel (1862–1918).
Concentration polarization is the internal resistance faced by the ions due to the electrolyte concentration. This effect is dominant at high currents beyond the maximum power condition.
The concentration voltage drop ΔVc is governed by

where m and n are the concentration loss coefficient and exponent, respectively.
Thus, the fuel cell voltage of Equation (4.3) can be modified to include the various voltage drops:
4.2.1.1 Example: No‐Load and Load Voltages of a PEM Fuel Cell
The parameters of a fuel cell are provided in Table 4.3. For simplicity, the effects of temperature and pressure are ignored.
Table 4.3 Fuel cell parameters.
| Description | Parameter | Value | Units |
| Change in Gibbs free energy | ΔG0 | −180 × 103 | J/mole |
| Faraday’s constant | F | 96485 | J/V‐mol |
| Fuel cell area specific resistance | RΩ | 1.5 × 10⁻⁵ | Ωm2 |
| Activation loss coefficient | A | 5 × 10⁻³ | V |
| Exchange current density | i 0 | 20 | A/m2 |
| Concentration loss coefficient | m | 3 × 10⁻⁵ | V |
| Concentration loss exponent | n | 0.5 × 10⁻³ | m2/A |
| Cell thickness | tfc | 1.34 | mm |
Determine (i) the no‐load voltage and (ii) the full‐load voltage at 15,000 A/m2.
Solution:
- The no‐load reversible voltage is
- The voltage drops under load are as follows:
- The ohmic voltage drop ΔVΩ is
(4.8)

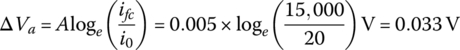
- The activation voltage drop ΔVa is
(4.9)
- The concentration voltage drop ΔVc is
(4.10)

- The fuel cell voltage under full load is

- The ohmic voltage drop ΔVΩ is
4.2.2 Power and Efficiency of Fuel Cell and Fuel Cell Power Plant System
The specific power density of the fuel cell Psfc, with units of W/m2, is given by

The efficiency of the elementary fuel cell ηfc is nominally the ratio of the output voltage to the no‐load reversible voltage:
However, a significant portion of the output power of the fuel cell is required to power the balance of plant (which is discussed in the next section), and it is more useful to consider the efficiency of the overall fuel cell system or power plant.
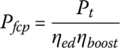
Let ηbop be the efficiency of the balance of plant. Thus, the fuel cell power plant efficiency ηfcp is given by
4.2.2.1 Example: Full‐Load Power and Efficiency of PEM Fuel Cell Stack
Determine the power density and the efficiencies of the fuel cell and plant at full load if the balance of plant consumes 20% of the fuel cell output power (ηbop equals 80%).
Solution:
The power density of the fuel cell is

The efficiency of the fuel cell is
The fuel cell power plant efficiency is

4.2.3 Fuel Cell Characteristic Curves
The plot of the fuel cell voltage as a function of the specific current is known as the polarization curve of the fuel cell, and is shown in Figure 4.2, for the parameters of Table 4.3. The fuel‐cell‐specific power is also plotted. The specific power peaks at about 15,000 A/m2 before dropping significantly. The no‐load and short‐circuit operating points are also noted in the diagram.
Figure 4.2 Fuel cell polarization curve and power curve.
Plots of the fuel cell and fuel cell plant efficiencies are presented in Figure 4.3. It is assumed in these curves that 20% of the fuel cell power is required to power the balance of plant. A couple of points should be noted for the practical fuel cell power plant. The fuel cell power plant typically does not operate at very light loads (lower than 5%–10% of rated power) due to the light‐load losses. The plant also does not typically operate beyond the maximum power point as the system power and efficiency both drop significantly.
Figure 4.3 Fuel cell and plant efficiencies.
4.3 Sizing the Fuel Cell Plant
Multiple fuel cells are typically arranged in series as stacks in order to achieve the voltage and power levels required for the automotive powertrain. The fuel cell stack voltage should be as high as possible in order to maximize the overall efficiency of the electric powertrain. Hundreds of individual cells are typically required in series.
The current and power of the fuel cell are proportional to the area of the fuel cell. Thus, the area of the individual fuel cell is sized in order to output the required power.
The stack output voltage from the fuel cell power plant Vfcp is given by

where Nfc is the number of cells in a fuel cell stack.
The fuel cell plant output power Pfcp is determined by multiplying the fuel cell stack output power Pfc by the efficiency of the BOP:

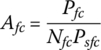
The area of an individual fuel cell Afc is simply the ratio of the maximum output power of the stack Pfc to the product of the number of cells and the maximum specific power Psfc of the fuel cell:
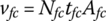
If the thickness of the fuel cell tfc is known, then the volume of the fuel cell stack vfc is given by
The energy input to the fuel cell Ein is
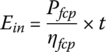
where t is the time.
The fuel mass flow rate of hydrogen  is
is
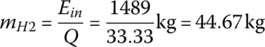
where Q =120 MJ/kg (33.33 kWh) is the specific energy or lower heating value (LHV) of hydrogen.
4.3.1 Example: Sizing a Fuel Cell
A fuel cell power plant outputs 114 kW and has 370 cells in series. The parameters of the fuel cell are provided in Table 4.3. The cell thickness tfc is 1.34 mm.
Determine the area of each fuel cell, the volume of the stack, the mass flow rate of fuel, and the stack voltage at full power for the full‐load condition of 15,000 A/m2. Reference the previous examples.
Solution:
The fuel cell power must factor in the balance of plant per Equation (4.17):
From Equation (4.18), the area of the fuel cell stack is

From Equation (4.19), the volume of the fuel cell stack is

According to Equation (4.21), the mass flow rate of hydrogen is
From Equation (4.16), the stack voltage is

4.3.2 Toyota Mirai
The 2016 Toyota Mirai has 370 fuel cells in a single stack with a cell thickness of 1.34 mm each [2]. The vehicle stores 5 kg of hydrogen in a carbon‐fiber‐reinforced high‐pressure tank which weighs 87.5 kg. The vehicle can be refueled in about 3 min. The fuel cell stack outputs 114 kW maximum. The energy system features a NiMH battery.
4.3.3 Balance of Plant
Power plants in general require significant support components and ancillary equipment in order to output power. These additional components and equipment are known as the balance of plant, as shown in Figure 4.4. There are several functions for the fuel cell balance of plant as follows:
- Fuel processing
- Air processing
- Thermal and water management
- Electrical controls
- Protection
- Dc‐dc converter
- Vehicle level cooling
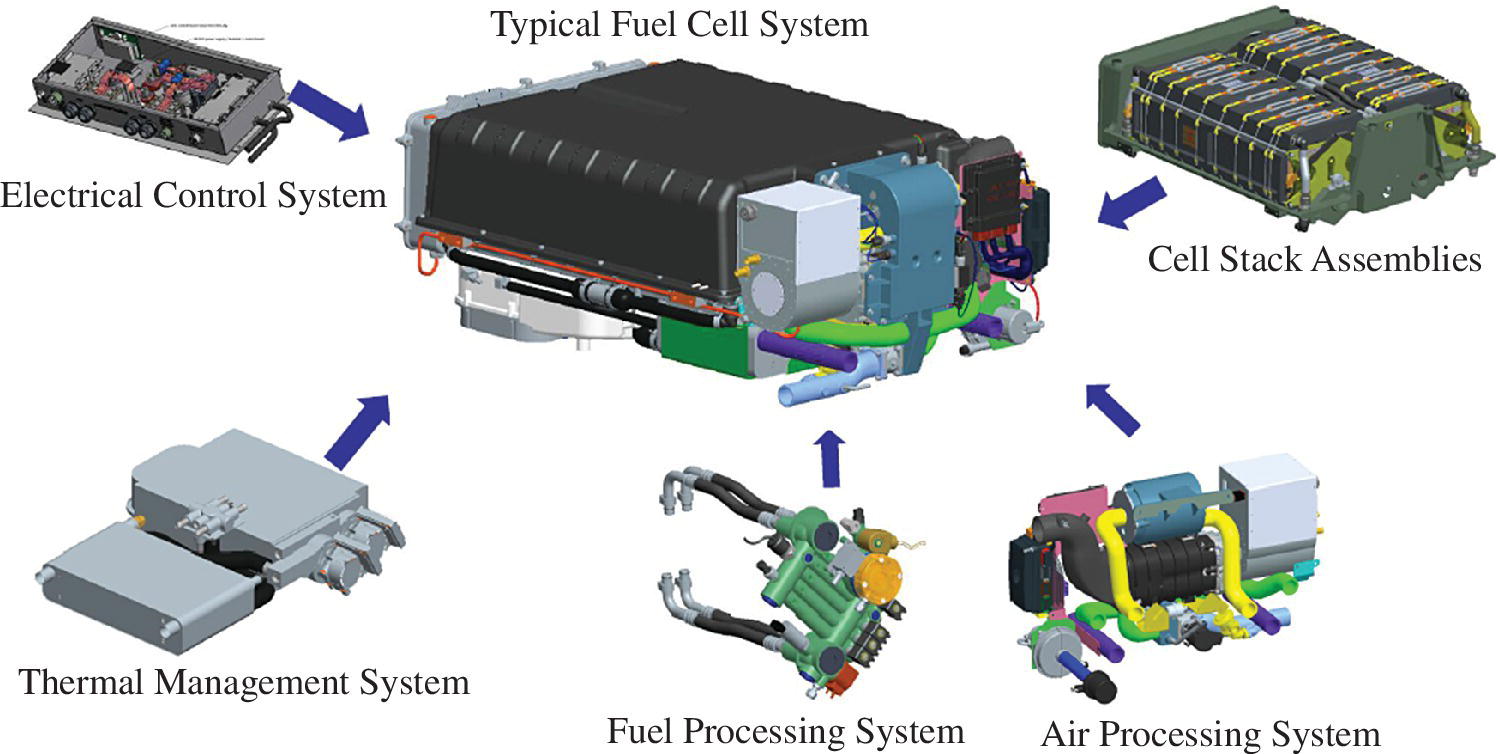
Figure 4.4 Automotive fuel cell and balance of plant.
(Courtesy of US Hybrid.)
As discussed earlier, the energy requirements for the balance of plant can be quite high, typically consuming about 20% of the fuel cell output power for high‐pressure fuel cell systems, and about 10% for low‐pressure fuel cell systems, to power the required fans, pumps, compressors, and so on.
4.3.4 Boost DC‐DC Converter
A boost dc‐dc power converter is required to interface the fuel cell to the high‐voltage dc link. The fuel cell of the Toyota Mirai is interfaced to the electric drive by a four‐phase boost converter with a maximum output voltage of 650 V. Boost converters for this application are discussed in depth in Chapter 11.
4.4 Fuel Cell Aging
Fuel cell performance decays with time as the GDLs and membrane degrade. Lifetime was quite a significant challenge for the earlier generations of fuel cells. The latest generation of fuel cells demonstrate lifetimes and operating hours which meet the exceedingly tough heavy‐duty automotive requirements. While a car may be designed for 5000 hours of operation over its lifetime, heavy‐duty commercial vehicles are designed for 20,000 hours of operation. The powertrain components of heavy‐duty vehicles are typically replaced after 20,000 hours.
Polarization curves are presented in Figure 4.5 for 100 kW fuel cell power plants, which have been manufactured by US Hybrid [3] and field‐tested in a fleet of heavy‐duty commercial buses. The curves are based on data from regular field tests to characterize the fuel cells.
Figure 4.5 Polarization curve for heavy‐duty automotive PEM fuel cell.
(Courtesy of US Hybrid.)
The cell voltage ranges from 0.88 V at light load to 0.7 V at full load at the beginning of life (BOL). After 20,000 hours, or at end of life (EOL), the cell voltages drops to 0.85 V at light load and to 0.57 V at full load.
This heavy‐duty vehicle stack consists of 540 fuel cells in series. The fuel cell power plant output voltage and power are as shown in Figure 4.6.
Figure 4.6 Fuel cell power plant voltage and power versus output current.
(Courtesy of US Hybrid.)
The BOL fuel cell plant voltage ranges from 475 V at minimum load to 370 V at a full load of about 118 kW. The EOL fuel cell plant voltage ranges from 460 V at minimum load to 310 V at a full load of about 95 kW. Note that the slight oscillatory patterns shown on the voltage curves are also characteristic of the battery discharges with state of charge as shown in Chapter 3, Figure 3.8.
The fuel cell power plant output power and efficiency are plotted together in Figure 4.7.
Figure 4.7 Fuel cell power plant efficiency and power versus output current.
(Courtesy of US Hybrid.)
The light‐load and full‐load efficiencies drop from 64% at 10 kW and 49% at a full load of 118 kW, respectively, at BOL, to 54% at 10 kW and 46% at a full load of 95 kW, respectively, at EOL. Thus, the average efficiency is about 59% at light load and about 47.5% at full load over the lifetime of the fuel cell.
4.5 Example: Sizing Fuel Cell System for Heavy Goods Tractor–Trailer Combination
In this example, a fuel cell system is sized for a tractor–trailer carrying goods from a shipping port. The maximum gross weight for the tractor–trailer combination is 36,280 kg (80,000 lbs), and the vehicle operates at an average speed of 64 km/h. The vehicle has the following parameters: gross vehicle weight m = 36,280 kg when fully loaded, or 13,600 kg when unloaded, drag coefficient CD = 0.7, vehicle cross section A = 10 m2, and coefficient of rolling resistance CR = 0.008. The nominal efficiency of the powertrain and transmission ηpt = 85%, and the auxiliary load Paux = 2 kW. Let the density of air ρair = 1.2 kg m−3.
The overall mass of the fuel cell system (including the fuel cell, balance of plant, storage tanks, and mechanical bracketing) is 400 kg plus 80 kg per 5 kg of stored hydrogen.
- Determine the mpge and the overall mass of the fuel cell if the vehicle is to travel at a constant speed of 64 km/h for a full work shift of 8 h, or 512 km. The fuel cell plant efficiency is 48% for this operating condition.
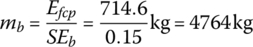
- Determine the mass of battery which would be required if the battery pack specific energy SEb is 0.15 kWh/kg. What are challenges facing the battery for this application?
Solution:
The speed of the vehicle is
The road load power of the fully‐loaded vehicle is
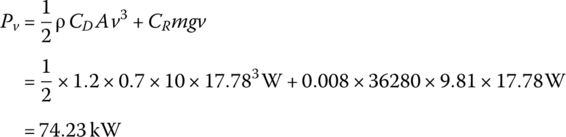
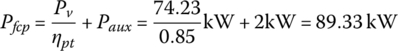
The fuel cell plant output power is the sum of the power to the powertrain plus the auxiliary power Paux:
The overall driving time is 8 h, and so the energy output by the fuel cell plant is

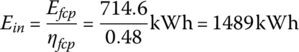
The input energy carried by the hydrogen fuel is
The mass of hydrogen required is
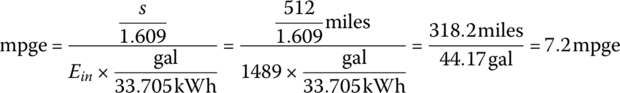
The mpge is
The overall weight of the fuel cell system is

The equivalent battery output energy must equal the fuel cell output energy. Thus, the battery mass mb is
There are significant challenges for the battery to compete with the fuel cell in an application such as this. First, the weight of the battery can be excessive for the tractor axles. Second, the vehicle can be rapidly refueled in minutes using hydrogen, while the time for battery charging is likely to be significant and result in a proportionate drop in operating hours for the vehicle.
4.6 Example: Fuel Economy of Fuel Cell Electric Vehicle
In this example, the performance of a fuel cell vehicle is investigated for the simple drive cycle introduced in Chapter 2, Section 2.3. The following assumptions are made: electric drive efficiency ηed of 85%, boost converter efficiency ηboost of 98%, an equivalent idling load of 1 kW, and an efficiency of steam reforming, transmission, distribution, compression, and fueling for hydrogen ηH2 of 64%. The vehicle architecture is shown in Figure 4.8.
Figure 4.8 Fuel cell vehicle architecture.
It is noted that the fuel cell should be run at a minimum load to charge the battery or power vehicle auxiliaries and then shut down. For simplicity, in this problem it is assumed that the equivalent load on the fuel cell is 1 kW for time period t3.
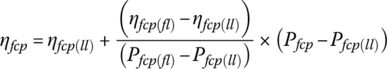
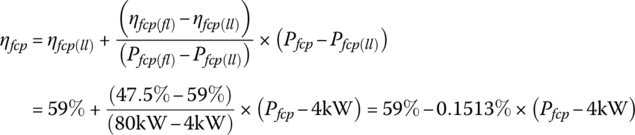
Let the light‐load power plant efficiency ηfcp(ll) be 59% at the light‐load power Pfcp(ll) of 4 kW, and the full‐load power plant efficiency ηfcp(fl) be 47.5% at the full‐load power Pfcp(fl) of 80 kW output. The efficiency varies approximately linearly with output power over the range between light and full load, and can be represented by
Solution:
The power required from the fuel cell power plant Pfcp is the motor output power divided by the electric drive efficiency ηed and the boost converter efficiency ηboost:
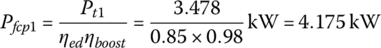
The traction powers are Pt1 = 3.478 kW and Pt2= 12.050 kW from Chapter 2, Section 2.3. The fuel cell plant powers, Pfcp1, Pfcp2, and Pfcp3 are
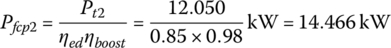
and

The energy consumed from the fuel cell plant is simply the product of power and time:

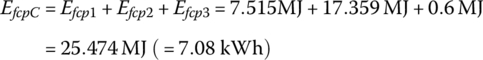
The fuel cell output energies Efcp1, Efcp2, and Efcp3 are


The plant output energy over the drive cycle EfcpC is
The energy supplied in the hydrogen Ein is

The plant efficiency is given by
It is assumed that vehicle powers below the light load level can ultimately be supplied by the plant at the light‐load efficiency level. The various efficiencies are then calculated as


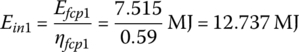
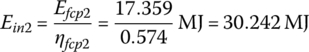
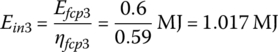
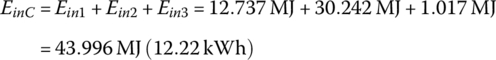
The input energies, Ein1, Ein2, and Ein3 are
The input energy EinC over the cycle is
The mass of hydrogen used per interval and over the cycle, m1, m2, m3, and mC, are


The powertrain conversion efficiency ηpt from the fuel tank to the traction machine output is
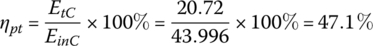
where EtC = 20.72 MJ was determined in Chapter 2, Section 2.3.
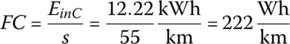
The fuel consumption of the vehicle and the related fuel economy are based on the input energy from the fuel.
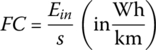
and so the fuel consumption for this cycle is
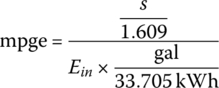
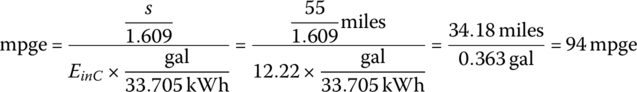
The equivalent mpg (mpge) for FCEVs is based on a simple calculation. The estimate is termed mpge. Note that the energy of 1 kg of hydrogen at 33.33 kWh/kg is close in value to the energy of 1 US gallon of gasoline at 33.705 kWh/gal.
Thus, the cycle mpge is
Knowing the input energy, the upstream carbon emissions due to the FCEV can be estimated. While the carbon can be captured as carbon monoxide from the steam reformation, we will simplify the analysis by assuming 198 gCO2/kWh (from Chapter 1, Table 1.1) for the methane input to the reformer.
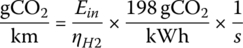
which for this cycle is

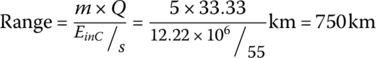
The vehicle range for the FCEV is simply the tank stored energy divided by the fuel consumption:

Thus, the range of the vehicle for this cycle is
The drive cycle results for the FCEV are summarized in Table 4.4.
Table 4.4 Results for drive cycle using an FCEV.
| Speed (km/h) |
Time (s) |
m (kg) |
Ein (MJ) |
ηpt (%) |
FC (Wh/km) |
mpg (US) (mpge) |
Range (km) |
CO2 (gCO2/km) |
| 50 | 1800 | 0.106 | 12.737 | 49.1 | 142 | 148 | 1177 | 44 |
| 90 | 1200 | 0.252 | 30.242 | 47.8 | 280 | 75 | 595 | 87 |
| Idle | 600 | 0.008 | 1.017 | — | — | — | — | — |
| Total | 3600 | 0.366 | 43.996 | 47.1 | 222 | 94 | 750 | 69 |
This example illustrates the advantages and disadvantages of the FCEV compared to the fossil fuel and BEV options. The FCEV powertrain is far more efficient over the drive cycle than the gasoline or diesel vehicles, due to the light‐to‐medium load efficiency, and the range is significant compared to the BEV.
References
- 1 US Department of Energy, Natural Gas for Cars, DOE/GO‐102015‐4685, December 2015.
- 2 http://www.toyota‐global.com/innovation/environmental_technology/fuelcell_vehicle/
- 3 http://www.ushybrid.com/
- 4 Thames and Kosmos, http://www.thamesandkosmos.com/
- 5 Horizon Fuel Cell Technologies, http://www.horizonfuelcell.com/
Problems
- 4.1 A fuel cell has the parameters of Table 4.3. Determine the fuel cell voltage, cell efficiency, and plant efficiency under (i) light load at 1500 A/m2, (ii) medium load at 7,500 A/m2, and (iii) overload of 17,500 A/m2.
Assume ηbop equals 80%.
[Ans. (i) 0.889 V, 95.3%, 76.2%, (ii) 0.79 V, 84.7%, 67.7%, (iii) 0.447 V, 47.9%, 38.3%]
- 4.2 A fuel cell has the parameters of Table 4.3 and has a fuel cell area of 400 cm2. The fuel cell power plant outputs 80 kW at 15,000 A/m2. Assume ηbop equals 80%. See Sections 4.2.1.1 and 4.2.2.1.
- Determine the number of fuel cells and the volume of the stack.
- Determine the plant output voltage, efficiency, and mass rate of fuel at the full‐load power of 80 kW.
- What is the stack no‐load voltage?
[Ans. 268, 14.4 L, 166.4 V, 53.2 %, 1.25 g/s, 250 V]
- 4.3 The vehicle of Section 4.6 is traveling at a constant speed of 120 km/h and requires a traction power of 24.64 kW. See Chapter 2, Problem 2.7. Determine the carbon emissions and range at this speed if the tank has 5 kg of hydrogen.
[Ans. 138 gCO2/km, 373 km]
- 4.4 The drive cycle of Section 4.6 is modified such that the idle period is replaced by a highway cruise at 120 km/h and a required traction power of 24.64 kW (as per the previous problem) for 600 s. Determine the carbon emissions and range for the revised drive cycle.
[Ans. 86 gCO2/km, 599 km]
- 4.5 Determine the mpge and range of the vehicle in Section 4.5 if the vehicle is unloaded. The efficiency of the fuel cell plant is 52% for this condition.
[Ans. 13.4 mpge, 951 km]
- 4.6 A fully loaded bus has the following parameters: mass m = 20,000 kg, drag coefficient CD = 0.7, vehicle cross section A = 10 m2, and coefficient of rolling resistance CR = 0.008. The nominal efficiency of the powertrain and transmission ηpt = 85%, and the auxiliary load is 2 kW. Let the density of air ρair = 1.2 kg m−3. The overall mass of the fuel cell system (including the fuel cell, balance of plant, storage tanks, and mechanical bracketing) is 400 kg plus 80 kg per 5 kg of stored hydrogen.
- Determine the mpge, the hydrogen mass, and the overall mass of the fuel cell system if the vehicle is to travel at a constant speed of 64 km/h for two work shifts of 16 h total, or 1024 km. The fuel cell plant efficiency is 50% for this operating condition.
- Determine the mass of battery which would be required if the specific energy is 0.15 kWh/kg.
- What is the range of the vehicle without passengers if the weight drops by 1/3? The fuel cell plant efficiency is 53% for this operating condition.
[Ans. 10.7 mpge, 60.1 kg, 1362 kg, 6,667 kg, 1315 km]
Assignments
- 4.1 Experiment with a fuel cell kit from suppliers such as [4] or [5].