Mainstream economists often give the impression that cost-benefit analysis (CBA) does not involve value judgments, when, in fact, CBA rests on a number of questionable value judgments, and pretending otherwise only serves to disguise important choices incorporated into the analysis. Mainstream economists also present CBA as the only rational and objective method for making social choices about the environment, when in fact there are many situations where CBA is not the appropriate methodology at all. In particular, CBA is inappropriate when compensation is unlikely to rectify inequities, when people have rights, when power differentials bias estimates of costs and benefits, when time frames are long and the choice of a rate of time discount is overwhelmingly determinant, when continuity is unlikely, when benefits are hard to quantify, and when the consequences of improbable outcomes are very large relative to those of more probable outcomes.
“If the benefits of doing something outweigh the costs, it should be done. But if the costs outweigh the benefits, then it would be a mistake to do it.” What could be more sensible? What could be more obvious? This has the markings of a “truth” that requires no explanation. One might even offer this as a simple definition of rational behavior.
It is hard to imagine a more straightforward approach to social choice, and indeed, this is precisely the attraction of CBA and one reason that challenging it is so difficult. The common sense expressed above is formally stated by economists as the efficiency criterion: If the overall benefits to all people of doing something outweigh the overall costs to all people of doing it, it is socially “efficient” to do it; however, if the overall costs outweigh the overall benefits, it is “inefficient” to do it.1
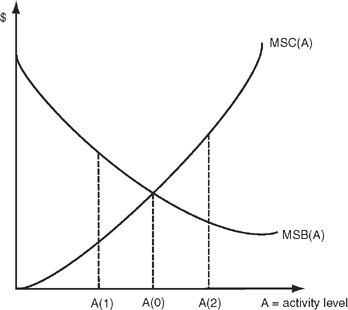
Economists like to think in terms of the effects of making small changes, called marginal changes, in one direction or another, and economists also have a penchant for expressing their theories graphically. The standard way to demonstrate the logic of CBA uses the concepts of marginal social cost (MSC) and marginal social benefit (MSB) and the graph represented in Figure 2.1.
A represents any “action” we could take. As we move rightward along the horizontal axis, we undertake more and more of whatever this action is. A could be the percentage of glass bottles recycled in the City of Portland, the percentage reduction in the average arsenic content in drinking water in West Virginia, the reduction in the number of tons of sulfur dioxide emitted from power plants in the United States, or the reduction in the number of tons of greenhouse gases emitted worldwide in 2012 compared to 1990. The MSC curve shows the cost to society of engaging in the last unit of action A at different levels of action. If we choose the cheapest way of doing things first, the cost of doing yet more will increase as we do more and more, and the MSC curve will rise as A increases. The MSB curve shows the benefit to society of engaging in the last unit of action A at different levels of action. If the more of something we have done already, the smaller the benefit will be from doing yet more, the MSB curve will fall as A increases. What is exceedingly useful about this diagram is that it allows us to determine the socially efficient or “optimal” level of action to engage in, A(0). It is the amount where the MSC of the last unit of action A is equal to the MSB from the last unit of action A. This is demonstrated easily by eliminating all other possibilities.
For any level of action A less than A(0), such as A(1), what would be the effect of increasing activity A one more unit? To see what the additional cost to society would be, we go up from A(1) to the MSC curve. To see what the additional benefit to society would be, we go up from A(1) to the MSB curve. But when we are at level A(1), the MSB curve is higher than the MSC curve, indicating that engaging in more of activity A increases social benefits more than it increases social costs. In other words, there are positive net social benefits from expanding activity A at activity level A(1), and therefore A(1) cannot be optimal, or socially efficient. For any level of production greater than A(0), such as A(2), what would be the effect of decreasing activity A by one unit? To see what the savings in social cost would be, we go up from A(2) to the MSC curve. To see what the lost social benefit would be, we go up from A(2) to the MSB curve. But when we are at A(2), the MSC curve is higher than the MSB curve, indicating that reducing activity A by one unit reduces social benefits by less than it reduces social costs. So there are positive net social benefits from reducing activity A at A(2), and therefore A(2) cannot be socially efficient.
So for all A < A(0) we should expand activity A to increase net benefits, and for all A > A(0) we should reduce activity A to increase net benefits. Therefore, the only level of activity A that is efficient from society’s point of view is the level where the MSB of the last unit of activity A engaged in is equal to the MSC of the last unit of activity A, which in Figure 2.1 is A(0). At any other level of activity A, we could increase net social benefits by expanding or reducing activity A.
This is a powerful tool indeed! The efficiency criteria as illustrated in Figure 2.1 appears to tell us how much we should recycle in Portland, how much we should reduce arsenic in drinking water in West Virginia, how much we should reduce sulfur dioxide emissions from power plants in the United States, and how much we should reduce global greenhouse gas emissions. Can it really be this simple? The remainder of this chapter explores why it is usually not this simple.
Despite the appearance of objectivity, a host of value judgments lies behind CBA. This, in and of itself, is not objectionable because value judgments necessarily lie behind any approach to social choice. What is misleading is the pretense that this is somehow not the case when we use CBA and the consequent failure to provide justification for important value judgments that underlie analyses.
Whereas the efficiency criterion and CBA may be the “rational” way for an individual to approach decision-making, society, of course, is comprised of many different people and many different interest groups. Since different people and groups will be affected differently by any social choice, it is immediately apparent that matters are a bit more complicated than CBA suggests. There will be losers as well as winners if the environment is better protected, just as there are always winners as well as losers when it is degraded. In other words, there are always distributive issues as well as efficiency issues involved in environmental policy choices, and pretending otherwise, which is the practical effect of CBA as usually practiced, would appear to be an obvious oversight.
However, it would be a mistake to assume this is simply an egregious oversight on the part of the economics profession. In fact, economists have historically engaged in self-doubt and much soul-searching surrounding precisely this complication. Unfortunately, the soul-searching has been conducted almost entirely when the economics “court” is in “closed session.” When results of CBA studies are released, they are seldom accompanied by a disclosure that recounts the history of economic thought about the disadvantages of cardinal versus ordinal theories of utility, much less the perils of interpersonal utility comparisons.
To use CBA, one must be willing to do two things mainstream economists have historically shown a great reluctance to engage in. One must embrace a cardinal theory of individual utility rather than an ordinal theory of utility, and one must engage in interpersonal utility comparisons. Those who apply CBA must first measure changes in costs and benefits to different people quantitatively. It is not enough to say Peter will be made better off while Susan will be made worse off. To carry out CBA, we need to know Peter will be nine units better off than he was before, while Susan will be five units worse off than she was before. This amounts to committing to what economists call a cardinal rather than an ordinal model of utility for individuals, which mainstream economists have historically been very uneasy about and often go to great lengths to avoid. Next, the scale used for measuring utility, or benefit, for Peter and Susan must be the same because CBA requires us to compare the magnitude of the benefit gained by Peter to the magnitude of the benefit lost by Susan.
However, before the benefits that have been quantified for Peter and Susan using the same scale are added together, we must also decide how much to count a unit of benefit for Peter compared to the loss of a unit of benefit to Susan. While many would never give a second thought to what they were implicitly assuming before adding nine and subtracting five, economists have historically been more self-conscious and cautious. What if Susan is more deserving than Peter? Economists historically acknowledge that at this point in the application of CBA a decision must be made about how to weigh benefits to Peter and Susan before we add them. We may wish to weigh losses to Susan “the deserving” twice as heavily as gains to Peter “the unworthy”—in which case we would add nine and subtract two times five, which gives a very different result.
In sum, historically and as a profession, economists have pondered the most immediate complications of applying CBA: Can benefits to different people be quantified, compared, and conflated, and if they can, should they be? But when economists practice CBA today, they more often than not put all these self-doubts out of mind and invariably hide them from public view. Without admitting as much, economists who practice CBA also lose claim to much of the theoretical progress neoclassical welfare theory pretends to over the past hundred years. Neoclassical theorists pride themselves as having “progressed” from the “primitive” classical utilitarian notion of knowable, additive, interpersonally comparable cardinal utilities, first to ordinal utilities, then to indifference curves, then to the theory of revealed preferences, and finally to the “axioms” of rational choice—where each of these stations of the cross is portrayed as a significant theoretical advance. Whether or not all the self-congratulation is deserved, one thing is clear: CBA takes its practitioners all the way back to the “primitive” nineteenth-century world of classical utilitarianism.
Putting theoretical niceties aside, the bottom line is this: We cannot apply CBA without making value judgments. Even if it is possible to accurately estimate benefits and costs quantitatively—which is by no means a trivial task, as discussed below—we must make a value judgment that benefits and costs for different individuals and groups of people are quantifiable and comparable. We must make a value judgment about how much to weigh the welfare of different individuals and groups. Finally, as discussed below, we must make a value judgment that no individual or group rights are at stake, so that maximizing our measure of social welfare is all that matters.
It would also be naive not to recognize that, on a very practical level, when people argue over CBA it is often not really maximizing social welfare they care about. Different constituencies have different interests in whether or not to protect the environment and how to protect it. But to argue for or against environmental policies on the basis of what will most favor one’s group is not usually persuasive, except among members of a group trying to identify their own self-interest. So, instead, interested parties usually try to argue that what happens to be best for them is coincidentally in the social interest. One way to slant a CBA to favor the outcome one personally prefers is through choice of value judgments. When value judgments are implicit rather than explicit, and especially when practitioners pretend there are no value judgments involved in CBA, deception is all the more likely.
It is a truism that if aggregate benefits exceed aggregate costs, then it is possible for those who benefit from a policy to fully compensate those whom the policy disadvantages for their losses and still enjoy positive benefits for themselves. If this were done, it would prevent the policy from harming anyone, but it would mean that the entire efficiency gain from the policy had been appropriated by those the policy advantages. Of course, it is also possible to distribute the entire efficiency gain from any policy to those who are disadvantaged by the policy itself. If those who “won” compensated all who “lost” to the point where the winners were no longer any better off than they had been originally, again the policy would have harmed no one, but in this case the entire efficiency gain from the policy would have been awarded to those the policy itself harmed in some way. When a policy passes muster according to CBA, this simply means there is an efficiency gain. Once we realize this, it is obvious that in theory the efficiency gain from any policy can be distributed in an infinite number of ways.2
But it is important to realize that in general policies that bear the CBA stamp of approval do more than generate and distribute an efficiency gain. They also redistribute pre-policy welfare. Suppose there is no compensation following implementation of a policy. Not only will the winners capture the entire efficiency gain from the policy, they will also capture whatever those disadvantaged by the policy lose! In other words, if a policy generates an efficiency gain but also creates losers as well as winners, absent compensation the winners will capture 100 percent of the efficiency gain from the policy plus 100 percent of everyone else’s losses.
The first problem with talk about compensation is that it is all too often just that—only talk. Knowing that in theory any policy that passes their CBA test need not harm anyone may ease economists’ consciences, but theoretical compensation that is not actually paid does nothing to ease the pain of those the policy harmed. As a matter of fact, knowing that the harm was not necessary might make the damage inflicted even more painful!
But there is a second problem when economists talk about compensation that progressives are often oblivious to. When economists do talk about actual rather than theoretical compensation, they are only talking about compensation for the redistributive effects of a policy. Discussion is invariably about whether or not some of the benefits of winners will be transferred to losers. The standard operating assumption is that fully compensating the losers for their losses would be the most that anyone could hope for, and since reasonable people understand the world is never perfect, losers should be happy to settle for something less than full compensation. But notice that this mind-set implicitly assumes that those who benefit from a policy deserve to capture the entire efficiency gain from the policy! This mind-set not only implicitly assumes that the pre-policy distribution of welfare was fair in the first place, it also assumes that those whom a policy benefits deserve to capture the entire efficiency gain while others deserve not to benefit at all.
Progressives should always approach compensation in a very different way. We should start by asking whether or not the pre-policy distribution of welfare was fair in the first place. If not, we need to identify who has more welfare than they deserve and who has less than they deserve. Only then does it make sense for progressives to join in where others begin, namely identifying whom a policy benefits and whom it harms, and considering if compensation is in order. If the winners happily coincide with those whom progressives regard as more deserving, and if the losers are those we consider less deserving, then the redistributive effect of the policy is progressive and reduces economic injustice. In this case, progressives have no reason to support compensation since this will only reduce the amount by which the policy serves the cause of economic justice.3 On the other hand, if a policy advantages those progressives find less deserving and disadvantages those we find more deserving, progressives should fight hard for compensation. But we should not merely insist on compensation only for the regressive redistributive effect of the policy. We should point out that in addition to whatever compensation is necessary to make the more deserving victims of a policy “whole”—that is, restore them to their pre-policy level of welfare—unless they also receive additional compensation sufficient to award them at least half of the efficiency gain, the policy will have had the effect of aggravating preexisting economic injustice. When we consider different domestic environmental policies in Chapter 7 and international climate policy in Chapters 8, 9, and 10, these lessons are very important to keep in mind.
In the example above, what if Susan and Peter are equally deserving, but the loss of five units of benefit to Susan violates Susan’s rights in some way? In this case, weighing Susan’s well-being more heavily than Peter’s is no solution and, in fact, misses the point altogether. If Susan has a right that would be violated by a policy that provides Peter with greater welfare, then unless Susan agrees to waive her right it does not matter how much better off Peter will be.
The philosopher John Rawls has made this point most recently (Rawls 1971), and most persuasively, but philosophers who subscribe to “contractarian” theories of social justice have made this criticism of utilitarianism for centuries, and CBA is nothing more than applied utilitarianism. In short, the notion of “rights” is intrinsically incompatible with utilitarianism and CBA.
One important category of “right” is safety standards. According to this reasoning, no matter who you are or where you live, you should be able to have access to water that is safe to drink. Of course, nothing is ever completely safe, and safety standards must be quantified also. For example, in 1992 the Environmental Protection Agency (EPA) defined a “safe” level of lead in drinking water as anything less than 15 micrograms of lead per liter of water, and a safe level of copper as anything less than 1.3 milligrams of copper per liter of water. Obviously 10 micrograms of lead and 1.0 milligrams of copper would be safer, so ultimately safety standards come down to estimating the likelihood of adverse affects on human health of different standards and deciding how much health risk we are willing to tolerate. In other words, in the case of standards, the value judgment takes the form of how safe is safe enough.
A recent hot debate over arsenic standards for drinking water illustrates the difference between CBA and a rights-based, safety standard approach. Arsenic standards for drinking water were set in 1946 at 50 parts per billion. In 1999 a report by the National Academy of Sciences based on new toxicological evidence concluded that 50 ppb was not safe enough and recommended tightening the standard. After studying the issue, the EPA initially proposed to lower the arsenic standard to 10 ppb. However, in March 2001 the Bush administration announced it was not accepting the new standard on grounds that CBA analysis revealed that the estimated benefits of lowering the standard to 10 ppb did not outweigh the estimated costs. In response to public outcry, the House of Representatives voted to direct the EPA to implement the 10 ppb standard anyway—implicitly rejecting CBA and endorsing a safety standard based on the best available health science as the appropriate methodology in this situation.
We consider two examples to illustrate how ignoring differences of power and wealth adversely affects environmental economics as traditionally practiced.
Asking the wrong question: The activity that employs more environmental economists than any other is conducting contingent valuation (CV) surveys. The problem these surveys address is that we often have no quantitative estimate of how much people benefit from protecting the environment to weigh against the costs of more protection, which are often presented in dollars, right down to the last penny. Below we discuss the strengths and weaknesses of CV surveys compared to other methods used to provide quantitative estimates of environmental benefits. But a simple example of how applied environmental economics ignores wealth and power is illustrated by an obvious error in the question CV surveys invariably ask respondents.
Suppose we are trying to determine where it is most efficient to locate a waste dump and we want to get a quantitative estimate of how strongly residents of different communities feel they would be adversely affected if the dump were located near them; that is, we want to measure differences in communities’ “preferences” for a safer environment compared to their preferences for other things, like food and clothing. In Washington, DC, when survey-takers ask residents of Chevy Chase, a wealthy enclave in the northwest quadrant of the city, how much they would be willing to pay not to have a toxic dump in their neighborhood, they will predictably answer much larger dollar amounts than residents of Anacostia, a poor ward in the southeast quadrant of the city. But does this mean it is efficient to locate the dump in Anacostia rather than Chevy Chase?
Even if residents in Anacostia placed a higher priority on their health compared to other goods than the residents of Chevy Chase, and therefore it was actually more efficient to locate the dump in Chevy Chase, and even if residents of both neighborhoods responded truthfully, the dollar amounts Anacostia residents would answer would be far lower than the dollar amounts Chevy Chase residents would answer simply because people’s incomes in Anacostia are much lower than people’s incomes in Chevy Chase. The problem is that when respondents answer the question typically asked in CV surveys, their answer reflects not only the strength of their preference, or aversion in this case, but also how much income they have with which to express their preferences for everything. In other words, CV surveys invariably ask the wrong question and thereby bias estimates of environmental benefits.
What is striking is how easy it would be to correct this mistake, and yet it is almost never done. Either by asking respondents what percentage of their income they would be willing to pay, or by asking respondents their incomes as well as their willingness to pay in dollars, one could correct for this obvious bias and practice CV to measure strength of environmental preferences in a way that gives one person one vote rather than one dollar one vote. However, failure to conduct CV surveys fairly is not the likely explanation for the fact that hazardous waste sites are disproportionately located near where racial minorities and poor people live in the United States (Commission on Racial Justice 1987). That is best explained by the power-weighted decision rule.
The power-weighted decision rule: Suppose activity A in Figure 2.1 is some form of environmental degradation. If those who benefit from the degradation are more powerful on average than those who are harmed, James Boyce (2002) explains the outcome is likely to lie to the right of A(0), whereas if those who benefit are less powerful on average than those who are damaged, the outcome is likely to lie to the left of A(0). There are, of course, many reasons that people and groups have more or less power, including differences in wealth, race, gender, and political connections. These are factors that political economists like Boyce take seriously and integrate into their studies, while such factors are generally ignored in mainstream treatments. But just as mainstream economic theory infers utility from what individuals reveal when they buy in markets, Boyce suggests we can infer power from the revealed preferences of society regarding social decisions. The farther to the right of A(0) we actually end up, the more powerful those who benefit from degradation must be compared to those who are harmed.
For example, why are Brazilian forests converted to cattle ranches even though an objective estimation would reveal that the costs outweigh the benefits of doing so? In other words, why is the outcome far to the right of A(0) when it comes to destruction and degradation of tropical forests in Brazil? Boyce explains it is because the beneficiaries include the landed aristocracy in Brazil and those living primarily in advanced economies and enjoying high enough income to eat beef frequently, while those who bear the costs are primarily indigenous forest dwellers, small farmers living downstream, and future generations who will suffer from climate change (Boyce 2002, chapter 4).
The benefits of environmental degradation typically occur sooner than the costs, while the benefits of environmental protection invariably come later than the costs. This means that environmental cost-benefit studies will be sensitive to the rate of time discount chosen by the analyst. If a benefit or cost is treated in the same way no matter when it occurs, then there is no “discounting” and the rate of time discount is zero. However, if net benefits farther in the future are deemed less important than net benefits in the present, a positive rate of time discount is used, and the higher the rate of discount the more strongly future consequences will be discounted compared to more immediate consequences. Chapter 4 reviews the debate over what the appropriate rate of time discount should be for environmental policies and explains the effects of discount rates on extraction rates of natural resource deposits. Here the point is only to illustrate how sensitive CBA is to choice of a discount rate.
Suppose we use CBA to decide whether or not to protect our grandchildren from a climate-related loss of $100 they will suffer sixty years from now. According to CBA, how much should we be willing to pay today to prevent their loss sixty years from now?4 If we use a zero discount rate, we should be willing to pay up to $100 today for this $100 benefit for our grandchildren sixty years from now. However, if we use a discount rate of even 1 percent, CBA indicates that we should not pay more than $55. If we use a 3 percent discount rate, CBA will tell us not to pay anything over $17. If we use a 5 percent discount, CBA will instruct us not to pay much more than $5. Clearly, the amount that CBA shows is “rational” to spend now to avoid environmental damages later is highly sensitive to choice of a discount rate.
Of course, when time frames are even longer, sensitivity is even greater. If the climate-related loss of $100 will occur 200 years from now instead of sixty years from now, CBA suggests that avoiding it is worth paying only $13.70 now if we use a 1 percent discount rate, only $0.30 now if we use a 3 percent discount rate, and not even a penny now if we use a 5 percent discount rate. Clearly any consequences 200 years down the road will be rendered effectively invisible by CBA at discount rates that are typically used. Do we really want to ignore the environmental consequences of our choices that occur 200 years or more in the future? How would we feel if those who ruled in 1810 had decided that none of us alive today mattered at all?5
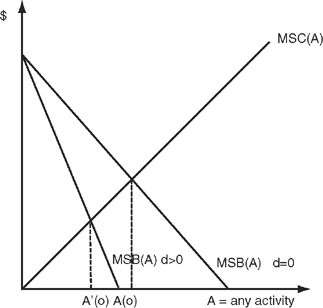
As Figure 2.2 shows, if activity A is protecting the environment in some way or another, and if we assume that the benefits of greater protection occur in the future while the costs occur in the present, the effect of increasing the rate of time discount, d, is to rotate the MSB line downward. This moves the point where the MSB line crosses the MSC line to the left, and A(0), the optimal level of protection, will therefore be lower than before. Again we see that the higher the rate of time discount used, the lower the level of environmental protection CBA will recommend as optimal.
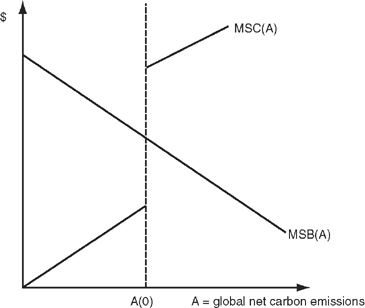
Tipping points mean that marginal damage curves are not continuous and no longer look like the MSC curve in Figure 2.1. Suppose the activity measured on the horizontal axis is annual, global, net carbon dioxide emissions (i.e., tons of carbon dioxide released into the atmosphere during a year, minus tons of carbon dioxide sequestered, or taken out of the atmosphere during the year). The marginal benefit curve, MSB, may still look something like the one drawn in Figure 2.1 since there continue to be positive but continuously declining benefits from burning more and more fossil fuels while technologies and infrastructure to produce and distribute renewable energy sources are still being developed. But the MSC curve will no longer be rising continuously. It may rise continuously in the beginning as burning more fossil fuels generates slightly more “mild” climate change, but once we reach a climate tipping point there will be a break in the MSC curve, the curve will skip significantly upward, and then perhaps continue to rise slowly again, as depicted in Figure 2.3.
Scientists devote a great deal of attention to what might possibly trigger a climate tipping point. Melting of Greenland or Antarctic glaciers; disappearance of the polar ice caps, which reflect a great deal of sunlight; thawing of the permafrost in northern tundra, releasing large quantities of methane frozen there; die-off s of whole forests as tree species cannot travel fast enough away from the equator as temperatures warm; reversal of ocean currents like the Gulf Stream, which warms Europe; and other possibilities that could unleash positive feedback affects that would further accelerate climate change to cataclysmic levels are taken more seriously by scientists every year.
In theory, CBA is still applicable even if there is a tipping point. According to Figure 2.3, we should continue to increase net carbon emissions up to A(0), just as before. According to Figure 2.3, every ton of net emissions up to A(0) will increase social benefits by more than it increases social costs. Only further reductions beyond A(0) would cause more damage than benefits. But this is the key point: We had better be very sure exactly where the tipping point is or we risk making a very, very big mistake. Initially, as we increase net emissions, the benefits of doing so will be significantly higher than the costs—sending a strong signal that we should keep increasing emissions. But the problem is that this strong signal will continue right up to the tipping point. When we compare benefits to costs one ton before the tipping point, A(0), the signal will still be strong that marginal benefits are much higher than marginal costs, telling us to keep on increasing greenhouse gas (GHG) emissions. If we had some other way to pinpoint precisely where the tipping point is, we could ignore this misleading economic signal and there need be no problem. Or if, having passed the tipping point, we could simply backtrack once we realized our error, the mistake would not be disastrous. But scientists have told us very clearly that they do not think they can predict exactly where the tipping point will come, and of course once we have passed a climate tipping point there is no going back to correct for our mistake. This means that comparing costs and benefits of increasing carbon emissions to decide if further emissions are “efficient” may be a disastrous methodology to use for making this social decision.
In 1960, if you asked the manager of a power plant using coal how much it would cost to reduce emissions of sulfur dioxide from his plant, he would have had a hard time giving you a number, although he would have assured you that it would be very expensive. The reason he would not have had a number ready is that in 1960 nobody had suggested charging power plants for sulfur dioxide emissions, and therefore he had never asked his engineers to figure out what changes would be necessary to reduce emissions, so his accountants could translate whatever changes they recommended into dollars and cents. But in the 1990s, when it was apparent that a sulfur dioxide cap and trade policy was going to be passed and that power plants were going to pay a price for sulfur dioxide emissions, managers of utilities ordered their engineers and accountants to come up with numbers that they presented in congressional testimony right down to the penny. Of course, there was some legitimate uncertainty, and of course they deliberately inflated the estimates to convince Congress to loosen the cap on aggregate sulfur dioxide emissions from power plants and give power plants more permits to emit sulfur dioxide free of charge. But as soon as there was reason to need them, precise quantitative estimates of how much it would cost to reduce sulfur dioxide emissions were available, and after the Clean Air Act was amended in 1990 to cap emissions of sulfur dioxide from power plants, and plants did switch to coal with a lower sulfur content and installed scrubbers in smokestacks, those numbers were no longer only estimates.
But to apply CBA we also need to know something quantitative about the benefits of reducing emissions, and there lies the rub. While quantitative estimates of the costs of emission reductions are readily available, translating a long list of different ways that reducing emissions will provide benefits into a single number is very difficult. It is so difficult that many people quickly despair, concluding that only a fool would tackle the task of trying to quantify the benefits of environmental protection. The next section of this chapter reviews the problems that arise and then evaluates the methods that economists, driven by necessity if they want to use CBA at all, use to quantify what many noneconomists regard as unquantifiable.
The first problem is that environmental protection is a public good since it benefits many people. So we must identify the affected population and make a choice about how to weigh and sum different degrees of benefit to different people. The most obvious value the environment can have is for people who use it in some way. Those who breathe cleaner air, drink purer water, live on a coast with a beautiful ocean view, or vacation in a national park gain what economists call “use value” from the environment. However, people may value the environment for other reasons as well, further complicating matters. People may value some part of the environment even though they never use it personally in any of the above ways. People who know they will never visit the Arctic National Wildlife Refuge (ANWR) in Alaska may value knowing that ANWR exists as a protected habitat for many Arctic wildlife species, off-limits to oil exploration and extraction. Or people may value the existence of the Bengal tiger in its native habitat even though they will never travel to India or Bangladesh. ANWR and the Bengal tiger will never have use value for most people because only a very few will ever see them, but they both may have what environmental economists call “existence value” for tens of millions of people.
Finally, because there is often a great deal of uncertainty about what the effects of permitting the environment to deteriorate may be, and because the decision may be irreversible, preserving the environment can have what economists call “option value” for people. Just as commodity speculators pay money for “options” that give them nothing more than the right to buy a commodity at a particular price later in time if they choose to, people may want to protect the environment because they want to preserve the option of making a decision about the environment at a later date, perhaps when they think the consequences will be more predictable and clear. For example, even if a particular species, such as the snail darter, has no known use value today and, unlike the magnificent Bengal tiger, nobody attributes any value to knowing it exists, people might still wish to protect it for now in order to preserve the option of being able to decide later what to do about it.
The strongest argument for quantifying environmental benefits even when this is difficult is that unless environmental benefits are quantified, it is very difficult to present a case for how and to what extent they should be weighed against costs that are quantified. Environmental economists use three main methods to tackle what they understand is a difficult practical problem. There are situations in which the results from these methods of quantifying environmental benefits inspire confidence and thereby provide a strong prima facie case for using CBA, provided there are no other reasons to believe that CBA is inappropriate. But often “solutions” to the quantification problem are not robust and inspire little confidence. In these cases, insisting on plowing ahead regardless, making important social choices on the basis of highly questionable CBA analyses, is problematic, to say the least.
CV: The most direct approach to quantifying environmental benefits is to simply ask people the dollar value to them of an environmental benefit or the dollar value of the damage to them from environmental degradation. These CV surveys come in two forms: willingness to pay (WTP) surveys ask respondents the maximum amount they would be willing to pay for a little more environmental protection of one kind or another; willingness to accept damages (WTA) surveys ask respondents the minimum amount they would accept to compensate them for tolerating a little more environmental degradation. If people surveyed gave accurate estimates of the benefits (WTP) to them of slightly more protection, or of the costs (WTA) to them of slightly less protection, and if those surveyed were a sufficiently large random sample of all affected parties, then an accurate quantitative estimate of the benefits of environmental protection or costs of environmental degradation could be calculated. Moreover, CV surveys have important advantages over other alternatives. As noted in the last chapter, CV surveys could easily control for differences in income, although they typically do not, whereas the most common alternative method, hedonic regression, cannot. More importantly, CV surveys can capture option and existence value as well as the use value of environmental protection, which, as we will see, other methods cannot.
However, there are serious problems with CV surveys and strong evidence that they are often quite unreliable. Consider the two questions: (1) “How much would you be willing to pay for an incremental improvement in environmental quality of some particular kind?” (2) “How much would you insist on being paid to accept an incremental increase in degradation of the same environmental quality?” Even though respondents should give almost identical answers to these two questions, they often do not. While answers might differ slightly since the marginal movements are in opposite directions, reliable answers should differ only slightly. Unfortunately, this is far from the case. It turns out that in cases where both questions are asked, on average WTA estimates are three to four times as high as WTP estimates! This obviously casts great doubt on the accuracy of CV estimates in general. Presumably the reasons for inaccuracies are due to “biases” that have been much discussed by environmental economists who carry out CV surveys.
1. Free-rider bias: People deflate WTP answers in an attempt to reduce actual payments they fear will result, and they inflate WTA damage estimates in an attempt to increase actual payments they anticipate. Of course, this is nonsense since respondents should be informed that their answers are completely hypothetical and will not serve as the basis for any actual assessments or payments later. But if those conducting the survey do not convey this fact clearly, or if the respondents are suspicious and do not believe it, or if people who live in market economies simply function in an automatic pilot bargaining mode, free rider bias can be expected. It is obviously a major problem since it is the most plausible explanation for the wide discrepancy between WTP and WTA estimates.
2. Hypothetical bias: People may not give the questions serious consideration if they understand that they will neither be paid nor assessed any money based on their response. Economists are generally suspicious of people’s self-reported valuations whenever they do not have to “put their money where their mouth is,” so to speak, and generally trust preferences that are revealed through people’s behavior more than preferences that are simply self-reported.
There is an obvious dilemma when trying to correct for both free-rider and hypothetical biases. To reduce free-rider bias risks increasing hypothetical bias, and vice versa. What we are often left with are survey-takers mouthing platitudes about the importance of “good citizenry” to reduce hypothetical bias and conducting both a WTP and WTA survey to get a lower and upper bound, as well as an average estimate, if time and money permit.
3. Embedded bias: Especially in situations where people commonly profess great ignorance and inability to respond, it can help to provide factual information about the predictable consequences of a choice. But what information is provided, even if it is factually accurate, not surprisingly has a large impact on results. Even the order in which questions are asked can influence answers.
4. Ignorance bias: This is not a phrase in the literature, but it may be the root source of problems with CV surveys. People simply do not know as much about environmental “goods” and “bads” as they do about things they buy in the marketplace all the time. There are two kinds of ignorance: (1) How much sicker am I likely to be if particulate pollution rises by 10 percent? Most people do not know; and (2) How will I feel once a trout stream that has always been there is gone because a dam flooded the area? Obviously reducing ignorance bias risks increasing embedded bias, and vice versa, just as reducing free-rider bias risks increasing hypothetical bias, and vice versa.
5. Strategic bias: If I believe that most people value an environmental amenity less than I do, I might be tempted to overstate my own preference when responding to a survey. Alternatively, if I believe most people value the amenity more than I do, I might be tempted to understate my own preference. These would be conscious attempts on my part to manipulate the survey outcome—to deliberately exaggerate my own preferences in order to achieve an outcome closer to what I would truthfully prefer given my beliefs about what others will want and say they want. But strategic bias may be less of a problem than researchers fear. If people to the right and left of the mean engage in this kind of strategic maneuvering to the same extent, their strategic biases should cancel each other out. Moreover, there seems to be no reason to expect strategic bias itself to be skewed.
Travel cost studies: The benefits of environmental recreational amenities such as national parks can be measured by estimating a demand curve for their use, even when no price is charged, by using travel costs. Users are asked how far they traveled, what their travel cost was, and how many visits they have made to use the amenity. Different travel costs are interpreted as different prices, and the number of visits made by people paying different travel costs is interpreted as the demands at different prices. The chief advantage of this method is that people are putting their money where their mouths are. The chief disadvantages are that it applies only to environmental amenities people travel to use, option and existence value are not captured, and unless travelers’ income data are collected, the method measures one dollar one vote, not one person one vote.
Hedonic regression: Researchers impute the value of an environmental amenity or degradation to the difference or change in value of a different good for which there are market prices, after controlling for all other factors that would produce differences in the market price of the other good. For example, after controlling for city size, average income, and so on, the difference in real estate values between different cities can be attributed to differences in pollution levels. Or the drop in housing prices along a coast can be attributed to the damage from an oil spill after all other factors that would have influenced those housing prices are controlled for. The trick is obviously how well the researcher controls for all other influences, and many times the data necessary to do this are not available. Like travel cost studies, hedonic regression is inherently incapable of capturing option and existence value, and there is no way to turn dollar-weighted votes into people-weighted votes.
Many people are very skeptical about how well these techniques measure the true value of environmental protection. A common reaction from my students after they study these procedures is, “You’ve got to be kidding me!” And even environmental economists whose livelihood depends on getting paid to carry out these studies often express serious misgivings about how much faith one should put in their results. These reactions are understandable and reasonable. The problem is, however, that in market economies there are no alternatives. Market economies contain no “environmental preference revealing mechanism” that forces people to make frequent choices about the environment in situations where they will be rewarded for behavior that accurately indicates their actual preferences and punishes for deception. In the conclusion of this book we briefly consider such a mechanism, but for now there is no alternative to CV surveys, travel cost studies, and hedonic regressions if we want to estimate the benefits of environmental protection quantitatively.
Moreover, the practical consequences of failure to estimate environmental benefits quantitatively are severe. Environmentalists who criticize efforts to put a dollar value on environmental benefits should be aware of the implications of failure to do so. If important social choices will be based on CBA in market economies where quantitative estimates of the costs of protecting the environment are often readily available but quantitative estimates of the benefits of protecting the environment are not provided, CBA will continue to tilt the playing field strongly against protecting the environment.6
Since without an environmental preference revealing mechanism CV surveys are the only available technique that can capture existence and option value as well as use value, and since CV surveys can easily correct for differences in income if the proper questions are asked, environmentalists have a great deal riding on improving the accuracy and credibility of CV estimates. Besides making the adjustments for differences in income, as discussed previously, this means putting more time and money into better surveys. Free-rider bias can be reduced only by making respondents understand that their answers will not influence any actual payments. To minimize the consequent aggravation of hypothetical bias—failure to give serious consideration to weighing the options—respondents should be generously compensated for their time independent of their answers. To reduce ignorance bias, much more information about predictable consequences must be provided, and time necessary to make sure respondents have digested the information must be budgeted as well. To minimize the adverse consequences of aggravating embedded bias—coaching for answers desired—different views and opinions about relevant information should be presented. All these improvements in CV surveys will require much more money and time. On the other hand, given the magnitude of the consequences of many decisions we currently use CBA to make, additional expenses would surely be “cost-effective”!
However, in addition to working to improve the reliability of CV surveys, environmentalists should also challenge those who claim that large discrepancies between WTP and WTA estimates necessarily indicate that CV surveys contain little information of any value. What if the real problem is ignorance bias? What if people simply do not have firm preferences for what economists call “environmental amenities” as they do for different foods, clothes, cars, restaurants, houses, music, and so on? After all, people neither buy nor answer surveys about environmental amenities very often. People are not used to thinking about how much they value environmental amenities and predictably have a large margin of internal error as a result. When the question is posed as “What would you be willing to pay?” the ignorance comes out in the form of a minimal estimate. When the question is posed as “How much would you have to be paid?” the ignorance is expressed as a maximum estimate. In both cases, respondents are merely providing a conservative response in a state of internal ignorance. Not wanting to overreact, given their state of ignorance, they respond to a WTP formulation by naming the least amount they might be willing to pay—not wanting to say more than they would, in fact, be willing to pay if they were less ignorant. Similarly, in responding to a WTA formulation, people name the highest amount they would have to be paid to be fully compensated for the environmental loss—not wanting to say less than might actually turn out to be necessary to compensate them if they were less ignorant.
If this is what is actually going on, then discrepancies between WTP and WTA are not illogical and inconsistent answers to the same question: they are lower and upper bounds that respondents provide in a state of great ignorance. People who give an answer four times bigger to the same question phrased differently do not, admittedly, sound like reliable informants. On the other hand, given that people have a great deal of internal ignorance about their preferences for environmental amenities, answers suggesting a four to one range of possible preferences sound pretty reliable.
This hypothesis could be tested by doing WTP and WTA surveys about goods for which people have much more certain preferences—goods they buy all the time. If I am right, we would get very small differences between their answers in these situations, implying that it is really ignorance bias, not unreliable respondents, that is the explanation for the observed discrepancy between WTPs and WTAs in environmental surveys. Of course, we could quibble with respondents about not construing our phrasing as an implicit request for lower and upper bounds. But it would be better to simply thank them for letting us know (1) the range of their uncertainty due to internal ignorance and (2) the upper and lower bounds of their preferences.
Over the past decade, at the same time the warnings of scientists grew louder and more unanimous about the dangers of climate change unless GHG emissions were reduced substantially, the economics profession continued to construct ever more complicated models estimating that the costs of significant emission reductions in the present could not be justified by the future benefits that the models predicted those sacrifices would yield. While misleading results from these economic climate models also derive from some highly questionable assumptions,7 one reason mainstream economic models yield conclusions disturbingly at odds with the recommendations of climate scientists is that they misconstrue the question they should be addressing and consequently mistreat risk.
How should we take into account events whose likelihood of occurring is extremely small? The answer to this question critically affects how we analyze risk in many situations, most notably climate change. The standard answer is that if the probability of occurrence is small enough we should basically ignore an event. This is not only convenient but also reasonable if the consequences associated with highly improbable events are of comparable magnitude to the consequences of much more probable outcomes.
However, what if the consequences of a highly improbable event are exceedingly large—bordering on the incalculable? Combine “incalculable” with “highly improbable” and you have two reasons for analysts to avoid what is now popularly referred to as a black swan—an event that is highly improbable but whose consequences if they do occur dwarf the consequences of more probable outcomes. Black swans are the nightmare everyone would like to ignore. However, when seeking to protect the public interest over generations, we ignore black swans at our peril—which is unfortunately what failure to take precautionary measures to avoid climate change amounts to.8
Is maximizing the expected value of our actions always the appropriate criterion, which is what CBA implicitly assumes? If a course of action almost always produces small negative payoffs and only yields a large positive payoff once in a blue moon, then we would always reject this course of action in order to maximize expected value if the blue moon occurs seldom enough. However, if people always behaved in this way they would not buy insurance, nor would companies find it profitable to sell insurance policies. The profitability of the insurance industry hinges ultimately on the willingness of buyers to pay more in annual premiums than the expected payout in the event of a blue moon. Put differently, the insurance industry enjoys positive profits only because many of us, fearful of a black swan we can ill afford, buy insurance policies with a negative expected value for the buyer and a positive expected value for the seller. Are we to believe it is foolish to buy insurance against black swans we cannot afford?
Climate scientists have informed us that if we refuse to pay the costs of reducing GHG emissions over the next forty years, there is a high probability of moderate climate change and a much smaller probability of cataclysmic climate change. Even if economic modelers were correct that in the event of moderate climate change the benefits of avoidance fail to outweigh the costs,9 is it unwise for us to insure ourselves against a climatic black swan whose negative consequences are literally incalculable? Irrespective of whether avoiding moderate climate change is cost-effective, if we use the appropriate risk model even a small probability of cataclysmic climate change would still recommend the precautionary policy of paying the necessary costs of avoiding climate change unless those costs were truly astounding.
In the case of economic climate change modeling, it is inappropriate to assume that our goal is to maximize the expected value of climate change policy—which is what mainstream economic climate models implicitly assume when they apply CBA to determine how much emissions reduction is warranted. Insurance policies by their nature invariably have negative expected values, but that does not mean it is never wise to buy one.
The overwhelming consensus among climate scientists is that the likelihood of cataclysmic climate change if we do little to GHG emissions is far greater than the likelihood of a once-in-a-hundred-years financial crisis, in the words of a chastened Alan Greenspan testifying before Congress in the aftermath of the financial crisis of 2008. And even Greenspan now admits that this small probability warrants precautionary regulations on the financial industry given the magnitude of the damage such a financial black swan unleashes. Since the probability of a climatic black swan and the magnitude of the damage a climatic black swan would wreak upon the planet are both far greater than in the case of a financial black swan, the rational choice is to pony up and pay our precautionary premiums to prevent climate change.
When we feel safe, it makes sense to engage in CBA. When we feel safe, we can weigh the pros and cons of doing a little more of this or that. But when we do not feel safe, what makes sense is to buy insurance. When safety is the primary concern, it is the logic of insurance we should turn to, which is quite different from the logic of CBA. In situations where safety is foremost, arguments to the effect that the expected value of our insurance policy may be negative are completely beside the point.
1. “All people” refers to any people, anywhere, who are positively or adversely affected by a decision in any way. This includes not only people alive today, but also people who have yet to be born but who will predictably be affected by environmental choices we make today.
2. If the efficiency gain from a policy is distributed in any way that prevents any people from being worse off than they were before the policy was enacted, economists call this a Pareto improvement. However, for a policy that passes the efficiency criteria to also be a Pareto improvement, all losers must actually be compensated.
3. If some compensation for less deserving constituencies is necessary to win sufficient political support to secure the policy—which by hypothesis increases efficiency and equity—it may be wise for progressives to accede to compensating losers even though they are less deserving. But this should be understood as political expediency and not confused with compensation required for equity reasons. Progressives need to understand that every penny paid in compensation in this scenario makes the economy less, not more equitable.
4. This example is taken from chapter 2 of Ackerman (2009).
5. One could argue that when our colonial ancestors chopped down the eastern forests, that was exactly what they did do. A more charitable interpretation of their behavior would be “they knew not what they did.” Perhaps this explains why the environmental movement is so often resented. It has made it harder for our generation to claim ignorance in our self-defense.
6. Environmentalists who reject attempts to quantify environmental benefits should be sure to also strongly oppose CBA for making social choices. Many do understand this and act accordingly. But to criticize and reject quantification of environmental benefits and fail to successfully oppose CBA is a recipe for environmental disaster.
7. See Ackerman (2010), Ackerman, Stanton, and Bueno (2010a), Ackerman et al. (2009a), and DeCanio (2003). These authors demonstrate that behind all the technical bells and whistles, what drives results in mainstream economic climate models are highly questionable assumptions about a few key parameters. In effect, they argue that the MSB curve actually crosses the MSC curve in Figure 2.3 significantly to the left of A(0), meaning that the benefits of averting even moderate climate change outweigh the costs if benefits and costs are properly measured.
8. Financial deregulation amounts to ignoring black swans in the financial sector of the economy. As the world discovered to its shock and dismay in the fall of 2008, while black swans may not appear often, eventually one will show up, and if old insurance policies like the Glass-Steagle Act have been canceled, the consequences can be devastating. See Hahnel (2009a) and Ackerman (2010a).
9. Ironically, as Ackerman et al. (2009b) and Ackerman, Stanton, and Bueno (2010b) demonstrate, this is not the case. When reasonable figures for a few key parameters are chosen, mainstream economic climate models indicate that the benefits of aggressive mitigation to avoid even mild climate change outweigh the costs.