6
Firing on M&A
“Certainly there are lots of things in life that money won’t buy, but it’s very funny—Have you ever tried to buy them without money?”
Ogden Nash, “The Terrible People”
• The average large company gets 31 percent of its revenue growth from M&A
• More than 50 percent of acquirers are rewarded in the long term even after paying a premium to the seller
• M&A needs to be matched by judicious and timely divestments, especially of businesses showing early signs of demise
• Companies can learn a lot from private-equity firms, which now account for almost 30 percent of buy-outs
• The real question isn’t whether M&A is good or bad, but whether you are good at M&A
IN PART I, we showed that M&A plays a crucial role in the growth of large companies. Judging by the volume of M&A activity out there, we might conclude that M&A is high on most executives’ agendas. There are obviously a lot of CEOs who believe that M&A can create value.
Yet conventional wisdom would have it otherwise. Academics and management consultants have long been skeptical about M&A. Studies suggest that most mergers and acquisitions destroy value; some cite failure rates as high as 70 or 80 percent. Of course, we all know cases that have ended in disaster. Yet despite the studies and the anecdotal evidence, many CEOs continue to pursue M&A. So what do they know that academics and consultants don’t?
Studying the studies
To understand why many CEOs take a different point of view, it helps to look at the studies themselves. Most studies don’t really tell us whether M&A creates value. Admittedly, it’s a difficult question to answer. The studies that stand up to the closest academic scrutiny measure “announcement effects”: statistically significant stock-price moves in a narrow trading window around the time of a deal announcement (say, the five days immediately before the announcement and the five days after it). The idea is that the deal is probably the most important fact on investors’ minds during this period, so that any stock-price fluctuations are likely to be influenced by their reactions to it.
There’s a problem with this approach, however. The only information that investors have to go on when a deal is announced concerns price and the identity and nature of the participants. Important though these factors are, they are far from the whole story. The most important factor, the outcome of the transaction, can’t be known in the announcement window; it will depend on the integration and performance of the businesses involved, something that may be impossible to judge until years later.
But let’s accept the method for the moment and study what happens in the announcement window, as the market isn’t completely wrong. Let’s look at how a typical analysis is carried out. The basic idea is to examine a population of announced deals and to calculate stock-price reactions to each deal during the announcement window. Any moves that are small (within one standard deviation) are deemed insignificant and excluded from the results as “noise” within daily trading. The remaining group, the deals where statistically significant price moves have occurred within the window, are then compared to establish the nature of the announcement effects.
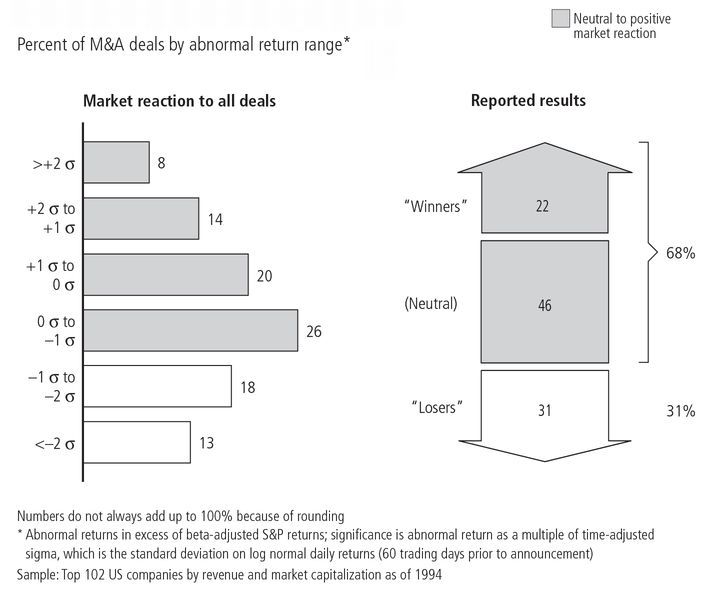
Be warned: you need to take these calculations with a pinch of salt. To see why, let’s take a look at the market reaction to the M&A deals in
Figure 6.1.
1 Look at the data one way, as we’ve described in the previous paragraph, and you end up with a 58 percent failure rate. In other words, if we exclude the 46 percent of “neutral” reactions that weren’t statistically significant and take the 53 percent that were, 31 percent of these (equivalent to 58 percent of the whole sample) had negative reactions, and only 22 percent (42 percent of the whole sample) had positive ones.
However, if you look at the deals a different way and factor the “neutral” reactions back in, the 58 percent failure rate dwindles to just 31 percent for the sample as a whole. In other words, almost 70 percent of the deals analyzed were viewed either neutrally or positively by the market, and not negatively. This example illustrates how opposite conclusions can be drawn from the same data.
Fig 6.1 Same data, different interpretations
Percent of M&A deals by abnormal return range*
If you then extend the window by a year and look at the stock prices of the same population of companies (a step that doesn’t pass muster with academics, since it introduces noise from other sources into the stock price), an interesting result emerges. Among those classified as “winners” according to stock-price movements five days either side of the announcement, 39 percent had lower stock prices a year later, whereas 52 percent of the “losers” had higher stock prices.
Put all this together and what it means is that once you take into account neutral reactions, the chance of a statistically significant negative reaction is only about 30 percent. Moreover, if you fast-forward, the chance of a positive outcome is almost as high as that of a negative outcome in the long term.
While there is no shortage of M&A failures, it seems likely that the risks of M&A have been overestimated somewhere, somehow.
Leaders do more M&A than you realize
Our growth decomposition database shows that the average large company gets nearly a third of its growth—3.1 percentage points a year—from M&A.
2 For a $35 billion company, that’s more than $1 billion in acquired revenue each year. Note that this contribution to growth is
net M&A, so it also takes into account divestments carried out within the time period.
Moreover, a review of the growth strategies pursued by large companies suggests that aggressive acquirers have been at least as successful as companies that grow organically. We divided our sample of 100 US companies into four groups according to the percentage of their market capitalization that derived from acquisitions: up to 30 percent (primarily organic growers), 30 to 70 percent and 70 to 150 percent (moderate acquirers), and more than 150 percent (primarily acquisitive growers). Then we took each of these four groups and analyzed how many of the companies within it qualified as “positively rewarded” in terms of outperforming their peers in TRS over the period measured (
Figure 6.2). We found that the proportion of primarily acquisitive growers that were positively rewarded (42 percent) was almost as high as the proportion of primarily organic growers (49 percent), while the two groups of moderate acquirers scored a little better, at 50 and 60 percent.
One key difference between acquirers that were positively rewarded and those that were not was the ability to change operating performance. In a sample of ten companies, operating margins rose for all the positively rewarded acquirers during the period, and fell for four out of five of the negatively rewarded group.
Fig 6.2 Are aggressive acquirers rewarded?
Percent of positively rewarded companies* among aggressive acquirers, moderate acquirers, and primarily organic growers†
Source: Compustat; McKinsey analysis
It’s clear, then, that M&A can succeed: on average, just over half of companies are rewarded in the longer term. Not only that, but they succeed after paying a significant premium to the seller. This suggests that over time the stock markets learn which companies make good acquisitions and reward them accordingly.
So the question becomes one of confidence and capability. How well do you think you do M&A? Let’s see what we can learn from successful growers.
How growth companies use M&A
Saying that M&A can be successful and that acquisitive companies are frequently rewarded doesn’t tell us how companies use it to grow. We are often asked whether companies should favor large deals or small ones. We believe that both have their role: large deals mainly in industry consolidations and divestitures and small in platform building. As we see in chapter 8, the right M&A strategy for your company will depend on your growth direction.
Our colleague and co-author of The Alchemy of Growth, Steve Coley, analyzed the role that acquisitions play in supporting growth strategies. He identified three broad strategies used by successful growers during the 1990s: platform building (expanding scope and creating a significant new business segment or activity), roll-up/consolidation (consolidating a fragmented industry to create a significant position in a market segment), and core growth (deepening an established position in a growing market and/or innovating in an established business).
The platform builders were particularly interesting in the way they created an advantage. Over 90 percent of them used acquisitions in support of their growth strategies, and 75 percent used them to a considerable extent (more than three acquisitions a year). These companies typically patched together multiple small deals to build their growth platforms, assembling basic capabilities and then going for scale. The average new platform builder made 65 deals over a ten-year period, 58 of which were small (less than 1 percent of the acquirer’s market cap). By contrast, Coley’s broader sample of high-growth but low-TRS companies made just 44 deals on average, 34 of them small.
In creating an advantage, successful platform builders typically begin with small acquisitions and increase the size of their commitment to the platform over time, thereby managing the risk. Some 60 percent of all initial acquisitions in these new growth staircases accounted for less than 20 percent of a company’s total investment in the new platforms. That is to say, they were entry acquisitions that were followed by other moves.
Also noteworthy was the role that large acquisitions played. The average size of the largest acquisition made by a platform builder was 17 percent of its market cap; for the high-growth low-TRS companies, it was much larger, at 40 percent.
Let’s now take a look at one company that has turned the making of acquisitions into a fine art.
The building blocks of growth
CRH’s growth is a truly remarkable story of how a company can manage granular acquisitions. Since its formation in 1970 following the merger of two Irish building materials companies, it has grown to almost €15 billion in revenue and €1.3 billion in net profit, with a market capitalization of €17 billion. It operates in some 2,600 locations across 26 countries with over 65,000 employees. Thanks to its impressive compound annual growth rate of almost 19 percent since 1970, if you had invested $100 in 1970, your stake would be worth over $50,000 today.
CRH has stuck to the same formula for a quarter of a century. It has grown primarily by acquiring small- to medium-sized businesses at a good price to build leading positions in local markets. A typical deal improves the local industry structure and leaves room for CRH to add value by injecting global know-how and capital for further investment. The company has made hundreds of acquisitions in the past 25 years, spending around €1 billion a year on them in the past five years alone.
The business is operated through largely autonomous local business units that match the granularity of the market. These units are clustered in broad product groups in key markets. This represents the right level of granularity for CRH for two reasons. First, the construction industry is one where transport costs are high and customers and tradespeople are local, so it makes sense for business units to be local too.
Second, most of the acquisition opportunities targeted by CRH are also local businesses run by owner-entrepreneurs. In most cases, CRH managers pursue a patient courtship with these owners, knowing that at some point they will be keen to cash out or pass the business to the next generation. CRH offers them a unique proposition: join the CRH federation, pocket the cash, and continue to run the business. Since price is only one part of the value proposition, the company leaves room for the acquirer to capture value from the deal. It also taps into a unique talent pipeline of proven entrepreneurs, many of whom stay with CRH and move into more senior roles.
CRH’s decentralized structure is fundamental to its M&A process. The deal pipelines are long—up to ten years—and depend on local relationships in a way that few M&A departments could match. Moreover, a typical acquisition is so small that it wouldn’t even register on the radar screen of most centralized M&A teams. By combining local managers with a team of seasoned deal makers in each region, CRH has devised a winning formula. Its deal pipeline is extensive, stretching not only into the small local markets where the company already operates but also into adjacent markets where it might choose to operate in the future.
Not every deal that CRH does is small, though. The regional managers in each product group also keep a look-out for larger deals. They have 15 regional development teams reporting to them, all staffed with experienced deal makers who execute the transactions. This combination gives CRH a unique portfolio advantage in attracting and executing deals in the building materials industry.
In 2003, it carried out 41 deals for a total of €1.6 billion. One was the largest in its history: the purchase of Cementbouw, a leading Dutch manufacturer and distributor, for €700 million. The average size of deals, however, was less than €20 million.
Once it acquires a business, CRH expects it to follow standardized reporting procedures and to adhere to performance measures that it tailors to the market and the capital intensity of the business. It also expects dual citizenship: though local businesses are run largely autonomously, connections are made across the organization in order to share best practices and exploit the scale of a global business. It says of this arrangement:
“Experienced operational management are given a high degree of individual responsibility. This local autonomy, within Group guidelines and controls, helps accommodate national and cultural needs and capitalizes on local market knowledge. The Group’s size and structure is leveraged to drive margin improvement and earnings growth. Product-based best practice teams promote performance improvement through the sharing of experience, technologies and ideas.”
3CRH’s ability to grow its business deal by deal at a local level while exploiting both traditional scale benefits and unique portfolio advantages has created one of the most remarkable and consistent growth stories of recent times.
Don’t forget divestment
M&A isn’t just about acquisitions, of course. In
Good to Great, Jim Collins argues that successful leaders need to have a “stop doing” list as well as a “to do” list.
4 Divestment is the “stop doing” aspect of growth improvement. And just as executives tend to focus more on their “to do” lists than on their “stop doing” lists, divestment is often overlooked as a way to create value.
Let’s look at an example. In 1994, ITT Industries was a diversified conglomerate with holdings ranging from hotels to defense electronics. It decided to concentrate on just two segments that had growth potential and were aligned with its capabilities: defense electronics and fluid technologies (pumps, mixers, and valves). It spun off the rest of its portfolio, creating substantial value for shareholders. ITT now had a strong operational focus in segments with favorable growth conditions. In essence, it had shrunk to grow (
Figure 6.3).
ITT didn’t qualify as a growth giant by our criteria: by 2003, its revenues had reached only 70 percent of their 1994 level. However, the company did increase its annual TRS by 18 percent during the portfolio transition, and the remaining businesses are growing rapidly, by an average of 18 percent over the past three years. To sum up ITT’s performance over the course of ten years, we could say that it made a strategic decision to exit businesses with relatively low growth potential in order to position its portfolio for higher growth during the next cycle.
Revenue by segment, 1994-2006, percent
Source: Annual reports; McKinsey analysis
Not many companies use divestment as part of their growth strategy; indeed, executives should probably do much more of it than they do. During the 1990s, nearly 60 percent of the largest US companies completed no more than two divestments exceeding $100 million
5—numbers that contrast sharply with those for M&A.
So why are divestments so rare? For one thing, they are difficult: those involved in the decision often face the loss of their own jobs; layoffs and worker buy-outs incur real costs; the separation of a division often leaves behind an overhead burden. Another reason lies in the psychological biases that affect decision making: they cause companies to ignore warning signals, to avoid adjusting goals to reflect changing circumstances, and to continue to invest beyond the opportunity for return.
6
Not only do companies do relatively little divestment, but when they do, they tend to wait too long. When we analyzed the challenged companies from the Introduction that decided to sell, we found that early sellers fared better than late sellers. Another analysis suggests that exit decisions are most often taken at the troughs of business cycles—not the ideal time to sell, as prices are likely to be at their lowest.
7 All too often, divestment decisions are made during a fire sale or shutdown, or under the pressure of persistent long-term underperformance and consequent scrutiny from investors.
8 Understanding this—and putting in mechanisms to compensate for it—is critical to making exit decisions well.
9
Balancing acquisitions and divestments
Acquisition and divestment are the two key levers for shaping a corporation’s business portfolio over the short to medium term. As always, timing is critical; not just in the narrow sense of when to pursue a particular transaction, but in terms of how to tailor portfolio activity to the stage of a corporation’s life cycle.
When we analyzed moderately diversified companies,
10 we identified four characteristics associated with managing a corporation’s portfolio successfully:
• A proactive approach to monitoring the company’s current and emerging internal capabilities and matching them with external changes in technology, regulation, and consumer behavior that might open up opportunities in related industries or make use of the company’s skills.
• The rapid divestment of businesses that show early signs of possible failure.
• The prompt “liberation” of successful new businesses after the opportunities for internal synergies have been realized.
• The active and continuous trading of business portfolios.
Companies with focused, mature business portfolios are logical candidates for acquisition-based diversification. A critical first step is to make a realistic and candid assessment of your capabilities. More diversified companies with low expectations of value creation would benefit from focusing their portfolios. Diversified companies, even those capable of generating high growth and commanding high investor expectations, should be aware of the maturation trajectories of their business units and think about when it makes sense to divest them, rather than waiting until their value begins to decline and they become harder to sell.
The active and balanced trading of assets is important. One study showed that companies that manage their corporate portfolios actively (those in the top third of total M&A activity) create 30 percent more value over the long term than the more passive portfolio managers do. And for mature companies, strategies that involve both acquisitions and divestments outperform those that focus on one or the other.
11
Although divestment detracts from growth in the short term, it’s interesting to look at why some moderately diversified companies liberate businesses early. In 2001, BellSouth and SBC placed their wireless assets in a joint venture that became Cingular Wireless. With their complementary service footprints, the two companies established a national wireless brand and went on to acquire AT&T Wireless in 2004, thereby creating the largest wireless operator in the US. BellSouth’s chairman and CEO, Duane Ackerman, explained the logic of this acquisition by pointing to the impact it had on his company’s revenue growth rate: “We have the highest exposure to the highest growth segment in the industry.” By liberating its captive wireless properties, BellSouth placed them in what became a much stronger strategic position.
Lessons from private-equity firms
The extreme case in balancing acquisitions and divestment is exemplified in the practices of private-equity firms. In recent years, private equity has become much more important: almost 30 percent of buy-outs (the A of M&A) now go to private-equity companies. Whether they will continue on this roll is not the issue. What concerns us here is their distinctive approach to M&A: they sell almost as quickly as they buy, which gives them a unique set of advantages. We believe there is much that corporations can learn from this approach.
Long-term (not incremental) focus
Managers often complain about the market’s relentless pressure on improving earnings quarter by quarter without fail. They have a point: if you take historical data for margins, revenue cash flows, or any other measure of performance you care to examine, there is hardly any performance pattern that is consistent quarter after quarter. In fact, there is barely any difference between volatile patterns and more stable ones in terms of TRS, as
Figure 6.4 shows.
One reason why managers are so nervous about quarter-by-quarter performance is that companies that issue quarterly earnings guidance find markets swift to punish them if they miss their pre-announced quarterly targets. They issue the guidance despite this risk because they believe that the increased transparency will reduce the volatility of their stock price and/or increase their earnings multiple. However, a recent study calls this view into question. It looked at 4,000 publicly traded companies from 1994 to 2004 and found no difference in valuation multiples or volatility between companies in the same industry that did and didn’t issue quarterly guidance.
12Fig 6.4 Volatility in earnings growth barely affects TRS
Percent
Source: Compustat; SDC; Bloomberg; McKinsey analysis
Unlike the wider market, private-equity firms tend to act on a time frame that is measured in years rather than quarters. Henry Kravis of private-equity firm KKR observed that:
“The trouble with corporate America today is that everything is thought of in quarters. Analysts push [companies]: ‘What are you going to earn this quarter?’ [Whereas] we say to the management of companies, ‘You are here today. Where do you want to be five years from now, and how are you going to get there?’ It may very well mean taking a step backwards. But believe me, in five years, we are going to have a company that is much more productive, efficient, and competitive.”
13
Granular investment insight
The advantages enjoyed by private-equity firms start from the way they gather the information they need for M&A. Conventional wisdom has it that markets are perfect and that all available information is traded upon, yet in reality the texture of the market is far more granular than the information available in the wider market. Though the market is quick to act on information released in a company’s quarterly and annual updates, these updates can never do justice to the detail and complexity of the company’s performance at sub-industry and category levels. Moreover, updates never look ahead for more than a couple of years, whereas the company itself will often plan and invest on a much longer time horizon.
A private-equity firm is not restricted to the information provided to the market. Because it has access to data rooms and management interviews when conducting due diligence, it is able to obtain information that is far more granular than that available to public-company investors.
As we explain in chapter 13, there are ways for large companies to build “insight engines” similar to those used by private-equity firms to drive their information advantage.
Attention to the assets
Because investment insight is so important, the amount of attention you give to an asset matters a lot, particularly when you are trying to understand how it performs at a granular level. Private capital, including family capital, often has an advantage over other owners in the time and attention it gives to its assets.
A typical private-equity partner devotes most of his or her time to purchased assets, and the rest to buying additional ones. Compare this with the practices of a typical board director and it looks like an awful lot of time, especially since the average private-equity partner has no more assets to look after than the average director, who may attend only six to ten board meetings a year. In addition, private capital usually draws on extensive analytical and other kinds of support.
High incentives
The scale of the incentives provided by private-equity firms often gives them another advantage over the corporate world. Consider VNU (now Nielsen), a mid-sized market-research company originating from Europe but operating mainly in the US. Partly because of the differences between US and European business cultures, incentives had always been an issue. But when a private-equity consortium bought VNU and appointed David Calhoun, a former top executive at GE, as CEO, it awarded him an incentive package worth hundreds of millions of dollars. This introduced a completely different culture into the company in terms of both executive selection and incentives.
We’ve found that private-equity firms are now regularly outpacing corporations in the incentive structures they offer, giving them a clear edge in attracting and motivating talent.
Both M&A and divestment are important tools for shaping the portfolio to facilitate more sustainable growth. There is evidence that active and balanced M&A strategies create value. Yet surprisingly few companies make full use of divestment.
Private-equity firms throw down a gauntlet for corporations: they have a highly aggressive, highly diversified model of both acquisition and divestment, and yet they still produce a decent return after paying substantial premiums. The success of their ventures suggests that corporations could create a lot more value through M&A than they might imagine.
We will return to the M&A theme in chapter 13, and describe in greater detail how some companies build M&A engines to pursue a large number of transactions.
NOTES
1 The data derives from an analysis we made of the top 75 US companies by market cap and the top 75 by revenue as of 1994. After overlaps were eliminated, 102 companies remained.
3 CRH annual report 2003, p. 1.
4 J. Collins,
Good to Great: Why some companies make the leap . . . and others don’t (Harpe
rCollins, New York, 2001).
5 This point is based on an analysis of the 200 largest US companies (by market capitalization) in 1990 that still existed in 2000.
6 J. Horn, D. Lovallo, and P. Viguerie, “Learning to let go,”
The McKinsey Quarterly, 2006, number 2, pp. 65-6.
7 R. E. Caves, “Industrial organizations and new findings on the turnover and mobility of firms,”
Journal of Economic Literature, 1998, volume 36, number 4, pp. 1947-82.
8 N. W. C. Harper and S. P. Viguerie, “Are you too focused?”
The McKinsey Quarterly, August 2002, special edition,
Risk and Resilience, pp. 29-37.
9 J. Horn, D. Lovallo, and P. Viguerie, “Learning to let go,”
The McKinsey Quarterly, 2006, number 2, pp. 65-6.
10 N. W. C. Harper and S. P. Viguerie, “Are you too focused?”
The McKinsey Quarterly, August 2002, special edition,
Risk and Resilience, pp. 29-37.
11 J. P. Brandimarte, W. C. Fallon, and R. S. McNish, “Trading the corporate portfolio,”
McKinsey on Finance, number 2, autumn 2001, pp. 1-5.
12 P. Hsieh, T. Koller, and S. R. Rajan, “The misguided practice of earnings guidance,”
McKinsey on Finance, 2006, pp. 1-5. The article also examined what happens to companies that decide to begin issuing guidance. It compared the volatility and multiples in the year that guidance starts to those in the previous year, and then compared any observed changes to those observed in the rest of the industry. Again, it found no benefit to the companies that issued quarterly guidance.
13 Interview with American Academy of Achievement, 12 February 1991.