CHAPTER 1
Introduction
One thing that we’ve really broadly started to appreciate more is that climate is not an environmental issue. Climate change is a systemic and fundamental issue about the way our economics work and the way we get our energy.
—Robert Bradley, World Resources Institute
Environmental concerns in general, and issues regarding climate change in particular, are moving from the realm of corporate Environment, Health, and Safety (EH&S) personnel, into that of corporate financial strategy, which involves chief executive officers (CEOs) and chief financial officers (CFOs) as well as boards of directors. The pace of this transformation has left few unaffected, from companies and cities managing their greenhouse gas emissions to equity and debt analysts paying close attention to climate liabilities along with physical concerns regarding the potential impacts of climate change patterns.
Carbon finance explores the financial implications of living in a carbon-constrained world—a world in which emissions of carbon dioxide and other greenhouse gases1 carry a price. Thus, carbon finance:
- Represents one specific dimension of environmental finance.
- Explores the financial risks and opportunities associated with a carbon-constrained society.
- Anticipates the availability and use of market-based instruments that are capable of transferring environmental risk and achieving environmental objectives.
This conveys a more inclusive meaning than the one adopted by the World Bank:
Carbon finance is the term applied to the resources provided to a project to purchase greenhouse gas emissions reductions. (World Bank 2006)
Our broader definition is consistent with the usage adopted by the journal Carbon Finance, which covers “market solutions to climate change.”
A variety of drivers influence the discipline of carbon finance, which in turn takes many forms (Figure 1.1). It is shaped by national and international regulations, which require producers and consumers to emit fewer greenhouse gases (GHGs), or to pay the price. Some of these regulations had their origin in an earlier piece of legislation designed to curb air pollution, conserve energy, and promote renewable energy. Others have been created by international agreements such as the Kyoto Protocol and the European Union Emission Trading Scheme.
FIGURE 1.1 Carbon Finance: Its drivers and markets
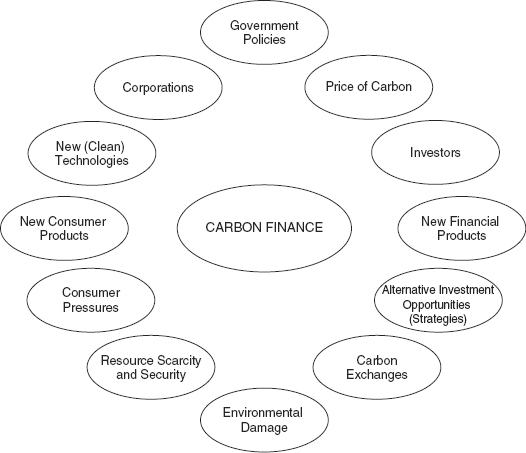
Putting a price on greenhouse gas emissions will have a significant effect on country and company bottom lines. At the same time, government climate policies can do much to change behavior patterns and encourage markets to mitigate these issues. Thus, we define carbon finance broadly in terms of the financial nature of these impacts and examine actions that have been taken, and markets that have developed, to reduce them.
While other environmental issues, such as contaminated land and acid rain are either sector or regionally specific, climate risk is a global phenomenon that has the potential to affect all companies, all sectors, and whole economies. Thus, climate change has become one of the most financially significant environmental concerns facing investors. New financial players have emerged beyond the traditional public markets that offer alternative private investment opportunities within the carbon economy. In addition, the establishment of a price for carbon has spawned the newest of trading activities, as carbon exchanges are established and utilities and energy companies join brokers, traders, hedge funds, and venture capitalists in this new field of carbon finance. (See Chapter 9.)
Although the issues surrounding climate change are perceived as being fairly new, a brief reflection on the history of research in the area reveals studies in the nineteenth century that involved the concept of global warming. Early works by the French mathematician and physicist Joseph Fourier (1768–1830) explored the field of terrestrial and radiant heat, and concluded that the atmosphere could, indeed, trap heat. Fourier suggested that the atmosphere warms the earth’s surface not only by letting through high-energy solar heat, but also by trapping part of the longer-wave radiation that bounces back from its surface. Fourier’s work provided the impetus for the Swedish scientist Svante Arrhenius (1859–1927) who recognized the importance of atmospheric CO2 content and the warming of the earth’s surface. He is credited with the idea that increases in the volume of carbon dioxide in the atmosphere, due to the burning of fossil fuels in factories during the Industrial Revolution, was changing the composition of the atmosphere, and could heat the climate. He was the first to publish a scientific article that predicted a temperature increase of 1.5 to 5.5°C from doubling CO2 levels—no mean feat considering the absence of computers in the late 1800s. Current predictions are in the same temperature range.
Since the Industrial Revolution, levels of carbon dioxide in the atmosphere have grown by more than 30 percent as a result of burning fossil fuels, land use change, and other man-made emissions. This human behavior has amplified the natural “greenhouse effect,” leading to an average surface temperature increase of 0.6°C during the twentieth century. The distinguished scientists Hans Suess and Roger Revelle revealed that changes were under way in the earth’s atmosphere, with notable increases in CO2 levels. Following confirmation of these findings by David Keeling2 in Hawaii in 1957 (Keeling and Whorf 2001), the United States National Academy of Sciences published the following warning in 1979:
The current trajectory (of CO2 emission levels) could produce 6°C warming by 2150 . . . CO2 may change the world climate. (Charney 1979)
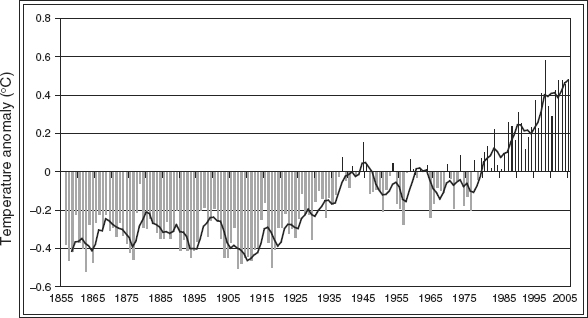
Since that time, the Mauna Loa Observatory measurements have revealed a steady increase in CO2 concentrations (Firor 1990). Fifty percent of the increase in emissions has been released in the 30-year period from 1974 to 2004, with the largest increase in CO2 emissions occurring in 2004, in both absolute and relative terms (Baumert, Herzog, and Pershing 2005). From a temperature perspective, average global temperatures have been the warmest since reliable records have been kept over the last 125 years, with 10 of the warmest years on record all having occurred since 1990 (Figure 1.2). The summer of 2005 was recorded as the hottest ever observed in the Northern Hemisphere (Silver and Dlugolecki 2006).
FIGURE 1.2 Global temperature anomalies
Source: Climatic Research Unit, University of East Anglia www.cru.uea.ac.uk/cru/info/warming.
In the current period of concern regarding climate change, activity has taken place at both scientific and political levels (Table 1.1). The following section summarizes the progress made in these two areas.
TABLE 1.1 Major Milestones in the International Climate Change Regime
Source: Baumert, K., T. Herzog, and J. Pershing. 2005. Navigating the Numbers: Greenhouse Gas Data and International Climate Policy. World Resource Institute, available at www.wri.org.
| Date | Activity |
| 1988 | UNEP and the World Meteorological Organization (WMO) establish the Intergovernmental Panel on Climate Change (IPCC) |
| 1992 | The UN Framework Convention on Climate Change (UNFCCC) is agreed to at the Rio Earth Summit |
| 1994 | The UNFCCC enters into force |
| 1995 | The IPCC Second Assessment Report concludes that there is evidence suggesting a discernible human influence on the global climate |
| 1997 | Adoption of the Kyoto Protocol to the UN Climate Convention |
| 2001 | The IPCC finds stronger connection between human activities and the global climate system |
| 2004 | Russia ratifies the Kyoto Protocol |
| 2005 | Kyoto Protocol enters into effect |
| 2005 | First Meeting of the Parties (MOP) of the Kyoto Protocol takes place in Montreal, Canada |
The Scientific Context of Climate Change
In the scientific domain, the Intergovernmental Panel on Climate Change (IPCC) was established by the United Nations Environment Programme (UNEP) and the World Meteorological Organization (WMO) in 1988 to examine the scientific and policy implications of global warming. Their research projected that, if left unchecked, atmospheric warming would increase by 1.4°C to 5.8°C by the end of the twenty-first century, leading to regional and global changes in climate and climate-related parameters such as temperature, precipitation, soil moisture, and sea level (IPCC 2001). These changes have the potential to disrupt economies and affect the health of large populations due to weather extremes and shifting disease vectors. Changes in physical climate systems, such as the natural oscillations of the ocean currents, can also occur, which in turn cause environmental disturbances through melting at the poles and societal disruptions in remote Pacific regions.
On the basis of the IPCC results, an increase in temperature of 2°C above preindustrial levels is thought to be the maximum “safe” level that can be estimated.3 To stabilize atmospheric CO2 concentrations at this level, worldwide emissions would need to peak around 2015 and subsequently decline by 40 percent to 45 percent by 2050, compared to 1990 levels. However, since both world populations and economies are expected to grow during the twenty-first century, substantial changes in energy use and advances in efficiency, conservation, and alternative energy sources, as well as technological innovations, will be required to reduce emissions. It is possible that major impacts on ecosystems and water resources could occur even with a temperature increase of between 1°C and 2°C. The risk of negative impacts on global food production and water supply is anticipated to increase significantly once global temperature increase exceeds 2°C (CEC 2005).
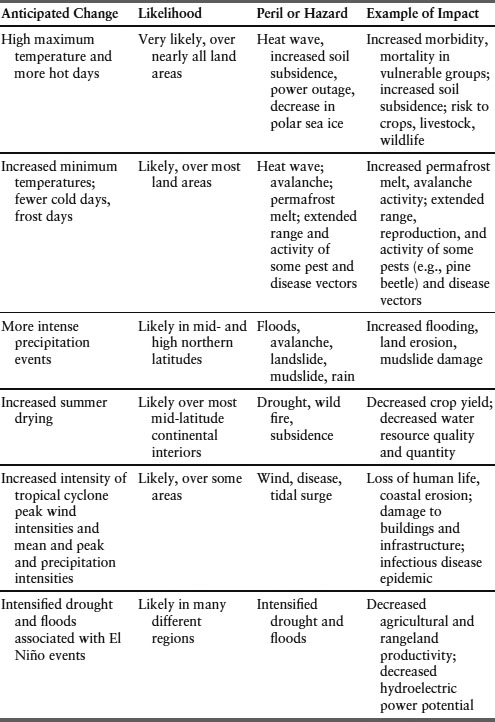
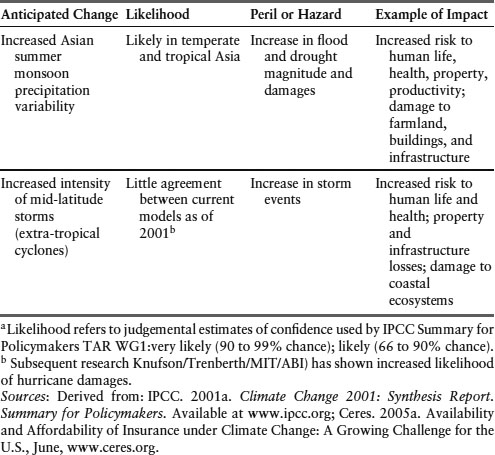
IPCC studies identified potentially serious changes, including increases in the frequency of extreme high-temperature events, floods, and droughts in some regions (Table 1.2). Indirect impacts identified include changes in the distribution and activity of parasites, altered food productivity, as well as the likely disturbance of complex ecological systems, such as tropical forests (Stripple 2002). IPCC published its First Assessment in 1990, and has updated its documents in 1996 and 2001. Drafts are now circulating of the fourth assessment, which is due in 2007.
TABLE 1.2 Anticipated Impacts from Extreme Weather Events by the End of the Twenty-first Century
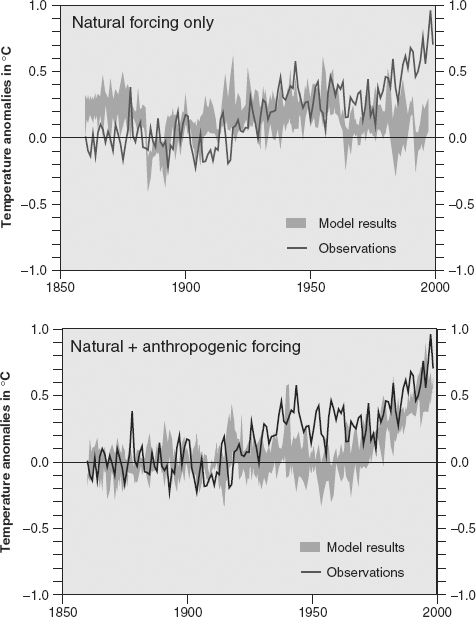
Although there remain some Kyoto detractors who are skeptical of the science, scope, and causes of climate change, there is a growing consensus as to the validity of the fact that natural climate fluctuations have been augmented by anthropogenic activities. In 2001 the IPCC compared the average global surface temperature, as measured since 1860 (dark line) to computer simulations (Figure 1.3) predicting average temperatures that both exclude (natural forcing only) and include (natural + anthropogenic forcing) the effects of emissions caused by human activity. The IPCC research suggests that the actual temperature correlates with the scenario where human emissions are a factor (Mercer Investment Consulting 2005).
FIGURE 1.3 Simulations of the earth’s temperature variations
Source: IPCC 2001, Third Assessment Review Summary for Policymakers, Intergovernmental Panel on Climate Change Third Assessment Report (TAR), Working Group (WG) 1, at www.ipcc.org.
In 2006, even the United States withdrew its claim that a discrepancy existed in the validity of climate modeling and acknowledged evidence of the human impact on global temperature increases (U.S. Climate Change Science Program 2006). The same year, scientists were joined by the eminent economist, Sir Nicholas Stern, in the debate on global climate change. In his report, Stern (2006) warned that global climate change will cost world economies as much as $7 trillion in lost output and could create as many as 200 million environmental refugees unless drastic action is taken by governments worldwide. Sir Nicholas writes:
Our actions over the coming few decades could create risks of major disruption and social activity later in this century and in the next, on a scale similar to those associated with the great wars and the economic depression of the first half of the 20th century.
Stern and some scientists suggest that, not only are human-induced changes taking place in our climate, but that the IPPC used language that was too cautious. They argue that today’s computer climate models fail to include recent knowledge on the increased risk of dramatic climate change and feedback loops, thus understating the magnitude of warming dramatically, and producing forecasts of future warming that are far too low (Economist 2006e; Stern 2006). Recent temperature and weather developments support their more dire predictions.
The Political Context of Climate Change
At the political level, diverse countries of the world met in 1992 under the auspices of the United Nations at the “Earth Summit” in Rio de Janiero, and agreed on the Framework Convention on Climate Change (UNFCCC). The Convention was signed in 1992 and entered into force in 1994. This agreement has nearly universal membership, with 189 countries supporting the voluntary commitments to address climate change, including the United States and all major GHG-emitting countries. The key objectives of the Convention are to reduce emissions from economic activity and to lessen the impact of unavoidable climatic changes. Strategies under the UNFCCC are known as mitigation policies and adaptation measures. Mitigation policies have drawn the most attention, because they affect the global economy and often feature unfamiliar regulations. Adaptation, however, is directed at vulnerable activities, and may only represent an extension of current measures (Allianz and WWF 2005).
The Convention commitments, however, were voluntary and did little to establish firm governmental targets. Recognizing this shortcoming as well as the firmer scientific evidence on human contributions to global warming, the third UNFCCC Conference of the Parties (COP3) met in Kyoto in 1997 and produced the Kyoto Protocol, under which 39 of the industrialized “Annex 1” countries4 agreed to mandatory reductions of GHG emissions, totaling 5.2 percent, from 1990 levels by the end of the First Commitment Period of 2008 to 2012.5 Other countries, such as India and China, have joined the Protocol, but without binding targets (Baumert, Herzog, and Pershing 2005).
In order to be legally binding, the Protocol required ratification by at least 55 countries that account for 55 percent of developed countries emissions. Although the United States and Australia opted out of the agreement, Russia’s decision to ratify the Protocol finally brought it into force in February 2005. Pledges of targets are scheduled to come into effect in the First Commitment Period of 2008 to 2012. Negotiations for the second period started in late 2005 at COP11/MOP16 in Montreal, Canada.
The Protocol does not prescribe how emission reductions should be met. It does, however, propose three flexible mechanisms that are designed to help Annex 1 countries meet their emission reduction obligations: namely emissions trading schemes (ETS), Joint Implementation (JI), and the Clean Development Mechanism (CDM).
Emissions trading scheme (ETS) uses a “cap-and-trade” mechanism, similar to the U.S. Acid Rain Program that was designed to control SO2 and NOx from fossil fuel–burning power plants (see Chapter 6). Under the ETS, emissions caps are set for each country, followed by GHG caps for various companies within those different jurisdictions. Although the protocol is an agreement between national governments, industry is expected to deliver the majority of emissions savings.
Within an international ETS, the “cap” mechanism ensures that environmental objectives will be met. The “trade” implies that the objective is achieved at the lowest possible cost since entities that have been assigned caps may trade credits for any emission reductions they achieve beyond their targeted goals. An ETS allows developed countries to trade part of their emissions budget, known as assigned amount units (AAUs).
Joint Implementation (JI) mechanisms are project-based instruments, whereby an Annex 1 country can invest in a project in another industrialized nation or a country with economies in transition, and receive emission reduction units (ERUs) for its achievement in emissions reductions.
The Clean Development Mechanism (CDM) allows industrialized countries to invest in a project in a developing country and obtains Certified Emissions Reductions credits (CERs) for having reduced emissions and promoted sustainability. CDM projects are intended to be, inter alia, a vehicle for investment and technology transfer into developing countries.
The future of a carbon-constrained society presents a significant challenge for industries and investors alike. Companies will be exposed to different levels of climate risk, depending on the sector and geographic location of their operations. Investors must, then, be aware of the competitive dynamics that are being created by varying climate policies and physical manifestations of climate change.
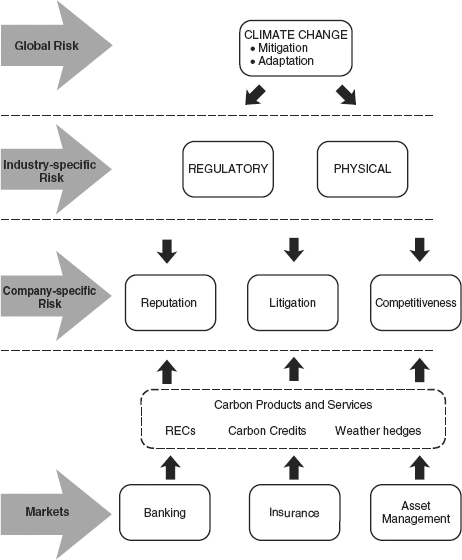
There are three ways that climate change can have an impact on institutions, each of which carries its own economic implications and exposure to carbon finance (see Figure 1.4). Two of these, regulatory and physical risks, affect all companies within a sector, while business risks apply to decisions made at the company level.
FIGURE 1.4 Climate change, industry, and the financial markets
Regulatory Risk
Within the discipline of carbon finance, regulatory risk is viewed in terms of a corporation’s record of compliance with respect to any carbon policies that are likely to have a material effect on its financial performance. The effect is greatest on GHG-intensive sectors, such as utilities, and depends very much on the stringency of GHG policies. GHG regulations have varying competitive implications for corporations in different countries. They must be considered in analysts’ assessments of their effects on companies’ earnings, profitability, or return on capital invested. For any company, its carbon exposure can be found in three levels of the value chain:
1. Emissions from the company’s own operations.
2. Indirect emissions from the company’s supply chain, especially energy.
3. Emissions linked to the use of a company’s goods and services.
A number of companies have taken the lead in their response to climate change, through a range of actions that are referred to as carbon management. Simply put, carbon management refers to a company’s:
- Evaluation of emissions across the value chain.
- Understanding of the risks and opportunities associated with a carbon constraint.
- Establishment of priorities for action.
- Communication of these results to its stakeholders, including the investment community (Carbon Trust 2005a).
Climate policies will affect different sectors at different times and in different ways. The power sector is one of the most vulnerable to this type of risk (see Chapter 3), and is the earliest of industries to feel the impact of limiting GHG emissions. Within this sector, a company’s generating assets, installed technologies, fuel mix, and market position will shape the impact it feels from carbon constraints. Some companies will be at greater risk, because they produce power from carbon-intensive coal, while others generate power from cleaner sources, such as natural gas. Other emitters, such as transportation sector, may have either GHG emissions capped or be subject to fuel efficiency standards, or possibly both (Chapter 3). Auto manufacturers with models that are designed to meet these new climate policies, for example, are in a better competitive position than those who are concentrating on larger, carbon-intensive products.
Physical Risks
Physical risks arise from the direct impacts of climate change, such as droughts, floods, storms, and rising sea levels. Industries that are particularly exposed include agriculture, fisheries, forestry, health care, tourism, water, real estate, and insurance. Similar weather developments can also have negative consequences for carbon-regulated industries such as electric power, oil, and gas producers (see Chapter 4). In addition to storm and flood damage to property, climate change and variability can have a significant impact on the wealth and well-being of different populations, depending on geographic region and levels of vulnerability. Temperature-related effects on health include both reduced winter deaths because of milder weather, and increased heat stress deaths due to hotter summers. In addition, the spread of vector-borne diseases is associated with changes in temperature and precipitation patterns (see Chapter 7).
Rising emissions and a disrupted climate are leading to a range of impacts, including more frequent heat waves, increased frequency and severity of storms, flooding, wildfires, and droughts, as well as an extension of the geographic range and season for vector-borne diseases. These changes have already manifested themselves in terms of real economic losses:
- A recent study by the Association of British Insurers concludes that rising carbon dioxide emissions could increase average annual losses from three major types of events—U.S. hurricanes, Japanese typhoons, and European windstorms7—by $27 billion a year, a two-thirds increase by the 2080s (ABI 2005).
- U.K. claims for storm and flood damages from 1998 to 2003 doubled compared with previous five years.
- In 2002, severe flooding across Europe caused $16 billion of direct losses.
- The 2003 heat wave that affected much of Europe is estimated to have caused 50,000 premature deaths and an estimated economic loss of €13.5 billion (Silver and Dlugolecki 2006).
- Insured losses due to Hurricane Katrina in 2005 are thought to be $45 billion, greater than the combined insured losses of the four hurricanes that hit the southeastern United States in 2004 (see Table 7.1).
- Infectious diseases, such as malaria, are currently the world’s leading cause of death, killing 17 million people each year and creating significant economic hardship due to lost productivity (see Chapter 7).
Business Risks
At the corporate level, business risks include legal, reputational, and competitive concerns.
Legal risks arise when litigation is brought against companies that contribute to climate change.
- In 2004, eight states and New York City filed an unprecedented lawsuit against five American power companies, demanding that they reduce their CO2 emissions.
- In 2006, the attorneys general of 12 states challenged the Environmental Protection Agency (EPA) in the U.S. Supreme Court on its refusal to regulate greenhouse gases as pollutants (Carbon Finance 2006a).
- Some lawyers believe that such cases could follow the trajectory of tobacco and asbestos litigation, saddling high-emitting companies that failed to act on GHGs, with potential massive claims for damage (Lambert 2004).
Reputational risks evolve as corporate response patterns to climate change alter the perception of brand values by customers, staff, suppliers, and investors. Companies that are viewed in a negative light with respect to carbon management in their policies, products, or processes risk a backlash from consumers and shareholders in environmentally sensitive markets. This is particularly evident in highly competitive sectors, such as the auto industry, where brand loyalty is an important attribute of company value, and the airlines, where up to 50 percent of its brand value may be at risk as greenhouse regulations are being considered (Carbon Trust 2005a; Ceres 2005b). (See Chapter 3.)
Competitive risks can change depending on a company’s response pattern to climate regulatory frameworks. Within this area, operational and market risks are exposed as carbon constraints impinge on existing assets and capital expenditures, as well as on the changing dynamics for companies’ goods and services (Henderson Global Investors 2005a). Within the investment community, consideration of carbon profiles help analysts determine the effects that GHG constraints will have on a company’s current assets, capital expenditures, and costs of inputs, thereby affecting investment valuations (Wellington and Sauer 2005).
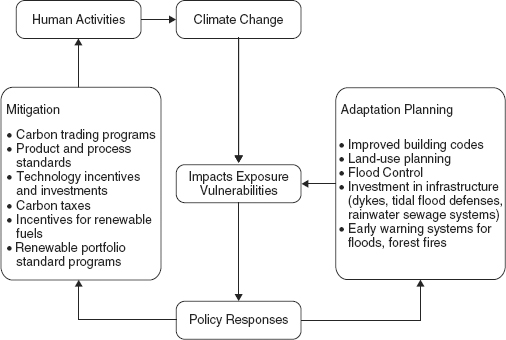
Strategies under the UNFCCC, which are designed to reduce emissions from economic activity, as well as to lessen the impact of unavoidable climate change effects, are defined as mitigation and adaptation (Figure 1.5). Mitigation has the potential to affect the global economy, while adaptation is directed at particular populations and activities.
FIGURE 1.5 Mitigation and adaptation measures in climate policies
Mitigation Policies
Governments can improve all aspects of carbon finance in a tangible way by:
- Developing clear mitigation policies.
- Encouraging the use of market mechanisms.
- Creating an environment that promotes diverse energy sources.
- Creating incentives for new and cleaner technologies.
A wide range of measures to mitigate the impacts of climate change exists for policy makers depending on regulatory frameworks that have been established within different countries. These policies have the potential to change the cost structure of some companies, while creating new markets and product opportunities for others. To date, a number of climate policies have either been instigated or considered within varying regulatory frameworks. Mitigation policies designed to reduce carbon emissions include:
A carbon tax, such as the Climate Change Levy in the United Kingdom, is designed to put a price on carbon, which increases the cost of fuels in proportion to their GHG content. This policy option creates an incentive for consumers and companies to use less energy as well as using less carbon-intensive energy. The effect, which generates an economic incentive similar to a cap-and-trade structure, is further discussed with regard to the auto industry in Chapter 3.
Product or Process GHG Standards are set by governments for certain industrial processes and products in order to reduce GHG emissions. A prime example of this policy tool is the standards that are being established by a number of countries, setting future limits on either fuel consumption or emissions of CO2 from automobiles (see Chapter 3).
Technology Incentives have been created through a variety of regulations that are designed to provide incentives for the development of cleaner technologies. The U.S. Energy Production Tax Credit represents this type of policy, whereby producers of renewable energy gain a 1.8 cents/kWh tax benefit over the more polluting forms of energy production from fossil fuels (Union of Concerned Scientists 2005; Allianz AG and WWF 2005). Other incentives, such as the solar power subsidy in California, will provide rebates to consumers and businesses that install solar panels, which convert solar energy to electricity without causing pollution (Globe and Mail 2006).
Renewable Portfolio Standards require a specified percentage of a utility’s overall generating capacity or energy sales to be derived from renewable sources, for example, solar, wind, tidal, or biomass. States such as Texas, New Jersey, and Maine in the United States have established various standards for utilities, which differ in energy source, percentages, and timing (www.energy.gov).
A carbon trading program, such as the European Union Emissions Trading Scheme (EU ETS), is structured as a cap-and-trade system, wherein caps are set on emissions, and tradable permits are allocated to key industrial sectors: energy generation, ferrous metals, minerals, as well as pulp and paper. If emissions from companies within these industries exceed their allocations, operators must either purchase permits or pay a fine. If emissions are below the cap, however, surplus permits can be sold.
Several carbon markets already exist, with the EU ETS being largest and most advanced. The European Union (EU-15) as a whole agreed to reduce its CO2 emissions by 8 percent under Kyoto. This agreement is a burden-sharing one, in which some countries (Spain, Greece, Portugal) are allowed to increase emissions, while others (France, Germany) have agreed to reduce theirs. In a bid to reduce emissions, the EU launched its Emission Trading Scheme, which came into effect in January 2005. It is the largest multicountry, multisector GHG emissions trading scheme in the world, covering over 11,000 installations in 25 countries. Trading in these markets is already active, involving companies in carbon-intensive sectors, banks, trading houses, and specialized funds, such as the World Bank Prototype Carbon Fund and the European Carbon Fund. The EU ETS offers an opportunity to gain insight into the design and implementation of a large and complex market-based program, and to assess its implications for corporate competitiveness, technological development, and efficiency opportunities. (See Chapter 6 for an analysis of the EU ETS.)
Emission trading schemes have created a new market in carbon dioxide allowances that are valued around €35 billion per year, predicted to rise to over €50 billion by the end of the decade (CEC 2005). To date, however, the true price of carbon has been hard to establish due to a number of factors (see Box 1.1).
As well as reducing CO2, climate policies have competitive and financial implications at all levels of the value chain, from energy inputs, through the production process to product use and disposal. In some sectors, consumption of goods and services create more emissions than those associated with the carbon intensity9 of the production phase. A prime example can be found in the auto industry, where the majority of an automobile’s life cycle carbon emissions come from its use, rather than from the production of raw materials for manufacturing (e.g., plastic, steel) and the vehicle assemblage (Figure 3.4). Policies that target either increased fuel efficiency or decreased gasoline consumption will alter demand patterns and create incentives for new product within the auto industry.
All of these policies have a linkage to the broader field of carbon finance. In the energy field, renewable portfolio standards are stimulating new markets in areas such as renewable resources. At the same time, the EU ETS has also created opportunities in the financial services sector, with increased demands for weather derivatives and private equity as well as corporate financial advisory services in light of the new GHG asset/liability class. Further public and private finance has been mobilized by the World Bank as its carbon investment funds channel close to $1 billion into emissions reduction projects across the developing world. In doing so, the Bank has become the world’s largest buyer of credits.
BOX 1.1 THE DIFFICULTY OF PUTTING A PRICE ON CARBON
In creating a market for carbon credits, the EU ETS has also established the basis for the price of carbon, both within Europe and beyond. Each allowance that is being traded allows the holder to emit one metric ton of CO2 (tCO2). At the launch of the EU ETS in January 2005, the price of allowances was less than €7 ($9), but by July of that year they hit a peak of nearly €30. In early 2006, prices hovered around €23 ($30) before plunging to €8. (The reasons for the sudden decrease are examined in Chapter 6.)
Large power generators provide the major demand for allowances, with the most critical driver in that industry being the relationship between the cost of coal and gas. Analysts partake in a debate over the CO2 emissions price level that would encourage the switch from coal-fired generation to generation from gas-fired combined cycle gas turbines. Some say that an allowance at €25 would trigger the change, while Citigroup predicts a price of about €60/tCO2 would be required to make coal generation less attractive than gas.
Extreme weather patterns and emissions prices are also closely linked, as increased heating requirements during a cold snap precipitates as increase in coal-fired electricity generation.
Disparities between prices in the EU ETS, which are close to $25/t, and those of CDM credits that range between $3.60 and $7.20 has also caused a certain amount of confusion in the marketplace (Nicholls 2005a). A further difference exists between the EU ETS and prices quoted in the marketplace on the Chicago Climate Exchange (CCX), where prices are quoted in the $1.70 range. Some analysts predict that the price of carbon will trend down, as emissions reductions come on the market from suppliers of allowances outside the power sector, for instance, from companies in eastern Europe.
Activities associated with the second phase of the ETS (2008–2012) also contribute to the difficulty of putting a price on carbon. In some cases, companies are back-loading the required reductions to the second part of the 2008–2012 period. Others suggest that, given the level of carbon constraint required by the ETS in the second phase, some of the demand will have to be met by JI and CDM projects, as well as allowances from Russia and Ukraine. The EU ETS may even consider the inclusion of forestry projects into the EU Emission Trading Scheme. In addition, unused allowances in the National Allocation Plans (NAPs) of new entrant reserves for the EU may become available for use, since few new power stations that would qualify for the allowances are being built.
Sources: Bettelheim 2005/2006; Carbon Finance 2005–2006; Nicholls 2005a, 2006a.
Adaptation Measures
While wealthier nations have economic resources to offset the cost of adaptation and are therefore better able to adapt to the impacts of climate change, developing countries will be affected the most, since they are the most vulnerable and have the least capacity to respond to negative effects. Extreme weather events, for example, can have enormously widely varying effects on different populations, depending on their capacity to cope. Cyclones in Bangladesh in 1970 and 1991 are estimated to have caused 300,000 and 139,000 deaths, respectively, whereas Hurricane Andrew, which struck the United States in 1992, caused 55 deaths, albeit also causing $30 billion in damages. Climate-related adaptation strategies, then, must also be considered in relation to broader regional characteristics—population growth, poverty, sanitation, health care—that also influence a population’s vulnerability and ability to adapt (WHO 2003).
To date, few climate change adaptation programs have been reported in OECD (Organisation for Economic Co-operation and Development) countries. One example of a systematic approach to adaptation, however, is the U.K. Climate Impact Programme (UKCIP), which was set up by stakeholders in 1997 and funded by the Department for Environment, Food, and Rural Affairs (DEFRA). UKCIP is designed to help different groups assess their risks of climate change and prepare for its impacts (www.ukcip.org.uk/).
In many countries the impacts of climate change have been reduced through adaptive programs such as improved building codes for the design and construction of new buildings. Land-use and urban planning programs in vulnerable areas, along with infrastructure investments in dikes, tidal flood defenses, and rainwater sewers, have also helped moderate the harm of some impacts attributed to climate change (Box 1.2). Early-warning systems for floods and forest fires can also be considered as other important aspects of adaptation.
A conference hosted by Yale University has suggested a creative function for the process of adaptation planning. Delegates at the conference were charged with analyzing the gap that exists between climate science and action in the United States, as well as examining the questionable status and lack of appeal that climate change holds within its general population. To improve the public’s perception, the delegates suggested that citizens be engaged in the process of adaptation planning, thereby first raising their awareness and understanding of the effects of climate change and, second, creating an opportunity to develop a dialogue on mitigation efforts and emissions reductions. Such a move could shift climate change from the abstract to a concrete issue, and transfer the comparison of the economic costs of climate change regulation from the status quo to the cost of inaction. Thus, the delegates supported, qualified by some reservations, a recommendation that called for increased emphasis on adaptation and preparedness that would serve as an introduction to discussions of mitigation (Abbasi 2006).
BOX 1.2 WINNIPEG, MANITOBA’S FLOOD ADAPTATION MEASURES
In 1950, the Canadian city of Winnipeg, Manitoba, experienced one of the largest spring floods in the province’s history. In response to this event, a floodway was constructed that diverts excessive spring runoff water from the swollen Red River around the city of Winnipeg. The floodway has been in operation since 1968 and has been used on over 20 occasions since that time. It is estimated to have saved the province more than $8 billion in flood damage.
In 1997, the province experienced its third worst flood on record, which stretched the capabilities of the floodway to its limit. The event forced 28,000 Manitobans from their homes and caused an estimated $400 million in damage. In the decade following this “Flood of the Century,” the provincial and federal governments implemented a number of measures to protect those outside the massive floodway, including building extra dikes, elevating roads, and improving flood forecasting. Most recently, the two levels of government have announced plans to expand the existing floodway system.
These adaptation policies have been proven effective for this Canadian province. In 2006, spring water levels rose again to the levels experienced in 1997, but the region was relatively unscathed, due to the floodway’s diverting some of the flow safely around the city while rings of dikes and elevated roads have provided protection in the rural areas.
Sources: MacAfee 2006; www.floodwayauthority.mb.ca.
From a public health perspective, improved infrastructure, such as sanitation facilities and waste water treatment systems enhance a population’s adaptive capacity. Also, government programs that either enforce adequate coverage or provide financial aid help revive an area that has experienced devastating effects of climate change (see Chapter 3) (CEC 2005).
ROLE OF THE FINANCIAL SERVICES SECTOR
Climate change has become an important factor for the financial sector in its banking, insurance, and investment activities. Challenges for the sector will appear from the different directions that have been identified earlier in this chapter: regulations that are designed to limit GHG emissions, physical changes that take place due to climate change impacts, legal challenges to be brought on by inadequate governance, reputational fallout for companies due to corporate positions on climate change, and competitive pressures in the marketplace as production costs shift and products are substituted in response to the new reality of a carbon-constrained world. Indeed, reports have been published warning of the potential exposures in all segments of the sector (see, for example, ACF 2006; Lloyd’s 2006).
Companies in the financial services sector have a dual responsibility: the first is to prepare themselves for the negative effects that climate change may have on both their clients and their own business. The second role of the financial sector is to provide products and services that will help mitigate the economic risks of a carbon-constrained society. Roles and levels of responsibility that exist within different groups of the financial services sector include:
- Trustees of institutional investors investigating the linkages between climate change and their fiduciary duty.
- Institutional investors actively engaging actively within the climate policy process.
BOX 1.3 SWISS RE PROVIDES INSURANCE FOR CDM
In mid-2006, European International Insurance, a subsidiary of the global reinsurer Swiss Re, developed an insurance product designed to assist RNK Capital, a U.S.-based private equity fund manager, to handle its Kyoto-related risk as it invests in CDM projects. The insurance policy covers some risks associated with the purchase of carbon credits. These include the failure of, or the delay in, project registration or certification/issuance of CERs related to the CDM process. The policy does not, however, cover political or country risk, nor is it triggered by any error in the Designated Operational Entity or delivery risk related to problems with the International Transaction Log.
If RNK faces a carbon credit shortfall due to CER certification or issuance problems, the policy will pay out for the expected future flows of CERs that RNK had expected to receive. The insurance product has the flexibility to pay out in kind, in cash, or a combination of the two.
Source: Carbon Finance 2006a, p. 3.
- Investment consultants integrate climate change into advice they provide institutional investors, as well as their evaluation of asset managers.
- Fund managers evaluating how climate change affects investment decision making (Mercer Investment Consulting 2005).
These challenges present new risks and opportunities for financial service companies. The sector will have to adapt internal policies, processes, products, and services, in order to meet the challenges that its clients face and to protect its own viability. At the same time, climate change will open up new opportunities for the sector. Table 1.3 outlines some of the risks and opportunities that exist for the banking, insurance, and investment management industries within the financial services sector, while Box 1.3 provides an example of a new product and approach taken by Swiss Re.
TABLE 1.3 Risks and Opportunities of Climate Change within the Financial Services Sector
Source: Derived from Allianz AG and WWF International. 2005. Climate Change & the Financial Sector: An Agenda for Action. Gland: Allianz AG Munich and WWF International.
| Class of Business | Risks | Opportunities |
| Banking | ||
| Retail banking | Direct losses due to physical risks: e.g., precipitation, drought, Policy changes, e.g., termination of subsidies for renewable energy In creased credit risks by affected clients |
Offering new climate mitigation products Microfinance for climate-friendly activities Advisory service for small renewable energy project loans |
| Corporate banking and project financing | Higher energy costs for consumers Price volatility in carbon markets Reputational risk due to investments in controversial energy projects |
Clean-tech investments |
| Insurance | ||
| Property, casualty, life, underwritings | Losses from: Weather and extreme events Business disruption coverage Impacts on human health |
More demand for alternative risk transfer New insurance products Counterparty credit for carbon trading Carbon neutral insurance coverage Carbon-delivery guarantee for CDMs Insurance for emissions trading Carbon as an insurable asset |
| Investments | ||
| Investment banking and asset management | Investments in immature technologies Additional costs due to change in weather patterns, e.g., in the utilities sector Loss of property assets |
Investing in climate change-related products Offering weather derivatives Establish Carbon Funds Trading Services in the EU ETS Green technology |
Climate change has become a salient issue, seen constantly in the headlines and discussed at the highest political level as evidenced by the 2005 G8 summit. It poses a major risk to the global economy, affecting the wealth of societies, the availability of resources, the price of energy, and the value of companies.
Carbon risk management is expected to increasingly affect shareholder value, due to higher energy prices, restrictive GHG targets, and increased losses due to severe and adverse weather events. In this way, global warming has become the environmental issue that has the most potential to effect the profitability—and in extreme cases the actual existence—of a number of companies. We examine the consequences of regulatory changes, physical impacts, and the effect of putting a price on carbon. We also explore new regions of endeavor that have developed due to the evolution of carbon finance, such as the interrelationship between weather and energy markets, the creation of new markets in carbon currencies, and the reinterpretation of fiduciary duties of institutional investors, seen in the light of climate risk.
We believe that climate change will become even more visible over the next five years, as extreme weather events increase and press coverage intensifies over the political and environmental feasibility of nuclear power, as well as any negotiations regarding post-2012 international emissions regulations. In this context, climate change could become a mainstream consumer issue by 2010.
As this chapter has illustrated, evidence of climate change is not hard to find. Average surface temperatures have been rising, against a backdrop of rapidly increasing atmospheric concentrations of CO2. Following this introduction to the Kyoto Protocol and the policies and markets that shape a carbon-constrained society, Chapter 2 takes a close look at the entire energy chain and its relationship to the value chain. It then examines the different sources of energy, its uses, its users, and the key issues affecting this sector as it responds to increasing pressure from government policies. The next two chapters introduce the impacts of the two drivers found at the sector level in Figure 1.4: namely, the implications of government actions and physical impacts on different sectors within the global economy.
Chapter 5 examines the fiduciary duty of institutional investors as they assess the financial effects of climate change within the investment community. Chapter 6 focuses on the flexible mechanisms designed by the Kyoto Protocol and the experience of the EU Emissions Trading Scheme. Chapter 7 takes a closer look at some health issues that arise from changes in climatic conditions, as well as the physical impacts of climatic changes that are causing both economic and social concerns in various geographical locations. This is followed by an examination of some products for Alternative Risk Transfer that are designed to cover environmental risks associated with climate change.
Martin Whittaker has contributed Chapter 9, which gives shape to the carbon finance marketplace, and explains the speed with which it has developed and the complexity of its growth. The concluding chapter, entitled “Carbon Finance: Present Status and Future Prospects,” outlines concerns regarding increased levels of climate change, the opportunities for players and products to alleviate some of the potential impacts, and the role that carbon finance plays in this global phenomenon.
1. Greenhouse gases include:
Carbon dioxide (CO2)
Methane (CH4)
Nitrous oxide (N2O)
Hydrofluorocarbons (HFCs)
Perfluorocarbons (PFCs)
Sulphur hexafluoride (SF6)
Carbon dioxide accounts for the majority of GHG emissions, at about 77 percent of the worldwide total, but is the least potent in terms of contribution toward climate change. The remainder comes mainly from methane (14 percent), nitrous oxide (8 percent), with a small share coming from fluorinated gases (1 percent). The impacts of these other GHG are, however, usually expressed in terms of carbon dioxide equivalents (CO2-e). The contributions of CH4 and N2O are significantly larger in developing countries, and in some cases are larger than their energy-related CO2 emissions (Baumert, Herzog, and Pershing 2005).
2. C.D. Keeling at the Scripps Institute of Oceanography.
3. Stabilization targets are sometimes also expressed in relation to atmospheric concentrations of CO2 (e.g., 450, 550, and 650 ppm CO2-e) as well as to temperature changes.
4. Under the Kyoto Protocol, Annex 1 countries are defined as industrialized countries and economies in transition listed in Annex 1 of the UNFCC. The responsibilities under the Convention include a nonbinding commitment to reduce their GHG emissions to 1990 levels by 2000. Annex “B” countries, on the other hand, are the 39 emissions-capped industrialized countries and economies in transition listed in Annex “B” of the Kyoto Protocol that have legally binding emission reduction obligations. Although there are some differences between the two lists of countries, in practice the terms are used interchangeably.
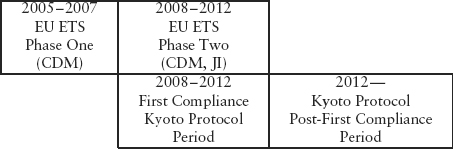
5. Certain confusion exists regarding the time frames of the Kyoto Protocol Compliance Period and the two phases of the EU ETS. The first phase of the EU ETS is designed to gain experience with carbon trading, while the second phase is intended to correspond with the Kyoto Protocol time frame. Their relative timing is represented as:
6. Conference of the Parties (COP) of UNFCCC and Meeting of the Parties (MOP) of the Kyoto Protocol.
7. Depending on the region and strength, tropical storms forming over tropical oceans are referred to variously as hurricanes (Atlantic and Northeast Pacific), typhoons (Northwest Pacific), or cyclones (Indian Ocean and Australia) (Faust 2006).
8. RGGI is a joint effort that was established by nine states: Connecticut, Delaware, Maine, Massachusetts, New Hampshire, New York, Rhode Island, and Vermont. In late 2005, however, Massachusetts and Rhode Island withdrew from the program.
9. Carbon intensity is the ratio of CO2 emissions per unit of economic activity or output—a strong indicator of overall efficiency of a company’s operations with respect to carbon emissions. At the national level, this indicator is shown as CO2 emissions per unit of gross domestic product (GDP).