Chapter 7
Polymer Solubility and Solutions
7.1 Introduction
Most people associate polymers with solid materials—from rubber bands to car tires to Tupperware®— but what about acrylic and latex paints or ketchup and salad dressing or oil-drilling fluids? The thermodynamics and statistics of polymer solutions is an interesting and important branch of physical chemistry, and is the subject of many good books and large sections of books in itself. It is far beyond the scope of this chapter to attempt to cover the subject in detail. Instead, we will concentrate on topics of practical interest and try to indicate, at least qualitatively, their fundamental bases. Three factors are of general interest:
7.2 General Rules for Polymer Solubility
Let us begin by listing some general qualitative observations on the dissolution of the polymers:
It is important to note here that items 1, 2, and 3 are equilibrium phenomena and can be described thermodynamically (at least in principle), while item 4 is a rate (or kinetic) phenomenon and is governed by the rates of disentanglement and diffusion of polymer chains in the solvent.


7.3 Typical Phase Behavior in Polymer–Solvent Systems
Figure 7.1 shows schematically a phase diagram for a typical polymer–solvent system, plotting temperature versus the polymer fraction in the system (essentially a T-x diagram from thermodynamics). At low temperatures, the typical polymer does not dissolve well in many solvents (although the dissolution process can take time, since polymer chains must be disentangled to form a uniform solution). The diagram shows a two-phase system at low temperatures but a completely miscible system at higher temperatures. In the lower temperature phase envelope, the dotted tie lines connect the compositions of phases in equilibrium: a solvent-rich phase (dilute solution) on the left and a polymer-rich (swollen polymer or gel) phase on the right. As the temperature is raised, interactions between the solvent and the polymer increase, and the compositions of the phases come closer together, until at the upper critical solution temperature (UCST) they are identical. Above the UCST, the system forms homogeneous (single-phase) solutions across the entire composition range. The location of the phase boundary depends on the interaction between the polymer and the solvent as well as the molecular weight of the polymer.
Figure 7.1 Schematic phase diagram for polymer–solvent system: (a) dilute solution phase; (b) swollen polymer or “gel” phase.
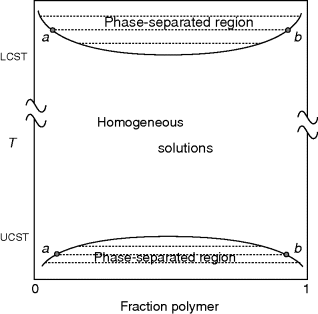
In recent years, a number of systems have been examined that also exhibit a lower critical solution temperature (LCST), as shown at the top of Figure 7.1. Here, a more unusual thermodynamic property is exhibited when the polymer phase separates from the solvent after being heated. (One might question the nomenclature the puts the LCST above the UCST, but that is the accepted definition.) LCSTs are more difficult to observe experimentally because they often lie well above the normal boiling points of the solvents.
When we talk about a polymer being soluble in a particular solvent, we generally mean that the system lies between its LCST and UCST, that is, it forms a homogeneous solution over the entire composition range. Keep in mind, however, that homogeneous solutions can still be formed toward the extremes of the composition range below the UCST and above the LCST.
7.4 The Thermodynamic Basis of Polymer Solubility
“To dissolve or not to dissolve. That is the question.” (with apologies to W.S.). The answer is determined by the sign of the Gibbs free energy. Consider the process of mixing pure polymer and pure solvent (state 1) at constant pressure and temperature to form a solution (state 2):
where
ΔG = the change in Gibbs free energy upon mixing
ΔH = the change in enthalpy due to mixing
T = absolute temperature
ΔS = the change in entropy due to mixing
If only ΔG is negative, will the solution process be thermodynamically feasible. The absolute temperature must be positive by definition and the change in entropy for a solution process is generally positive (the chains become more disordered when dissolved in solution). One possible exception is for lyotropic liquid-crystal materials, where the chains organize into crystals when in solution. The positive product (TΔS) is preceded by a negative sign. Thus, the third term (−TΔS) in Equation (7.1) favors solubility. The change in enthalpy (ΔH) may be either positive or negative. A positive ΔH means that the solvent and polymer “prefer their own company,” that is, the pure materials are in a lower energy state than the mixed solution, while a negative ΔH indicates that the solution is in the lower energy state. If the latter situation is true, a solution is assured. Negative ΔH's usually arise where specific interactions such as hydrogen bonds are formed between the solvent and polymer molecules. But, if ΔH is positive, then ΔH < TΔS must be true for the polymer to be soluble (and linking this to the discussion of UCSTs, raising the temperature would be one way to achieve solubility).
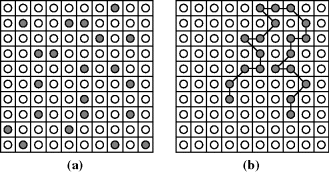
One thing that makes polymers unusual is that the entropy change in forming a polymer solution is generally much smaller than that which occurs on dissolution of equivalent masses or volumes of low molecular weight solutes. The reasons for this are illustrated qualitatively on a two-dimensional lattice model in Figure 7.2. With the low molecular weight solute (say, styrene monomer, CH2=CHϕ), the solute molecules may be distributed randomly throughout the lattice, the only restriction being that a lattice slot cannot be occupied simultaneously by two (or more) molecules. This gives rise to a large number of configurational possibilities, that is, high entropy. In a polymer solution, however, each chain segment is confined to a lattice site adjacent to the next chain segment, greatly reducing the configurational possibilities. This also gives a reasonable illustration of the challenge of dissolving polymers, as the chains must disentangle from a solid coil or blob to float freely in a good solvent. Returning to the lattice, note that for a given number of chain segments (equivalent masses or volumes of polymer), the more chains they are split up into, that is, the lower their molecular weight, the higher the entropy upon dissolution. This directly explains observation 2 in Section 7.2, the decrease in solubility with molecular weight. But in general, for high molecular weight polymers, because the TΔS term is so small, if ΔH is positive then it must be even smaller if the polymer is to be soluble. So in the absence of specific interactions, predicting polymer solubility largely boils down to minimizing ΔH.
Figure 7.2 Lattice model of solubility: (a) low molecular weight solute; (b) polymeric solute.  = Solvent;
  = Solute.
7.5 The Solubility Parameter
How can ΔH be estimated? Well, for the formation of regular solutions (those in which the solute and the solvent do not form specific interactions), the change in internal energy per unit volume of solution is given by
where
ΔE = the change in internal energy per unit volume of solution
ϕi = component volume fractions
δi = solubility parameters
The subscripts 1 and 2 usually (but not always) refer to solvent and solute (polymer), respectively. The solubility parameter is defined as follows:
(7.3) 
where
CED = cohesive energy density, a measure of the intermolecular forces holding the molecules together in the liquid state
ΔEv = molar change in internal energy on vaporization
v = molar volume of liquid (cm3/mol)
Traditionally, solubility parameters have been given in (cal/cm3)1/2 = hildebrands (in honor of the originator of regular solution theory), but they are now more commonly listed in (MPa)1/2, where 1 hildebrand = 0.4889 (MPa)1/2.
Now, for a process that occurs at constant volume and constant pressure, the changes in internal energy and enthalpy are equal. Since the change in volume on solution is usually quite small, this is a good approximation for the dissolution of polymers under most conditions, so Equation (7.2) provides a means of estimating enthalpies of solution if the solubility parameters of the polymer and the solvent are known.
Note that regardless of the magnitudes of δ1 and δ2 (they must be positive), the predicted ΔH is always positive, because Equation (7.2) applies only in the absence of the specific interactions that lead to negative ΔH's. Inspection of Equation (7.2) also reveals that ΔH is minimized and the tendency toward solubility is therefore maximized by matching the solubility parameters as closely as possible. As a very rough rule-of-thumb (or heuristic principle, if you prefer),
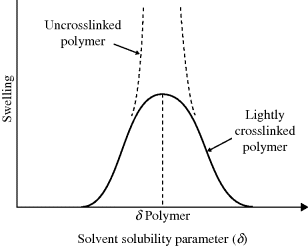
Measuring the solubility parameter of a low molecular weight solvent is not a problem. Polymers, on the other hand, degrade long before reaching their vaporization temperatures, making it impossible to evaluate ΔEv directly. Fortunately, there is a way around this impasse. The greatest tendency of a polymer to dissolve occurs when its solubility parameter matches to that of the solvent. If the polymer is crosslinked lightly, it cannot dissolve but will only swell. The maximum swelling will be observed when the solubility parameters of the polymer and the solvent are matched. So polymer solubility parameters are determined by soaking lightly crosslinked samples in a series of solvents of known solubility parameters. The value of the solvent's δ at which maximum swelling is observed is taken as the solubility parameter of the polymer (Figure 7.3).
Figure 7.3 Determination of polymer solubility parameter by swelling lightly crosslinked samples in a series of solvents.
Solubility parameters of solvent mixtures can be readily calculated from
where
yi = mole fraction of component i
vi = molar volume of component i
ϕi = volume fraction of component i
Equation (7.5) has often been used to prepare a series of mixed solvents for establishing the solubility parameter of a polymer as described above. Care must be exercised in this application, however, because the liquid that winds up inside the swollen polymer is not necessarily what you mixed up. In general, the crosslinked polymer will preferentially absorb the better (closer δ) solvent component, a phenomenon known as partitioning. In the absence of specific data on solvents, a group-contribution method is available for estimating both the solubility parameters and the molar volumes of liquids [1].
While the solubility-parameter concept has proved useful, there are unfortunately many exceptions to Equation (7.4). First, regular solution theory that leads to Equation (7.2) has some shortcomings in practice. Second, polymer solubility is too complex a phenomenon to be described quantitatively with a single parameter. Several techniques have been proposed that supplement solubility parameters with quantitative information on hydrogen bonding and dipole moments [2, 3]. One of the simplest of these classifies solvents into three categories according to their hydrogen-bonding ability (poor, moderate, and strong). Three different δ ranges are then listed for each polymer, one for each solvent category. Presumably, a solvent that falls within the δ range for its hydrogen-bonding category will dissolve the polymer. Another technique that has achieved widespread practical application is discussed in the next section.
7.6 Hansen's Three-Dimensional Solubility Parameter
According to Hansen [4–7], the total change in internal energy on vaporization, ΔEv, may be considered as the sum of three individual contributions: one due to hydrogen bonds, ΔEh, another due to permanent dipole interactions, ΔEp, and a third from dispersion (van der Waals or London) forces, ΔEd:
(7.6) 
Dividing by the molar volume v gives:
(7.7) 
or

Thus, the solubility parameter δ may be thought of as a vector in a three-dimensional d, p, and h space. Equation (7.8) gives the magnitude of the vector in terms of its components. A solvent, therefore, with given values of δp1, δd1, and δh1 is represented as a point in space, with δ being the vector from the origin to this point.
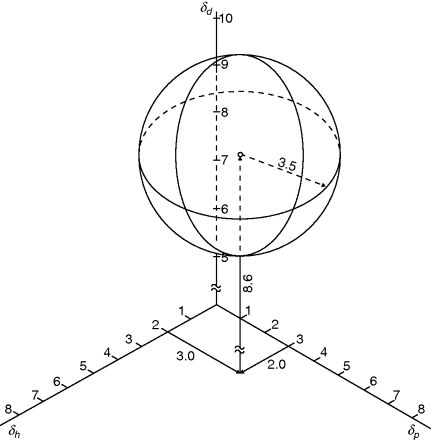
A polymer (being denoted as component 2) is then characterized by δp2, δd2, and δh2. Furthermore, it has been found on a purely empirical basis that if δd is plotted on a scale twice the size as that used for δp and δh, then all solvents that dissolve that polymer fall within a sphere of radius R surrounding the point (δp2, δd2, and δh2).
Solubility judgments for the determination of R are usually based on visual observation of 0.5 g polymer in 5 cm3 of solvent at room temperature. Given the concentration and temperature dependence of the phase boundaries in Figure 7.1, this is somewhat arbitrary, but it seems to work out pretty well in practice, probably because the boundaries are fairly “flat” for polymers of reasonable molecular weight.
The three-dimensional equivalent of Equation (7.4) is obtained by calculating the magnitude of the vector from the center of the sphere surrounding the solubility parameters for the polymer (δp2, δd2, and δh2) to the point representing the solvent (δp1, δd1, and δh1). If this is less than R, the polymer is deemed soluble:
(7.9) 
(The factor 4 arises from the empirical need to double the δd scale to achieve a spherical solubility region.)
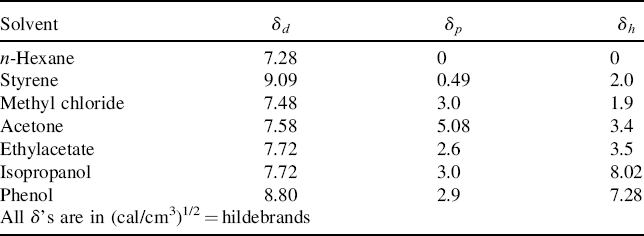
Figure 7.4 shows the solubility sphere for PS (δp = 3.0, δd= 8.6, and δh=2.0, R = 3.5, all in hildebrands) [4]. Note that parts of the PS sphere extend into regions of negative δ. The physical significance of these areas is questionable, at best.
Figure 7.4 The Hansen solubility sphere for PS (δd = 8.6, δp = 3.0, δh = 2.0, = 3.5) [5].
The range of δd's spanned by typical polymers and solvents is rather small. In practice, therefore, the three-dimensional scheme is often reduced to two dimensions, with polymers and solvents represented on δh−δp coordinates with a polymer solubility circle of radius R.
Values of the individual components of δp, δd, and δh have been developed from measured δ values, theoretical calculations, studies on model compounds, and plenty of computer fitting. They are extensively tabulated for solvents [4–9]. They, along with R, are less readily available for polymers, but have been published [4, 5, 9]. Mixed solvents are handled by using a weighted average for the individual δj components according to Equation (7.5).
Despite its semiempirical nature, the three-dimensional solubility parameter has proved to be of great practical utility, particularly in the paint industry, where the choice of solvents to meet economic, ecological, and safety constraints is of critical importance. It is capable of explaining those cases in which the solvent and the polymer δ's are almost perfectly matched, yet the polymer will not dissolve (the δ vectors have the same magnitudes, but different directions), or where two nonsolvents can be mixed to form a good solvent (the individual solvent components lie on opposite sides outside the sphere, the mixture within). Inorganic pigments may also be characterized by δ vectors. Pigments whose δ vectors closely match to those of a solvent tend to form stable suspensions in that solvent.
7.7 The Flory–Huggins Theory
Theoretical treatment of polymer solutions was initiated independently and essentially simultaneously by Flory [10] and Huggins [11] in 1942. The Flory–Huggins theory is based on the lattice model shown in Figure 7.2. For the case of the low molecular weight solute (Figure 7.2a), it is assumed that the solute and the solvent molecules have roughly the same volumes; each occupies one lattice site. With the polymeric solute (Figure 7.2b), a segment of the polymer molecule (which corresponds roughly but not necessarily exactly to a repeat unit) has the same volume as a solvent molecule and also occupies one lattice site.
By statistically evaluating the number of arrangements possible on the lattice, Flory and Huggins obtained an expression for the (extensive) configurational entropy changes (those due to geometry alone), ΔS*, in forming a solution from n1 moles of solvent and n2 moles of solute:
where the ϕ's are volume fractions,
(7.10b) 
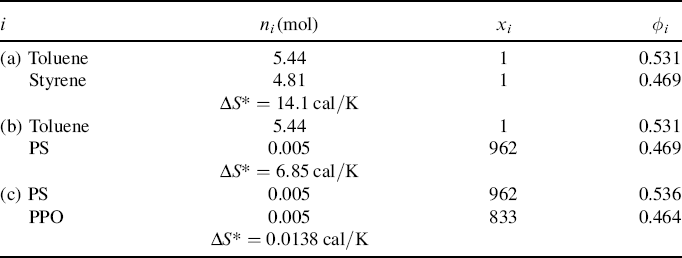
and the x's are the number of segments in the species. For the usual monomeric solvent, x1 = 1. For a polydisperse polymeric solute, strictly speaking, a term must be included in Equation (7.10) for each individual species in the distribution, but x2 is usually taken as  , the number-average degree of polymerization, with little error. (Writing the volume fractions in terms of moles implies equal molar segmental volumes.) Note that while ϕ1, ϕ2, and n1 are the same in Figures 7.2a and b, n2 = 20 molecules for the monomeric solute, but only 1 molecule for the polymeric solute.
 = 100,000
 = 100,000 is mixed with 500 g of polyphenylene oxide (PPO), (see Example 2.4K),
  = 100,000. (This is one of the rare examples where two high molecular weight polymers are soluble in one another.)
 ni/mi, where mi is the molecular weight of the repeat unit, mPS = 104, mPPO = 120. These quantities may now be inserted in Equations 6.10, 6.10a, and 6.10b. The results are summarized below (R = 1.99 cal/mol·K):
An expression for the (extensive) enthalpy of mixing, ΔH, was obtained by considering the change in adjacent-neighbor (molecules or segments) interactions on the lattice, specifically the replacement of [1,1] and [2,2] interactions with [1,2] interactions upon mixing:
where χ is the Flory–Huggins polymer–solvent interaction parameter. Initially, χ was interpreted as the enthalpy of interaction per mole of solvent divided by RT. By equating Equations (7.2) and (7.11) (keeping in mind that the enthalpy in Equation (7.2) is based on a unit volume of solution, while that in Equation (7.11) is an extensive quantity) and making use of (Equation 7.10a), it may be shown that the Flory–Huggins parameter is related to the solubility parameters by
where v is the molar segmental volume of species 1 and 2 (assumed to be equal). For the dissolution of a polymer in a monomeric solvent (e.g., PS in styrene), v is taken as the molar volume of the solvent, v1. Based on our knowledge of solubility parameters, we see that Equation (7.12) predicts χ ≥ 0. Actually, negative values have been observed.
If it is assumed that the entropy of solution is entirely configurational, substitution of (Equations 7.10a) and (7.11) into Equation (7.1) gives
Again, for the usual monomeric solvent, x1 = 1. For a polydisperse solute, the middle term on the right side of Equation (7.13) must be replaced by a summation over all the solute species; however, treatment as a single solute with  usually suffices.
In terms of the Flory–Huggins theory, the criterion for complete solubility of a high molecular weight polymer across the composition range is
It is now recognized that there is an interactive as well as a configurational contribution to the entropy of solution, that is also included in the χ term, so χ is now considered to be a ΔG (rather than strictly a ΔH) of interaction per mole of solvent divided by RT. The first two terms on the right of Equation 6.13 therefore represent the configurational entropy contribution to ΔG, while the third term is the interaction contribution and includes both enthalpy and entropy effects.
The Flory–Huggins theory has been used extensively to describe phase equilibria in polymer systems. It can, for example, qualitatively describe the lower phase boundary (UCST) in Figure 7.1, although it rarely gives a good quantitative fit of experimental data. Partial differentiation of Equation (7.13) with respect to n1 (keeping in mind that ϕ1 and ϕ2 are functions of n1) gives the chemical potential of the solvent. This is, of course, a key quantity in phase equilibrium that also makes χ experimentally accessible. Further development is beyond the scope of this chapter, but the subject is well treated in standard works on polymer solutions [12–15].
The limitations of the Flory–Huggins theory have been recognized for a long time. It cannot predict an LCST (Figure 7.1). It is perhaps not surprising that χ depends on temperature, but it unfortunately turns out to be a function of concentration and molecular weight as well, limiting practical application of the theory. These deficiencies are thought to arise because the theory assumes no volume change upon mixing and the statistical analysis on which it is based is not valid for very dilute solutions, particularly in poor solvents. There has been considerable subsequent work done to correct these deficiencies and extend lattice-type theories [16, 17].
Experimental values for χ have been tabulated for a number of polymer–solvent systems, both single values [9] and even as a function of composition [8]. They may be used with Equation (7.14) to predict solubility.
7.8 Properties of Dilute Solutions
Well, now that the thermodynamics have been covered, we know how to get the polymer into solution, but how the polymer chains are organized in the solution is also important. Let us initially assume that the polymer is in a fairly dilute solution, therefore we can assume that there are very few entanglements between the polymer chains. Entanglements begin to set in when the dimensionless Berry number (Be), the product of intrinsic viscosity and concentration, exceeds unity [18]:
For typical polymer–solvent systems, this usually works out to a few percent polymer.
In a “good” solvent (one whose solubility parameter closely matches that of the polymer), the secondary forces between polymer segments and solvent molecules are strong, and the polymer molecules will assume a spread-out conformation in solution. In a “poor” solvent, the attractive forces between the segments of the polymer chain will be greater than those between the chain segments and the solvent; in other words, the chain segments “prefer their own company,” and the chain will ball up tightly (as in Figure 7.5).
Figure 7.5 The effects of solvent power and temperature on a polymer molecule in solution.
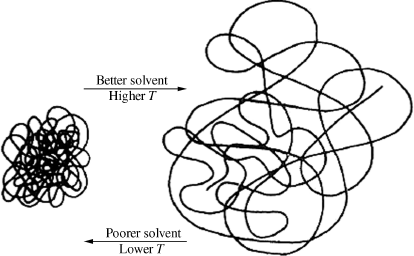
Imagine a polymer in a good solvent, for example, PS (δ = 9.3) in chloroform (δ = 9.2). A nonsolvent is now added, say methanol (δ = 14.5). (Despite the large difference in solubility parameters, chloroform and methanol are mutually soluble in all proportions because of the large ΔS of solution for low molecular weight compounds.) Ultimately, a point is reached where the mixed solvent becomes too poor to sustain solution, and the polymer precipitates out because the attractive forces between polymer segments become much greater than that between the polymer and the solvent. At some point, the polymer teeters on the brink of solubility, ΔG = 0 and ΔH = TΔS. This point obviously depends on the temperature, polymer molecular weight (mainly through its influence on ΔS), and the polymer–solvent system (mainly through its influence on ΔH). Adjusting either the temperature or the polymer–solvent system allows fractionation of the polymer according to molecular weight, as successively smaller molecules precipitate upon lowering the temperature or going to poorer solvent.
In the limit of infinite molecular weight (the minimum possible ΔS), the situation where ΔH = TΔS is known as the θ or Flory condition. For a polymer of infinite molecular weight in a particular solvent, the θ temperature equals the UCST, indicating that the solution is on the brink of phase separation. Under these conditions, the polymer–solvent and polymer–polymer interactions are equal, and the solution behaves in a so-called ideal fashion with the second virial coefficient equal to 0, etc., and the MHS exponent (Eq. 5.18) a = 0.5.
For a given polymer, θ conditions can be reached at a fixed temperature by adjusting the solvent to give a θ solvent or with a particular solvent by adjusting the temperature to reach the θ or Flory temperature. Any actual polymer will still be soluble under θ conditions, of course, because of its lower-than-infinite molecular weight and consequently larger ΔS.
Getting back to our example, we might ask what happens to the viscosity of the solution upon moving from a good solvent to a poor solvent (to make a fair comparison, imagine that as soon as a nonsolvent is added, an equivalent amount of good solvent is removed, maintaining a constant polymer concentration). This question can be answered qualitatively by imagining the polymer molecules to be rigid spheres (they really are not) and applying an equation derived by Einstein [19] for the viscosity of a dilute suspension of rigid spheres:
(7.16) 
where η is the viscosity of the suspension (solution), ηs is the viscosity of the solvent, and ϕ is the volume fraction of the polymer spheres. (We further assume that the viscosities of the low molecular weight liquids are comparable, i.e., that ηs does not change.) Going from good to poor solvent, the polymer molecules ball up, giving a smaller effective ϕ, lowering the solution viscosity. Thus, solution viscosity can be controlled by adjusting solvent power.
 , estimated by viscometry.
 when calculated using the MHS Equation 5.18.
 to move on the high side.
Consider now the effects of temperature on the viscosity of a solution of polymer in a relatively poor solvent. As is the case with all simple liquids, the solvent viscosity, ηs, decreases with increasing temperature. Increasing temperature, however, imparts more thermal energy to the segments of the polymer chains, causing the molecules to spread out and assume a larger effective ϕ in solution. Thus, the effects of temperature on ηs and ϕ tend to compensate, giving a solution that has a much smaller change in viscosity with temperature than that of the solvent alone. In fact, the additives that are used to produce the so-called multiviscosity motor oils (such as 10W-40) are polymers with compositions adjusted so that the base oil is a relatively poor solvent at the lowest operating temperatures. As the engine heats up, the polymer molecules uncoil, providing a much greater resistance to thinning than is possible from oil alone (and preventing, at least as the commercials say, “thermal breakdown”).
Viscosities (at low shear rates) of dilute solutions of polymers with known molecular weights may be calculated using Equations (5.15), (5.16), and (5.18), reversing the procedure for obtaining molecular weights from viscosity measurements.
7.9 Polymer–Polmyer-Common Solvent Systems
As was illustrated in Example 7.3c, ΔS for the dissolution of one polymer in another is extremely small. For this reason, the true solubility of one polymer in another is relatively rare, although many more examples have come to light in recent years. When such solubility does occur, it generally results from strong interactions (e.g., a large, negative ΔH), most often hydrogen bonds, between the polymer pairs. Polymer–polymer miscibility has been extensively reviewed [20, 21].
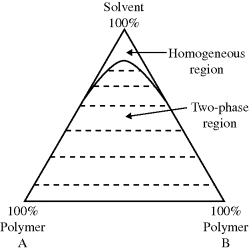
For the far more common case where two polymers are insoluble in one another, even when a common solvent is added (one that is infinitely soluble with each polymer alone), the two polymers usually cannot coexist in a homogeneous phase beyond a few percent concentration. A schematic phase diagram for such a system is shown in Figure 7.6. Beyond a few percent polymer (the exact value depends on the chemical nature of the polymers and the solvent and molecular weights of the polymers), two phases in equilibrium are formed, each phase containing a nearly pure polymer. These results extend to more than two polymers. In general, each polymer will coexist in a separate phase. This fact was the basis of an early proposal for separating and recycling mixed plastic waste [22].
Figure 7.6 Typical ternary phase diaram for a polymer–polymer-common solvent system. The dotted tie lines connect composition of phases in equlibrium.
7.10 Polymer Solutions, Suspensions, and Emulsions
Given a good solvent and a temperature between the UCST and LCST for a polymer–solvent system, a homogeneous solution will form. The amount of polymer added will certainly increase viscosity, but in any well-solvated polymer, the chains will expand, uncoil, and allow many polymer–solvent interactions. For thermodynamically bad polymer–solvent combinations, polymer–polymer interactions are preferred, and each polymer chain will be tightly coiled, leading to a two-phase system with a solid polymer precipitated out. A suspension can be made by introducing energy of mixing, but this only spreads the insoluble polymer out in a nonsolvent. When mixing is stopped, the polymer will settle out again (think oil and water as in traditional Italian salad dressing). Polymer emulsions can overcome this settling out through the introduction of surfactants—molecules that have two distinct regions—one that is solvent-philic and the other polymer-philic. The surfactants line up along the interface between the polymer phase and the solvent phase, allowing a stable emulsion to form (think emulsified salad dressings that require no shaking to mix). Both polymer suspensions and emulsions are important in both reactions and final products and are discussed in later chapters.
7.11 Concentrated Solutions: Plasticizers
Up to this point, we have considered relatively dilute polymer solutions. Now let us look at the other end of the spectrum, where the polymer is the major constituent of the solution. A pure, amorphous polymer consists of a tangled mass of polymer chains. The ease with which this mass can deform depends on the ability of the polymer chains to untangle and slip past one another. One way of increasing this ability is to raise the temperature, increasing segmental mobility of the polymer chains. Another way is to add a low molecular weight (generally low volatility) liquid to the polymer as an external plasticizer. By forming secondary bonds to the polymer chains and spreading them apart, the plasticizer reduces secondary bonds in polymer–polymer interactions. The plasticizer provides more room for the polymer molecules to move around, yielding a softer, more easily deformable mass. This corresponds well with one of the major functions of plasticizers, lowering Tg.
Quantitative confirmation of Example 7.6 was provided by a noted technical journal, Sports Illustrated, which, between swimsuit photos, reported on the effects of moisture on the mass and resilience of baseballs [23]:
A similar reversible plasticization of fibers by heat and moisture is applied in the process of steam-ironing fabrics. Using a sizing agent (such as starch) in ironing also begins by plasticizing the clothing, but becomes rigid as the water evaporates (see Example 7.2).
A thermodynamically poor plasticizer should be more effective than a good one, giving a lower viscosity at a given level (smaller ϕ, fewer entanglements), but since it is less strongly bound to the polymer, it will have a greater tendency to exude out over a period of time, leaving the stiff polymer mass. This was a familiar problem with some early imported cars. When parked in the sun, a greasy plasticizer film would condense on the windows and, over a period of time, the upholstery and dashboard would crack from loss of plasticizer. (Much of that new-car smell is due to plasticizers, which evaporate slowly, particularly in hot weather.) Thus, a balance must be struck between plasticizers' efficiency and permanence. Also from the standpoint of permanence, it is necessary that the plasticizers have low volatility. Plasticizers therefore, generally, have higher molecular weights than solvents (400–600 versus 100 or less for typical organic solvents), but are still well below the high polymer range in this respect.
A polymer may be internally plasticized by random copolymerization with a monomer whose homopolymer is very soft (has a low Tg, see Chapter 6). There are obviously never any permanence problems when this is done. The composition of the copolymer can be adjusted to give the desired properties at a particular temperature. Above this temperature, the copolymer will be softer than intended and below this temperature, it will be harder. With external plasticizers, the same sort of temperature compensation as in the multiviscosity motor oils is obtained, giving materials that maintain the desired flexibility over a broader temperature range.
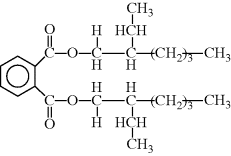
The most common externally plasticized polymer is poly(vinyl chloride) (PVC) (–CH2CHCl–). A typical plasticizer for PVC is dioctyl phthalate (DOP), the diester of phthalic acid and iso-octyl alcohol (note: DOP is the more common term in industry, but the IUPAC name for this chemical is di(2-ethyl hexyl) phthalate or DEHP):
PVC, because of its high chlorine content, is inherently fire resistant (see Chapter 18 for other methods to make polymers fire resistant). Dilution of the PVC with a hydrocarbon plasticizer increases flammability (especially important since many plasticizers are included at 20 wt% or higher). Therefore, chlorinated waxes and phosphate esters, for example, tricresyl phosphate (TCP), are used as plasticizers that maintain fire resistance. So-called polymeric plasticizers, which are actually oligomers with molecular weights on the order of 1000, provide low volatility and good permanence. It might also be noted that a low molecular weight fraction in a pure polymer behaves as a plasticizer often in an undesirable fashion.
Epoxidized plasticizers also perform the important function of stabilizing PVC. When PVC degrades, HCl is given off that catalyzes further degradation. Not only that, HCl attacks metallic molding machines, molds, extruders, etc. The epoxy plasticizers are made by epoxidizing polyunsaturated vegetable oils:

The oxirane rings soak up HCl and minimize further degradation (this is an admittedly simplified view of a very complex phenomenon) [24]:

Having their origin in vegetable oils, these epoxidized plasticizers can often obtain FDA clearance for use in food-contact applications. Further advances in plasticizers have been reviewed [25].
Unplasticized (or nearly so) PVC is a rigid material used for pipe and fittings, house siding, window frames, bottles, etc. The properties of plasticized PVC vary considerably depending on the plasticizer level. Plasticized PVC is familiar as a gasket material, a leather-like upholstery material (Naugahyde®), wire and cable covering, shower curtains, water hoses, and packaging film.
Plastisols are an interesting and useful technological application of plasticized PVC. A typical formulation might consist of 100 parts DOP phr (per hundred parts polymer resin) plus some stabilizers, pigments, etc. Although the PVC is thermodynamically soluble in the DOP at room temperature, the rate of dissolution of high molecular weight PVC at room temperature is extremely low. Therefore, initially the plastisol is a milky suspension of finely divided PVC particles in the plasticizer. As a suspension rather than a solution, the viscosity is of the order of magnitude of that of the plasticizer itself (Eq. 6.16), and it can be applied to substrates or molds by brushing, dipping, rolling, etc. When heated to about 350 °F (175 °C), the increased thermal agitation of the polymer molecules speeds up the dissolution process greatly. If there is no filler or pigment present, the solution process can be observed as the plastisol becomes transparent. When cooled back to room temperature, the viscosity of the solution is so high that for all practical purposes, it may be considered as a flexible solid. Examples of plastisols include doll “skin,” toy rubber duckies, and the covering of wire dish racks. Vinyl foam is also made by whipping air into a plastisol prior to fusion.
The viscosity of the initial suspension may be lowered by incorporating a volatile organic diluent for the plasticizer, giving an organsol, or by whipping it in water to form a hydrosol. In both cases, the diluent vaporizes upon heating.
Further discussion of the plasticized polymers is included in Chapter 18.
Problems
1. Fedors, R.F., Polym. Eng. Sci. 14, 147, 472 (1974).
2. Beerbower, A., L.A. Kaye, and D.A. Pattison, Chem. Eng. 74(26), 118 (1967).
3. Seymour, R.B., Modern Plastics 48(10), 150 (1971).
4. Hansen, C.M., J. Paint. Technol. 39(505), 104 (1967).
5. Hansen, C.M., The Three Dimensional Solubility Parameter and Solvent Diffusion Coefficient, Danishi Technical Press, Copenhagen, Denmark, 1967.
6. Hansen, C.M. and A. Beerbower, Solubility parameters, in Encyclopedia of Chemical Technology, Suppl.Vol., 2nd ed., Wiley, New York, 1971.
7. Hansen, C.M., Ind. Eng. Chem. Prod. Res. Dev. 8, 2 (1969).
8. Brandrup, J. and E.H. Immergut (eds), Polymer Handbook, 3rd ed., Wiley-Interscience, New York, 1989.
9. Barton, A.F.M., Handbook of Polymer-Liquid Interaction Parameters and Solubility Parameters, CRC Press, Boca Raton, FL, 1990.
10. Flory, P.J., J. Chem. Phys. 10, 51 (1942).
11. Huggins, M.L., Ann. N.Y. Acad. Sci. 43, 1 (1942).
12. Flory, P.J., Principles of Polymer Chemistry, Cornell University Press, Ithaca, NY, 1953.
13. Morawetz, H., Molecules in Solution, Wiley-Interscience, New York, 1975.
14. Tompa, H., Polymer Solutions, Butterworths, London, 1956.
15. Kwei, T.K., Macromolecules in solution, Chapter 4 in Macromolecules: An Introduction to Polymer Science, F.A. Boveyand F.H. Winslow (eds), Academic, New York, 1979.
16. Sanchez, I.C. and R.H. Lacombe, Macromolecules 11(6), 1145 (1978).
17. Pesci, A.I. and K.F. Freed, J. Chem. Phys. 90(3), 2017 (1989).
18. Hager, B.L. and G.C. Berry, J. Polym. Sci.: Polym. Phys. Ed. 20, 911 (1982).
19. Einstein, A., Ann. Phys. 19, 289 (1906); 34, 591 (1911).
20. Olabisi, O., L.M. Robeson, and M.T. Shaw, Polymer-Polymer Miscibility, Academic, New York, 1979.
21. Coleman, M.M., J.F. Graf, and P.C. Paniter, Specific Interactions and the Miscibility of Polymer Blends, Technomic, Lancaster, PA, 1991.
22. Sperber, R.J. and S.L. Rosen, Polym. Eng. Sci. 16(4), 246 (1976).
23. Sports Illustrated, Time, Inc., July 20, 1970, p. 22.
24. Anderson, D.F. and D.A. McKenzie, J. Polymer Sci.: A-1, 8, 2905 (1970).
25. Rahman, M. and C.S. Brazel, Prog. Polym. Sci., 29, 1223 (2004).


