Chapter 14
Introduction to Viscous Flow and the Rheological Behavior of Polymers
14.1 Introduction
In contrast to Chapter 13, where purely elastic materials were described, the opposite end of the spectrum is purely viscous materials, more commonly known as liquids, which for polymers means they are either molten or dissolved in a good solvent. Rheology is the science of the deformation and flow of materials, particularly of polymers that can melt and flow, as long as they are not crosslinked or degrade at temperatures below Tm. This area has been much-studied because polymers exhibit such interesting, unusual, and difficult-to-describe (at least from the standpoint of traditional materials) deformation behavior. The simple and traditional linear engineering models, Newton's law (for flow) and Hooke's law (for elasticity), often just are not reasonable approximations for the behavior of polymers. Not only are the elastic and viscous properties of polymer melts and solutions usually nonlinear but they also exhibit a combination of viscous and elastic response, the relative magnitudes of which depend on the temperature and the time scale of the experiment. Thus, we have a new term viscoelasticity. The viscoelastic response is dramatically illustrated by Silly Putty (a silicone polymer). When bounced (stressed rapidly), it is highly elastic, recovering most of the potential energy it had before being dropped. If stuck on the wall (stressed over a long time period), however, it will slowly flow down the wall, albeit with a high viscosity, and will show little tendency to recover any deformation. We limit ourselves here to one- and two-dimensional deformations. A detailed three-dimensional treatment of rheology is beyond the scope of this book. Several excellent resources are available [1–8].
14.2 Basic Definitions
We begin our treatment of rheology with a discussion of purely viscous flow. For our purposes, this will be defined as a deformation process in which all the applied mechanical energy is nonrecoverably dissipated as heat in the material through molecular friction (i.e., no elastic response at all). This process is known as viscous energy dissipation. Purely viscous flow is in most cases a good approximation for dilute polymer solutions and often for concentrated solutions and melts, where the stress on the material is not changing too rapidly, that is, where steady-state flow is approached.
The viscosity of a material expresses its resistance to flow (compare a low viscosity fluid, such as water, with higher viscosity fluids, such as most oils, honey, or polymer melts). It is defined quantitatively in terms of two basic parameters: the shear stress τ and the shear rate  (more correctly referred to as the rate of shear straining). Polymers can really complicate analysis of flow due to the high molecular weights and entanglements between (or even within) polymer chains. Shear stress and shear rate are defined in Figure 14.1 Consider a point in a laminar flow field (Figure 14.1). A rectangular coordinate system is established with the x axis (sometimes designated the one coordinate direction) in the direction of flow and the y axis (the two direction) perpendicular to surfaces of constant fluid velocity, that is, parallel to the velocity gradient (the velocity at position y is u, and due to the shear force F placed on the Cartesian element in Figure 14.1, the velocity at position y + dy is u + du). This causes the material to deform. The z axis (three or neutral direction) is mutually perpendicular to the others. This is known as simple shearing flow. It is one example of a viscometric flow, a flow field in which the velocity and its gradient are everywhere perpendicular, with a third neutral direction mutually perpendicular to the others (see Bird et al. [2] for a more rigorous definition). Other examples of viscometric flows are given later in this chapter and in Chapter 15. Viscometric flows can often be treated analytically. Fortunately, many laminar-flow situations encountered in practice either are viscometric flows or at least can be reasonably approximated by them.
Figure 14.1 Cartesian element to define shear stress and shear rate.
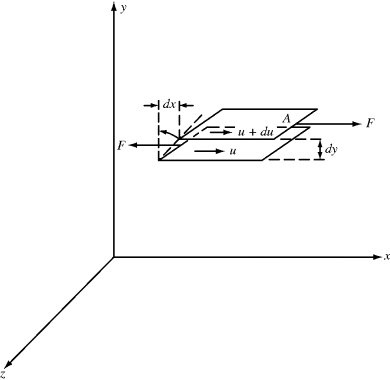
As a fluid moves over a stationary surface, the friction at the surface slows down the flow so that the linear velocity of the fluid changes with distance from the surface. Thus, if we assume a fluid layer at a position y away from a surface moves with a velocity u = dx/dt in the x direction, the layer at y + dy has a velocity of u + du. The displacement gradient, dx/dy, is known as the shear strain, and is given by the symbol  :
:
(14.1) 
The time rate of change of shear strain,  (or d
(or d /dt, the dot is Newton's notation for the time derivative), is the so-called shear rate. Since the order in which the mixed second derivative is taken is immaterial (note that by sticking to two dimensions, we can write total rather than partial derivatives), then
Thus, in simple shearing flow, the shear rate is identical to the velocity gradient, du/dy. (This is not the case for all viscometric flows.)
The shear stress is the force (in the direction of flow) per unit area normal to the y axis:
(14.3) 
The subscript yx will henceforth be dropped unless specifically needed.
Earlier in determining the viscosity-average molecular weights, we introduced the viscosity, η. Viscosity is actually defined as the ratio of shear stress to shear rate:
Traditionally, most rheological work has been done in the CGS system, with force in dynes, mass in grams, length in centimeters, and time in seconds. In this system, the unit of viscosity is dyne-s/cm2, or poise (P); centipoise is also commonly used since the viscosity of water is around 1 cp (for comparison, many polymer melts have viscosities of 10,000 P or higher). Since the early days, SI units have become de rigueur, with force in Newtons (N) and length in meters. SI unit for viscosities is in N·s/m2 = Pa·s (1 Pa·s = 10 P = 1000 cp). Equations here will be written with either of these systems in mind. When using the English system of pound force, pound mass, feet, and seconds, each stress or pressure as written here must be multiplied by the dimensional constant gc = 32.2 ft·lbm/lbf·s2, and viscosities are in lbm/ft·s.
14.3 Relations Between Shear Force and Shear Rate: Flow Curves
When most materials are subjected to a constant shear rate,  at a fixed temperature, a corresponding steady-state value of shear stress, τ, is soon established. A constant shear stress can also be applied, with the steady-state shear rate found based on the input τ. The steady-state relation between shear stress and shear rate at constant temperature is known as a flow curve.
Newton's “law” of viscosity states that the shear stress is linearly proportional to the shear rate, with the proportionality constant being the viscosity, η:
Fluids that follow this hypothesis are termed Newtonian. The hypothesis holds quite well for many nonpolymer fluids, such as gases and water, and solvents, such as toluene. This type of flow behavior would be expected for small, relatively symmetrical molecules, where the structure and/or orientation do not change with the intensity of shearing (particularly those fluids that do not get entangled in one another, as polymers do).
An arithmetic flow curve (τ versus  ) for a Newtonian fluid is a straight line through the origin with a slope η (Figure 14.2a). Because τ and
  often cover very wide ranges, it is usually preferable to plot them on log–log coordinates. Taking logarithms of both sides of Equation (14.5a) yields
(14.5b) 
Figure 14.2 Types of flow curves: (a) arithmetic and (b) logarithmic. N, Newtonian; P, pseudoplastic; B-P, Bingham plastic (infinitely pseudoplastic); D, dilatant.
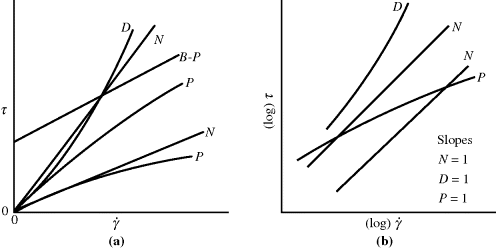
Hence, a log–log plot of τ versus  , a logarithmic flow curve, will be a line of slope one for a Newtonian fluid, with the viscosity found by the log−1 of the y-axis intercept (Figure 14.2b).
Unfortunately, many fluids do not obey Newton's hypothesis. Both dilatant (shear-thickening) and pseudoplastic (shear-thinning) fluids have been observed (Figure 14.2). On log–log coordinates, dilatant flow curves have a slope greater than 1 and pseudoplastics have a slope less than 1. Dilatant behavior is somewhat uncommon but has been reported for certain slurries and implies an increased resistance to flow with intensified shearing. Polymer melts and solutions are invariably pseudoplastic, that is, their resistance to flow decreases with the intensity of shearing.
For non-Newtonian fluids, since τ is not directly proportional to  , the viscosity is not constant with the shear rate. Plots (or equations) giving η as a function of
  (or τ) are an equivalent method of representing a material's steady-state viscous shearing properties. Knowledge of the relation between any two of the three variables (τ, η, and
  ) completely defines the steady-state viscous shearing behavior, since they are related by Equation (14.4).
14.4 Time-Dependent Flow Behavior
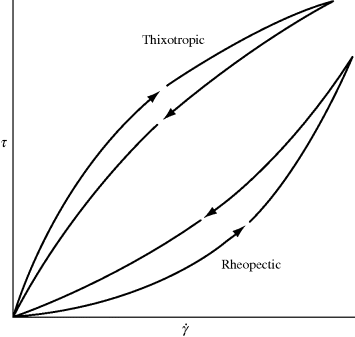
The types of non-Newtonian flow just described, although shear dependent, are time independent. As long as a constant shear rate is maintained, the same shear stress or viscosity will be observed at steady state. Some fluids, however, exhibit reversible time-dependent properties. When sheared at a constant rate or stress, the viscosity of a thixotropic fluid will decrease over a period of time (Figure 14.3), implying a progressive breakdown of structure. If the shearing is stopped for a while, the structure reforms, and the experiment may be duplicated. A classic example is ketchup (which contains natural polymers as thickening agents); it splashes all over after a period of vigorous tapping. Thixotropic behavior is important in the paint industry, where smooth, even application with brush or roller is required, but it is desirable for the paint on the surface to “set up” to avoid drips and runs after application. Thixotropic behavior is fairly common in polymer solutions and melts and is primarily due to chains disentangling and becoming aligned in the direction of flow over time, making it a bit easier to flow (lower viscosity). The opposite sort of behavior is manifested by rheopectic fluids, for example, certain drilling muds used by the petroleum industry. When subjected to continuously increasing and then decreasing shearing, time-dependent fluids give flow curves as in Figure 14.4.
Figure 14.3 Viscosity behavior of time-dependent fluids.
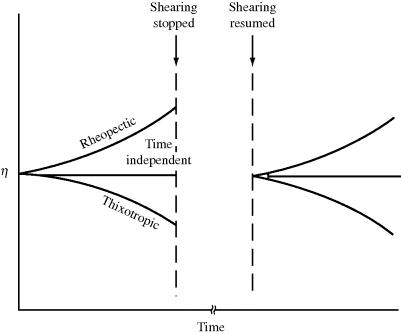
Figure 14.4 Flow curves for time-dependent fluids under continuously increasing and then decreasing shear.
Once in a while, polymer systems will falsely appear to be thixotropic or rheopectic. Careful checking (including before and after molecular weight determinations) invariably shows that the phenomenon is not reversible and is due to degradation or crosslinking of the polymer when in the viscometer for long periods of time, particularly at elevated temperatures. Other transient time-dependent effects in polymers are due to elasticity, and will be considered later, but for chemically stable polymer melts or solutions, the steady-state viscous properties are time independent. We treat only such systems from here on.
14.5 Polymer Melts and Solutions
When the flow properties of polymer melts and solutions can be measured over a wide enough range of shearing, the logarithmic flow curves appear as in Figure 14.5. It is generally observed that:
This behavior can be rationalized in terms of molecular structure. At low shear, the randomizing effect of the thermal motion of the chain segments overcomes any tendency toward molecular alignment in the shear field. The molecules are thus in their most random and highly entangled state, and have their greatest resistance to slippage (flow). As the shear is increased, the molecules will begin to untangle and align in the shear field, reducing their resistance to slippage past one another. Under severe shearing, they will be pretty much completely untangled and aligned, and will reach a state of minimum resistance to flow. This is illustrated schematically in Figure 14.5.
Figure 14.5 Generalized flow properties of polymer melts and solutions.
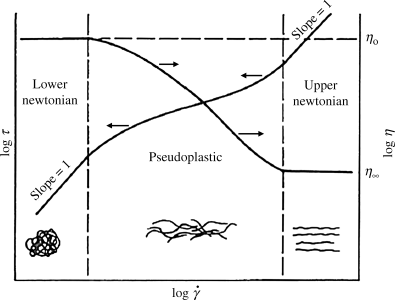
Intense shearing eventually leads to extensive breakage of main-chain bonds, that is, mechanical degradation. Furthermore, differentiation of Equation 13.3 with respect to time reveals that the rate of viscous energy dissipation per unit volume is equal to  It thus becomes exceedingly difficult to maintain the temperature constant under intense shearing, therefore good data that illustrate the upper-Newtonian region are relatively rare, particularly for polymer melts.
But what happens to the highly oriented molecules when the shear is removed? The randomizing effect of thermal energy tends to return them to their low-shear configurations, giving rise to an elastic retardation.
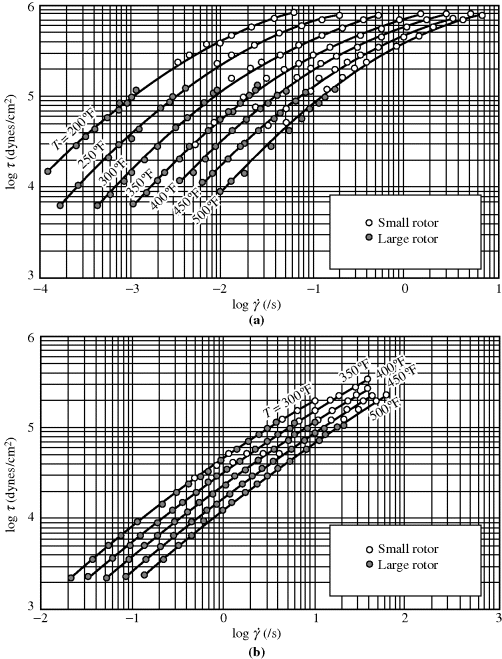
Some actual flow curves for polymer melts are shown in Figure 14.6 [9]. The data cover only a portion of the general range described above, because very few instruments are capable of obtaining data over the entire range. The polyisobutylene data cover the transition from lower Newtonian to pseudoplastic regions but the polyethylene data are confined to the pseudoplastic region. No trace of the upper Newtonian region is seen for either material at the shear rates investigated.
Figure 14.6 Flow curves for polymer melts [9]: (a) L-80 polyisobutylene; and (b) low-density polyethylene.
14.6 Quantitative Representation of Flow Behavior
To handle non-Newtonian flow analytically, it is desirable to have a mathematical expression relating τ, η, and  , as Newton's law does for Newtonian fluids. A wide variety of such constitutive relations has been proposed, both theoretical and empirical [2, 5, 10]. All appear to fit at least some experimental data over a limited range of shear rates, but, in general, the more adjustable parameters in the equation, the better fit it provides. (There is an old saying that with six adjustable constants, you can draw an elephant, and with a seventh, make his trunk wave.) The mathematical complexity of the equations increases greatly with the number of parameters, soon outstripping the available data to establish the parameters and making the equations impractical for engineering calculations.
The traditional engineering model for purely viscous non-Newtonian flow is the so-called power law:
(14.6a) 
This is a two-parameter model, the adjustable parameters being the consistency K and the flow index n. As written above, the dimensions of K depend on the magnitude of n (dimensionless), so if you are a dimensional purist, the power law may be written as
(14.6b) 
This way, K has the usual viscosity units.
On log τ versus log  coordinates, a power-law fluid is represented by a straight line with slope n. Thus, for n = 1, it reduces to Newton's law; for n < 1, the fluid is pseudoplastic, and for n > 1, the fluid is dilatant. The power law can reasonably approximate only portions of actual flow curves over one or two decades of shear rate (see Figure 14.6), but it does so with fair mathematical simplicity and has been adequate for many engineering purposes. Many useful relations have been obtained simply by replacing Newton's law with the power law in the usual fluid-dynamic equations.
The Carreau model [2] is a four-parameter model that can represent the features of the general flow curve in Figure 14.5. Here,
The parameter λc is a time constant or characteristic time, and ηo and η∞ represent the viscosity, η, when « 1 and
  » 1, respectively. For mid-range values of
  , the equation generates a power-law region with a log–log slope of n−1. This model has been quite successful in fitting data for polymer melts and solutions over at least three or four decades of shear rate.
Not long ago, an equation with four constants would have been deemed excessively complex for engineering calculations, but the computer does not mind a bit. Actually, in many practical applications, the shear rates don not get high enough to approach the upper-Newtonian region, and a truncated (three-parameter) form of the Carreau equation, with η∞ = 0, is adequate.
The (much) “modified Cross” model [11] has seen increasing application in recent years:
This is a three-parameter model, with the constant C having the dimensions of a reciprocal modulus (area/force). The product Cηo has dimensions of time and may be thought of as a time constant or characteristic time. At low shear rates, η → ηo, and at high shear rates, it gives a power-law region with a log–log slope of n−1.
The great virtue of this model is that unlike other models, it explicitly incorporates the dependence of viscosity on temperature as well as shear rate through the temperature dependence of the zero-shear viscosity (to be discussed shortly). Equation (14.8) is written to emphasize that point. This makes it particularly well suited for nonisothermal flow calculations.
As will be illustrated later, certain important calculations (e.g., the determination of velocity profiles and flow rates in tubes) are facilitated by flow equations that are explicit in τ, that is, have the form  =
=  (τ) or η = η(τ). The power law can be written in either form. Some of the equations not given here are in or can be put in one of these forms. Unfortunately, they tend not to fit data as well as the Carreau and modified Cross equations, neither of which can be made explicit in τ. This has led to the practice of fitting flow data with polynomials such as
or
where ai and bi are functions of temperature.
In principle, this is applicable and can give good fits, but in practice, two cautions are in order. First, it is easy to get carried away and include more terms in the equation than are justified by the data. This leads to the fitting of experimental scatter. Second, great care must be exercised when extrapolating the equations beyond the range of data used to determine them. Uncritical extrapolation can lead to artifacts such as shear stresses that decrease with increasing shear rate and negative viscosities, that violate both common sense and the second law of thermodynamics. These problems are less likely to arise when an established flow equation is used.
14.7 Temperature Dependence of Flow Properties
If you consider the number of processes that use molten polymers (e.g., injection-molded CDs), it is obvious that the temperature dependence of flow properties must be understood. The temperature dependence of the zero-shear viscosity can often be represented by the relation:
where E is the activation energy for viscous flow.
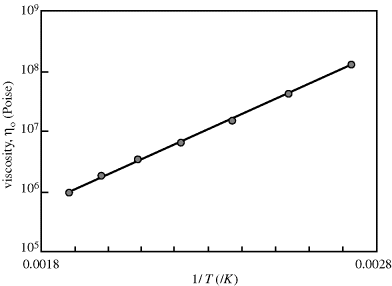
The ηo's from Ref. [12] are plotted according to Equation (14.10) in Figure 14.7. The fit is quite good. The slope is E/2.303R, from which E = 11.4 kcal/mol. Thus, the combination of Equations (14.10) and (14.8) does a pretty good job of describing both the shear rate and the temperature dependence of the viscosity, at least for these data.


Figure 14.7 Temperature dependence of zero-shear viscosity. Zero-shear viscosities from modified Cross fits to the L-80 polyisobutylene data from Figure 14.6a [9] and plotted according to Equation (14.10).
Temperature is therefore an effective means of controlling melt viscosity in processing operations, but two drawbacks must be kept in mind: (1) it takes time and costs money to put in and take out thermal energy, and (2) excessive temperature can lead to degradation of the polymer.
The famous Williams–Landell–Ferry (WLF) equation [13] is useful for describing the temperature dependence of several linear mechanical properties of polymers (see Chapter 16). For the zero-shear viscosity, it may be written as
where T* is a reference temperature. If the reference temperature is chosen as the glass transition temperature, T* = Tg, the “universal” constants C1 = 17.44 and C2 = 51.6 (with T's in K) give a rough fit for a wide variety of polymers. The WLF equation is most useful in this form because Tg is extensively tabulated for many polymers [14]. Better fits can be obtained by using constants specific to the polymer, but these constants are less readily available. It has also been suggested that the fit can be improved by using C1 = 8.86 and C2 = 101.6, with T* adjusted to fit specific data, if available. When this is done, T* generally turns out to be Tg + (50 ± 5) °C [2]. Whichever constants are used, application of the WLF equation should be limited to the range Tg < T < Tg + 100 °C. The WLF Equation (14.11) can also be used in conjunction with Equation (14.8). However, Equation (14.10) often gives a better fit of ηo versus T data than Equation (14.11).
The modified Cross equation gives the temperature dependence of viscosity at finite shear rates. With other equations, the temperature dependence of all the constants would have to be known. Another approach has used an equation that is independent of any model for the flow curve. Since the viscosity is a function of temperature and shear stress or shear rate:

By analogy to Equation (14.10), these functions are approximated by
(14.12a) 
(14.12b) 
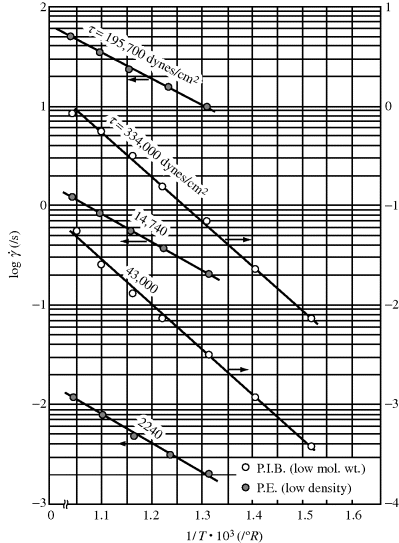
where Eτ is the activation energy for flow at constant shear stress and  is the activation energy for flow at constant shear rate. Figure 14.8 shows plots of log
  versus 1/T at constant τ for L-80 polyisobutylene and low-density polyethylene (taking data for a constant τ from Figure 14.6) [9]. Since each of these data sets can fit to a straight line, the shear rate,
  follows Arrhenius behavior for PIB and PE. Since
  = τ/η, the slope of these lines is Eτ/2.303R.
Figure 14.8 Temperature dependence of shear rate at constant shear stress [9].
It will be left as an end-of-chapter exercise to show that Eτ >  . In the limit τ→0,
  → 0 for all Newtonian fluids, Eτ =
  = E (see note1).
14.8 Influence of Molecular Weight on Flow Properties
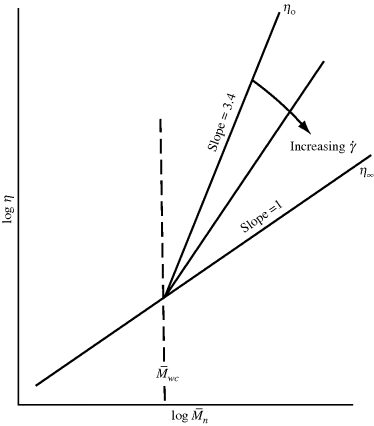
It should be of no surprise that the larger the polymer, the more viscous the solution (after all, that is one way we used to estimate molecular weights in Chapter 5). It has long been known that the molecular weight has a strong influence on both the melt and the solution viscosities of polymers. Experiments show that the viscosity can be scaled to the weight-average molecular weights through
where  wc is a critical average molecular weight, thought to be the point at which molecular entanglements begin to dominate the rate of slippage of the molecules. It depends on the temperature and polymer type, but most commercial polymers are well above
  wc.
wc.
Equation (14.13a) quantitatively holds for just about all polymer melts. The addition of a low molecular weight solvent, of course, cuts down the entanglements and raises  wc. Equation 7.15 suggests that entanglements set in when the dimensionless product of intrinsic viscosity and concentration (the Berry number) exceeds one, [η]c >1. Thus, if you know [η] for your polymer in the solvent, you can get an idea of the concentration above which Equation (14.13b) should be used (and the viscosity rises much more sharply!). In practice, even moderately concentrated (say 25% or more) polymer solutions have viscosities proportional to
  w3.4, provided that
  w is in the range of commercial importance.
 wc to concentration and the MHS constants (Equation 5.18) for polymer solutions.
 w =
w =  v (see Example 5.4). Thus,
Figure 14.9 The effect of molecular weight on viscosity.
 w be changed to cut the zero-shear viscosity, ηo, in half?

14.9 The Effects of Pressure on Viscosity
For all fluids, viscosity increases with increasing pressure, as the free volume and, hence, the ease of molecular slippage is decreased. With liquids, including polymer melts, because of their relative incompressibility, the effect becomes noticeable only at fairly high pressures (hundreds of atmospheres). Nevertheless, such pressures are reached in certain processes (e.g., injection molding) and in certain types of capillary viscometers (later in this chapter). Available data have been fit by
where α and β are constants. Equation (14.14) may be combined with Equation (14.10) to give an equation that expresses both the temperature and pressure dependence of zero-shear viscosity:
Presumably, Equation (14.15) could be used in conjunction with Equation (14.8) to express viscosity as a function of  , T, and P, but for pressure, there is as yet little experimental justification for this.
Carley [15] has critically reviewed work on polymer melts and concludes that pressure effects are of minor significance in most processing situations, provided the temperature is not too close to a transition. High pressures raise both Tg and Tm slightly, and, of course, the viscosity shoots up tremendously as either is approached.
14.10 Viscous Energy Dissipation
Regardless of the viscometric technique, determination of the true, isothermal flow properties at high shear rates can be complicated by high rates of viscous energy dissipation, which make them hard to maintain isothermal conditions. If we divide both sides of Equation 13.3 by V dt, we see that the rate of viscous energy dissipation per unit volume  is
is
(14.16) 
 .
. is given by the rate of energy dissipation per unit volume divided by the volumetric heat capacity, ρcp, as follows:
Not only is temperature rise an important consideration in viscometry, where great care must be taken in the design of viscometers to permit adequate temperature regulation, but it must also be taken into account in the design of process equipment. In the steady-state operation of extruders, for example, virtually all of the energy required to melt and maintain the polymer in the molten state is supplied by the mechanical drive. Here, however, we will limit our considerations to isothermal flows.
14.11 Poiseuille Flow
Axial, laminar (Poiseuille) flow in a tube of cylindrical cross section is another example of a viscometric flow field. Here, geometry dictates the use of cylindrical coordinates. Fluid motion is in the x (“1”) direction along the tube axis, the velocity gradient is directed everywhere in the outward radial r (or “2”) direction, and the mutually perpendicular or neutral direction is the tangential θ (or “3”) coordinate. Consider a cylindrical fluid element of radius r and length dx (Figure 14.10). Assume that the pressure in the fluid is a function of the distance along the tube (x coordinate) only. The net pressure force pushing the element in the x direction is the differential pressure drop across the element, −dP, times the area of the element's ends, πr2. The motion of the element is resisted by a shear force at its surface, which is the product of the shear stress, τrx, and the surface area of the cylinder, 2πr dx. In the steady-state flow, these forces must balance, so
(14.18) 
Figure 14.10 Force balance on an element in a cylindrical tube.

Thus, the dependence of shear stress on radius (denoted τ(r)) is
For a tube with inner radius R (dropping the rx subscript on shear stress),
where τw is the shear stress at the tube wall (r = R) and
(14.21) 
Therefore, the shear stress varies linearly with radius from zero at the tube center to a maximum of τw = −(R/2) (dP/dx) at the tube wall. Note that this result does not depend in any way on the fluid properties.
Since the axial fluid velocity u is a function of the radial position only (denoted u(r)), we may write
(14.22) 
Integrating with the boundary conditions u(R) = 0 (i.e., the fluid sticks to the wall) and u at radius r = u(r) gives
(14.23) 
Realizing that the velocity gradient (du/dr) is the shear rate  (just replace y with r in Eq. (14.2)), we find that
where τ(r) is given by Equation (14.19). The functions  (τ) or η(τ) represent the material's steady-state viscous properties or flow curve, as discussed earlier. So, for a given pressure gradient, the velocity profile in the tube may always be calculated from the flow curve by
 (or η) at the τ above from the flow curve,
 (r) (or τ(r)/η(r)), and
If an analytic representation of the flow curve is available, Equation (14.24) may be integrated directly (provided the representation is simple enough). For example (verification will be left as an exercise for the reader, as they say in the math books), for a power-law fluid  (τ) = (τ/K)1/n and
Equation (14.25) reduces to the familiar Newtonian parabolic profile for n = 1.
Note that the above calculations are facilitated if the flow curve can be written as an explicit function of τ, that is, in the form  or η = η (τ). Although the power law meets that criterion, neither the Carreau Equation (14.7) nor the modified Cross Equation (14.8) meets the same. For this reason, it is sometimes viewed as being easier to fit data with a polynomial such as Equations (14.9a) or (14.9b), rather than to use an established constitutive equation to make these calculations (but note the cautions!).
Looking at a differential ring of the tube cross section, with thickness dr, located at radius r, where the velocity is u(r) (Figure 14.11), the differential volumetric flow rate is:
Figure 14.11 Determination of volumetric flow rate.

(14.26) 
where u(r) is the local velocity and 2πr dr is the area of the differential ring. Integrating over the tube cross section gives
Therefore, knowing the velocity profile allows calculation of the volumetric throughput Q. For a power-law fluid, insertion of Equation (14.25) into Equation (14.27) and turning the crank gives
The average velocity V in the tube is defined by
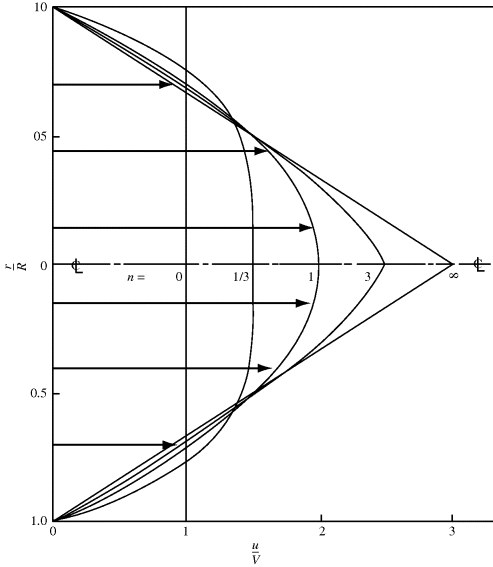
Velocity profiles for power-law fluids in a tube are plotted in a dimensionless form in Figure 14.12 for several values of n. The greater the degree of pseudoplasticity (i.e., the lower n), the flatter the profile becomes. For a Netwonian fluid, where n = 1, the profile is parabolic.
Figure 14.12 Velocity profiles for the laminar flow of power-law fluids in tubes.
Further development of flow curves for polymer melts are discussed in more advanced rheology texts. Compared with many regular fluids, where simplifying assumptions can be used in the analysis of flow behavior, the significant of viscous dissipation for polymers must be considered as must entrance effects, where the polymer melt first enters a tube. However, successful models have been developed that even allow scale-up for commercially relevant processes.
14.12 Turbulent Flow
Due to the viscosity of polymer melts (and most solutions), laminar flow is all that you would expect to see (recall that viscosity is in the denominator of the Reynolds number (Re) and that large Re is required for turbulent flow). However, turbulent flow can be encountered in dilute polymer solutions. As with the turbulent flow of Newtonian fluids, pressure drops are conveniently handled in terms of the Fanning friction factor:
(The dimensional constant gc = 32.2 ft·lbm/lbf·s2 is included here because these equations are still sometimes used with the English engineering system of units; in SI units, gc = 1 kg·m/N·s2.) Since τw = (R/2)(dP/dx) (the minus sign has been dropped, it being understood that flow is in the direction of decreasing pressure), then
Equations (14.30) and (14.31) apply to all fluids in both laminar and turbulent flow.
The next question is, “how do you define a Reynolds number for a fluid that has a variable viscosity?” Metzner and Reed [16] proposed that the known relation between the friction factor and the Reynolds number for the laminar flow of Newtonian fluids may be applied to the laminar flow of non-Newtonians as well:
Since Equation (14.32) has been defined to apply to all fluids in laminar flow, it may now be used to obtain a generalized Reynolds number––applicable to all fluids in both laminar and turbulent flow––by combining it with Equation (14.31) as follows:
For a power-law fluid,  combined with Equations (14.20), (14.28), and (14.29) give
(14.34) 
Equation 14.41 reduces to the familiar Newtonian relation, Re = ρ V D/η, with η = K = K', when n = 1.
Equations (14.30)–(14.33) by definition should describe the behavior of all fluids in steady-state laminar viscous flow. They do so, provided that the true steady-state pressure gradient is used in Equation (14.30) [17]. Approximation of the steady-state gradient by ΔP/L can sometimes cause considerable error.
14.13 Drag Reduction
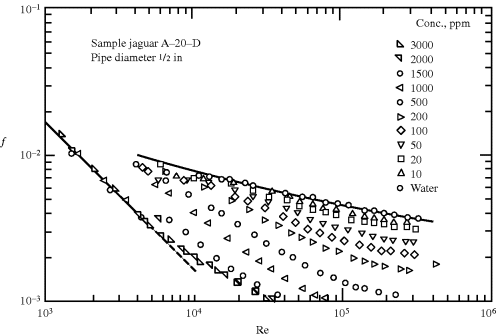
Having defined the Reynolds number for non-Newtonian fluids, it would be nice to be able to say that one could then use the standard friction factor–Reynolds number correlations for solving turbulent flow calculations. Such is not always the case, however, because of a startling phenomenon known as drag reduction that is often observed in the turbulent flow of non-Newtonian fluids (Figure 14.13) [18] Small quantities of a polymeric solute can cut the friction factor significantly at higher Reynolds numbers, despite the fact that the solution viscosity is only slightly greater than that of the solvent. For example, 200 ppm of guar gum (a natural, water-soluble polymer) reduces the friction factor in Figure 14.13 by approximately a factor of five at Re = 105, while the viscosity of the solution is 24% greater than that of pure water.
Figure 14.13 Turbulent drag reduction as evidenced by a drop in friction factors with the addition of polysaccharides to water [18]. Copyright 1972 by the American Chemical Society. Reprinted with permission of the copyright owner.
The drag reduction phenomenon has important practical applications. Pressure drops, and therefore pumping costs, can be reduced for a given flow rate or the capacity of a pumping system (e.g., the Trans-Alaska pipeline) can be increased by the addition of a drag-reducing solute. Fire departments add poly(ethylene oxide) to their pumpers to increase capacity. Experiments have also been conducted with the aim of increasing ship speed by squirting out a drag-reducing additive at the bow.
It has been suggested that drag reduction may be due to thickening of the laminar sublayer (boundary layer at the liquid/solid interface) caused by the elasticity of the polymer molecules (those polymer solutions that seem relatively inelastic are more likely to be amenable to the usual treatment). It has also been pointed out that most of the energy dissipation in turbulent flows occurs in small, high-frequency eddies. At these frequencies (the reciprocals of which are smaller than the material's relaxation time, giving high Deborah numbers, see Chapter 15), the material responds elastically (such as bouncing the Silly Putty rather than letting it flow down the wall), passing the stored elastic energy from eddy to eddy rather than dissipating it. Very high elongational viscosities of polymer solutions have also been implicated, even though the regular (shear) viscosities of the solutions are not much higher than those of the solvent.
Drag reduction is known to be most pronounced for solutions of high molecular weight, flexible-chain polymers, possibly because these form highly elastic solutions. Its magnitude is markedly reduced as the polymers are physically degraded by continued shear during flow. The effects of polymer molecular variables have already been discussed [19]. On the other hand, drag reduction has also been observed with slurries of rigid particles or fibers in Newtonian fluids. Perhaps, there is more than one cause.
As with Newtonian fluids, it is a pretty safe bet that flow is laminar for Re < 2100, but drag-reducing additives often seem to delay the laminar-turbulent transition to higher Re's. The friction factor–Reynolds number relation remains a function of pipe roughness. Unlike the Newtonian case, though, the f–Re curve seems to depend on the pipe diameter when drag reduction is observed.
Unfortunately, the bottom line is that at present, in the absence of experimental data, there are no quantitative methods for predicting which polymeric solutes will produce drag reduction in a particular solvent, over what range of concentrations drag reduction will be observed, or what its magnitude will be. Fortunately, neglecting drag reductions gives conservative designs; any drag reduction that does occur will be a bonus in terms of increased flow rate and/or reduced pressure drop.
14.14 Summary
This chapter has introduced the field of rheology, where the flow of polymer solutions and melts are studied. Polymers make for complex flow behavior, as their fluids are generally non-Newtonian and their viscosity changes with shear rate. The flow behavior can change with time and is dependent (at least to some degree) on temperature, pressure, and molecular weight. This makes the measurement of the viscosity of polymeric fluids particularly difficult. Methods used to measure viscosity and the rheological behavior of polymers are covered in Chapter 16. While this chapter serves as an introduction to rheology, there are numerous books and entire college courses on this subject.
Problems
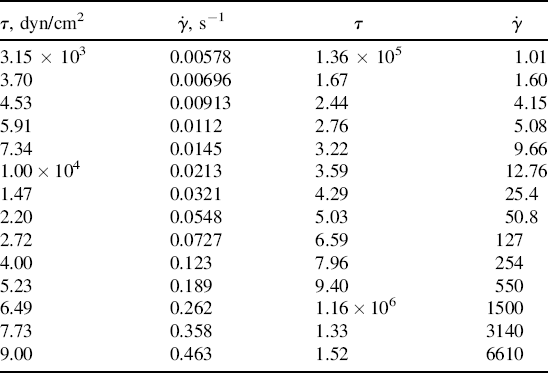
 w = 80,000. Its ηo = 6.67 × 10⁶ P at 350 °F.
| τ, dyn/cm2 |  , s−1 , s−1 |
| 365 | 415 |
| 434 | 748 |
| 471 | 929 |
| 536 | 1360 |
| 566 | 1630 |
| 616 | 2110 |
| 653 | 2360 |
| 695 | 2710 |
| 748 | 3400 |

 and that in the low-shear limit and for all Newtonian fluids,
  Hint: Consider viscosity to be a function of temperature and either shear rate or shear stress, and write an expression for its total differential.
 for a power-law fluid?
 data for five essentially monodisperse polystyrenes of different molecular weight. Do these data better fit the Carreau or modified Cross equations? Stratton obtains η o values by extrapolating plots of η versus τ to τ = 0. Do these equations give substantially different values? Stratton's values at 183 °C are as follows:
 |
 |
| 0.48 | 0.153 |
| 1.17 | 2.88 |
| 1.79 | 12.4 |
| 2.17 | 21.9 |
| 2.42 | 33.5 |

 w = 400,000, what can you say about the
  w of a different grade of the same polymer that will allow adequate processing at 450 K?
 , where τy is a yield stress that must be exceeded to cause flow. Sketch the log τ versus log
  and log η versus log
  for a Bingham plastic, showing limiting behavior at low and high
  .
.

Notes
1. Note: The variable E in this chapter refers to the activation energy for flow (which is important when studying rheology). However, the modulus of elasticity, which is a measure of mechanical strength, is also represented by E, as first introduced in Chapter 13.
1. Barnes, H.A., J.F. Hutton, and K. Walters, An Introduction to Rheology, Elsevier, New York, 1989.
2. Bird, R.B., R.C. Armstrong, and O.A. Hassager, Dynamics of Polymeric Liquids, Vol. 1, Fluid Mechanics, Wiley, New York, 1977.
3. Coleman, B.D., H. Markovitz, and W. Noll, Viscometric Flows of Non-Newtonian Fluids, Springer, New York, 1966.
4. Christensen, R.M., Theory of Viscoelasticity: An Introduction, Academic, New York, 1971.
5. Darby, R., Viscoelastic Fluids, Dekker, New York, 1976.
6. Dealy, J.M. and K.F. Wissbrun, Melt Rheology and Its Role in Plastics Processing, Van Nostrand Reinhold, New York, 1960.
7. Middleman, S., The Flow of High Polymers, Interscience, New York, 1968.
8. Tanner, R.I., Engineering Rheology, Oxford University Press, New York, 1985.
9. Best, D.M. and S.L. Rosen, Polym. Eng. Sci. 8 (2), 116 (1968).
10. Bird, R.B., W.E. Stewart, and E.N. Lightfoot, Transport Phenomena, Wiley, New York, 1960, p. 94, Example 3.5-1.
11. Tseng, H.C., et al., Preprints, Soc. Plast. Engrs. Annu. Tech. Conf., 1985, p. 716.
12. Best, D.M., Thesis, Carnegie Institute of Technology, Pittsburg, PA, 1966.
13. Tobolsky, A.V., Properties and Structure of Polymers, Wiley, New York, 1960, Chapter II.8.
14. Brandrup, J. and E.H. Immergut (eds), Polymer Handbook, 3rd ed., Wiley-Interscience, New York, 1989.
15. Carley, J.F., Modern Plastics 39 (4), 123 (1961).
16. Metzner, A.B. and J.C. Reed, Am. Inst. Chem. Eng. J. 1, 434 (1955).
17. Patterson, G.K., J.L. Zakin, and J.M. Rodriguez, Ind. Eng. Chem. 61 (1), 22 (1969).
18. Sellin, R.H.J. and R.T. Moses, Drag Reduction in Fluid Flows, Techniques for Friction Control, Ellis Horwood, Chichester (distributed by Wiley, NY), 1989.
19. Zakin, J.L. and D.L. Hunston, J. Macromol. Sci.-Phys., B18 (4), 795 (1980).


