 ethical issues
Questionnaires |
CHAPTER 20 |
The field of questionnaire design is vast. This chapter provides a straightforward introduction to its key elements, indicating the main issues to be addressed, some important problematical considerations and how they can be resolved. It follows a sequence in designing a questionnaire that, it is hoped, will be useful for researchers, thus:
ethical issues
approaching the planning of a questionnaire
operationalizing the questionnaire
structured, semi-structured and unstructured questionnaires
types of questionnaire items
closed and open questions compared
scales of data
the dangers of assuming knowledge
dichotomous questions
multiple choice questions
rank ordering
rating scales
constant sum questions
ratio data questions
open-ended questions
matrix questions
contingency questions, filters and branches
asking sensitive questions
avoiding pitfalls in question writing
sequencing questions
questionnaires containing few verbal items
the layout of the questionnaire
covering letters/sheets and follow-up letters
piloting the questionnaire
practical considerations in questionnaire design
administering questionnaires
self-administered questionnaires
postal questionnaires
processing questionnaire data
It is suggested that researchers may find it useful to work through these issues in sequence, though, clearly, a degree of recursion is desirable.
We advise readers to take this chapter together with the other chapters in this book on surveys, sampling and interviewing. Indeed Chapter 13 (Surveys) addresses important materials on online questionnaires, and we advise readers to consult that in detail. Part 5 concerns data analysis, and this can include analysis of quantitative and qualitative data.
The questionnaire is a widely used and useful instrument for collecting survey information, providing structured, often numerical data, being able to be administered without the presence of the researcher, and often being comparatively straightforward to analyse (Wilson and McLean, 1994). These attractions have to be counterbalanced by the time taken to develop, pilot and refine the questionnaire, by the possible unsophistication and limited scope of the data that are collected, and from the likely limited flexibility of response (though, as Wilson and McLean (1994: 3) observe, this can frequently be an attraction). The researcher will have to judge the appropriateness of using a questionnaire for data collection, and, if so, what kind of questionnaire it should be.
The questionnaire will always be an intrusion into the life of the respondent, be it in terms of time taken to complete the instrument, the level of threat or sensitivity of the questions, or the possible invasion of privacy. Questionnaire respondents are not passive data providers for researchers; they are subjects not objects of research. There are several sequiturs that flow from this.
Respondents cannot be coerced into completing a questionnaire. They might be strongly encouraged, but the decision whether to become involved and when to withdraw from the research is entirely theirs. Their involvement in the research is likely to be a function of:
a their informed consent (see Chapter 5 on the ethics of educational research);
b their rights to withdraw at any stage or not to complete particular items in the questionnaire;
c the potential of the research to improve their situation (the issue of beneficence);
d the guarantees that the research will not harm them (the issue of non-maleficence);
e the guarantees of confidentiality, anonymity and non-traceability in the research;
f the degree of threat or sensitivity of the questions (which may lead to respondents’ over-reporting or under-reporting (Sudman and Bradburn, 1982: 32 and Chapter 3));
g factors in the questionnaire itself (e.g. its coverage of issues, its ability to catch what respondents want to say rather than to promote the researcher’s agenda), i.e. the avoidance of bias and the assurance of validity and reliability in the questionnaire – the issues of methodological rigour and fairness. Methodological rigour is an ethical not simply a technical matter (Morrison, 1996b), and respondents have a right to expect reliability and validity;
h the reactions of the respondent, for example, respondents will react if they consider an item to be offensive, intrusive, misleading, biased, misguided, irritating, inconsiderate, impertinent or abstruse.
These factors impact on every stage of the use of a questionnaire, to suggest that attention has to be given to the questionnaire itself, the approaches that are made to the respondents, the explanations that are given to the respondents, the data analysis and the data reporting.
At this preliminary stage of design, it can sometimes be helpful to use a flow chart technique to plan the sequencing of questions. In this way, researchers are able to anticipate the type and range of responses that their questions are likely to elicit. In Figure 20.1 we illustrate a flow chart employed in a commercial survey based upon an interview schedule, though the application of the method to a self-completion questionnaire is self-evident.
On a more positive note, Sellitz and her associates (1976) have provided a fairly exhaustive guide to researchers in constructing their questionnaires which we summarize in Box 20.1.
These are introductory issues, and the remainder of this chapter takes each of these and unpacks them in greater detail. Additionally, one can set out a staged sequence for planning a questionnaire, thus:
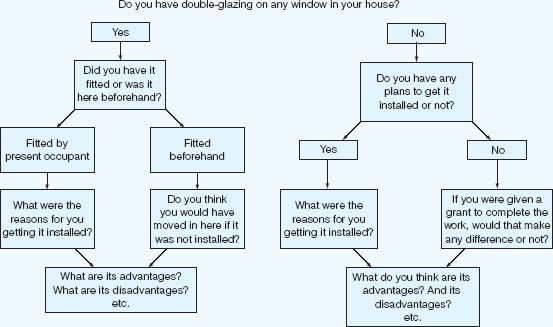
FIGURE 20.1 A flow chart technique for question planning
Source: Social and Community Planning Research, 1972
1 Decide the purposes/objectives of the questionnaire.
2 Decide the population and the sample (as questions about their characteristics will need to be included on the questionnaire under ‘personal details’).
3 Generate the topics/constructs/concepts/issues to be addressed and data required in order to meet the objectives of the research (this can be done from literature, or a pre-pilot, for example, focus groups and semi-structured interviews).
4 Decide the kinds of measures/scales/questions/responses required.
5 Write the questionnaire items.
6 Check that each issue from (3) has been addressed, using several items for each issue.
7 Pilot the questionnaire and refine items as a consequence.
8 Administer the final questionnaire.
Within these stages there are several sub-components, and this chapter addresses these.
The process of operationalizing a questionnaire is to take a general purpose or set of purposes and turn these into concrete, researchable fields about which actual data can be gathered. First, a questionnaire’s general purposes must be clarified and then translated into a specific, concrete aim or set of aims. Thus, ‘to explore teachers’ views about in-service work’ is somewhat nebulous, whereas ‘to obtain a detailed description of primary and secondary teachers’ priorities in the provision of in-service education courses’ is reasonably specific.
A Decisions about question content
1 Is the question necessary? Just how will it be useful?
2 Are several questions needed on the subject matter of this question?
3 Do respondents have the information necessary to answer the question?
4 Does the question need to be more concrete, specific and closely related to the respondent’s personal experience?
5 Is the question content sufficiently general and free from spurious concreteness and specificity?
6 Do the replies express general attitudes and only seem to be as specific as they sound?
7 Is the question content biased or loaded in one direction, without accompanying questions to balance the emphasis?
8 Will the respondents give the information that is asked for?
B Decisions about question wording
1 Can the question be misunderstood? Does it contain difficult or unclear phraseology?
2 Does the question adequately express the alternative with respect to the point?
3 Is the question misleading because of unstated assumptions or unseen implications?
4 Is the wording biased? Is it emotionally loaded or slanted towards a particular kind of answer?
5 Is the question wording likely to be objectionable to the respondent in any way?
6 Would a more personalized wording of the question produce better results?
7 Can the question be better asked in a more direct or a more indirect form?
C Decisions about form of response to the question
1 Can the question best be asked in a form calling for check answer (or short answer of a word or two, or a number), free answer or check answer with follow-up answer?
2 If a check answer is used, which is the best type for this question – dichotomous, multiple choice (‘cafeteria’ question), or scale?
3 If a checklist is used, does it cover adequately all the significant alternatives without overlapping and in a defensible order? Is it of reasonable length? Is the wording of items impartial and balanced?
4 Is the form of response easy, definite, uniform and adequate for the purpose?
D Decisions about the place of the question in the sequence
1 Is the answer to the question likely to be influenced by the content of preceding questions?
2 Is the question led up to in a natural way? Is it in correct psychological order?
3 Does the question come too early or too late from the point of view of arousing interest and receiving sufficient attention, avoiding resistance, and so on?
Source: Adapted from Sellitz et al, 1976
Having decided upon and specified the primary objective of the questionnaire, the second phase of the planning involves the identification and itemizing of subsidiary topics that relate to its central purpose. In our example, subsidiary issues might well include: the types of courses required; the content of courses; the location of courses; the timing of courses; the design of courses; and the financing of courses.
The third phase follows the identification and itemization of subsidiary topics and involves formulating specific information requirements relating to each of these issues. For example, with respect to the type of courses required, detailed information would be needed about the duration of courses (one meeting, several meetings, a week, a month, a term or a year), the status of courses (non-award bearing, award bearing, with certificate, diploma, degree granted by college or university), the orientation of courses (theoretically oriented involving lectures, readings, etc., or practically oriented involving workshops and the production of curriculum materials).
What we have in the example, then, is a move from a generalized area of interest or purpose to a very specific set of features about which direct data can be gathered. Wilson and McLean (1994: 8–9) suggest an alternative approach which is to identify the research problem, then to clarify the relevant concepts or constructs, then to identify what kinds of measures (if appropriate) or empirical indicators there are of these, i.e. the kinds of data required to give the researcher relevant evidence about the concepts or constructs, e.g. their presence, their intensity, their main features and dimensions, their key elements, etc.
What unites these two approaches is their recognition of the need to ensure that the questionnaire: (a) is clear on its purposes; (b) is clear on what needs to be included or covered in the questionnaire in order to meet the purposes; (c) is exhaustive in its coverage of the elements of inclusion; (d) asks the most appropriate kinds of question (discussed below); (e) elicits the most appropriate kinds of data to answer the research purposes and sub-questions; (f) asks for empirical data.
When planning a questionnaire it is important to plan so that the questionnaire is set up – structured – in such a way that the data analysis can proceed as planned. So, for example, if the researcher wishes to conduct multiple regression (e.g. to find out the relative weights of a range of independents variables on a dependent variable, for example the relative strength of three independent variables – teaching preparation, teacher/student relationships and subject knowledge – on the dependent variable of teaching effectiveness) then both the independent and dependent variables must be included in the questionnaire. This might appear thus (though the questions below may appear to be leading questions, the student is given the option of scoring a zero, i.e. ‘not at all’):
A general question (dependent variable): ‘Overall, how effective do you think the teaching is in this Mathematics department?’
A specific question (independent variable): ‘How well prepared for her/his teaching is the Mathematics teacher?’
A specific question (independent variable): ‘How positive are the teacher/student relationships in the Mathematics department?’
A specific question (independent variable): ‘How well do you think that the teacher knows his/her subject in the Mathematics department?’
Let us imagine that there is an 11-point scale, where zero (‘0’) means ‘not at all’ and 10 means ‘very much’. Here the scales are the same (11 points), the dependent variable is included, and each independent variable is included. Whilst this sounds like common sense, our experience has led to us make this point, as too many times students omit the dependent variable.
As a second example, let us imagine that the researcher is investigating the reason why undergraduate students take part-time jobs (cf. Morrison and Tam, 2005). She asks the general question (dependent variable): ‘What are your main reasons for taking part-time jobs? Please indicate the level of importance of each of the following reasons by encircling the appropriate rating (0–10), where 0=“Of no importance” and 10=“of very great importance”‘. She then asks respondents to give a score out of 10 for the importance of each of several possible reasons for taking a part-time job (independent variables), for example:
meet necessary study expenses
meet living expenses
purchase better consumer products
support entertainment expenses
for extra money to spend
support family expenses
gain job experience
fill-in spare time
affected by peer group.
She can then conduct a multiple regression to see the relative importance of each of these independent variables on the dependent variables (e.g. using standardized beta values, discussed in Part 5 of this book).
If the researcher wishes to conduct factor analysis then the variables must be at the ratio level of data (discussed below). If structural equation modelling is required then both variables and factors have to be calculated, and these have to be able to be calculated in the questionnaire. If simple frequencies, percentages and correlations are to be calculated then the questions must be framed in such a way that they can be calculated. This is a statement of the obvious, but, in our experience, too many students neglect the obvious.
A researcher may not wish to conduct such high-level data analysis, and often simple frequencies will suffice and will be very persuasive. This, too, can suggest causality (though not prove it – see Chapter 4), or, at least correlation. Let us imagine that the researcher is looking into the effects of communication on leadership in a very large secondary school (160 teachers). She asks three simple questions:
1 Generally, how effective is the overall leadership in the school (tick one only):
 Good Not Good
2 Generally, how effective is the principal’s communication in the school (tick one only):
Good Not Good
3 Generally, how willing to communicate is the school principal (tick one only):
Good Not Good
These simple dichotomous questions require respondents to come to a judgement; they are not permitted to ‘sit on the fence’, they have to make up their minds. In tabular form, the results could be presented as shown in Table 20.1 (fictitious figures). In Table 20.1 ‘effective leadership’ is reported by 82 respondents (51.2 per cent) (45 + 15 + 10 + 12); ‘not good’ leadership is reported by 78 respondents (48.8 per cent) (3 + 12+5+58). Table 20.1 indicates that, for ‘good’ leadership to be present in its strongest form requires the factors ‘principal’s communication’ and ‘willingness to communicate’ to be present and ‘good’, and that if either or both of these factors is ‘not good’ then ‘good’ knowledge management drops dramatically.
The point to be made here is that the questionnaire is designed – set up – with the analysis in mind; the researcher knows in advance how she wants to analyse the data, and the structure and contents of the questionnaire follow from this.
Though there is a large range of types of questionnaire, there is a simple rule of thumb: the larger the size of the sample, the more structured, closed and numerical the questionnaire may have to be, and the smaller the size of the sample, the less structured, more open and word-based the questionnaire may be.
The researcher can select several types of questionnaire, from highly structured to unstructured. If a closed and structured questionnaire is used, enabling patterns to be observed and comparisons to be made, then the questionnaire will need to be piloted and refined so that the final version contains as full a range of possible responses as can be reasonably foreseen. Such a questionnaire is heavy on time early in the research; however, once the questionnaire has been ‘set up’ then the mode of analysis might be comparatively rapid. For example, it may take two or three months to devise a survey questionnaire, pilot it, refine it and set it out in a format that will enable the data to be processed and statistics to be calculated. However, the ‘trade-off’ from this is that the data analysis can be undertaken fairly rapidly – we already know the response categories, the nature of the data and the statistics to be used; it is simply a matter of processing the data – often using computer analysis.
TABLE 20.1 CROSSTABULATION OF RESPONSES TO TWO KEY FACTORS IN EFFECTIVE LEADERSHIP
Effective leadership |
Principal’s communication |
Willingness to communicate |
Frequency (% rounded) |
Good |
Good |
Good |
45(28.1%) |
Good |
Good |
Not good |
15(9.4%) |
Good |
Not good |
Good |
10(6.2%) |
Good |
Not good |
Not good |
12(7.5%) |
Not good |
Good |
Good |
3(1.9%) |
Not good |
Good |
Not good |
12(7.5%) |
Not good |
Not good |
Good |
5(3.1%) |
Not good |
Not good |
Not good |
58 (36.3%) |
Total |
|
|
160(100%) |
It is perhaps misleading to describe a questionnaire as being ‘unstructured’, as the whole devising of a questionnaire requires respondents to adhere to some form of given structure. That said, between a completely open questionnaire that is akin to an open invitation to ‘write what one wants’ and a completely closed, completely structured questionnaire, there is the powerful tool of the semi-structured questionnaire. Here a series of questions, statements or items are presented and the respondents are asked to answer, respond to or comment on them in a way that they think best. There is a clear structure, sequence, focus, but the format is open-ended, enabling respondents to reply in their own terms. The semi-structured questionnaire sets the agenda but does not presuppose the nature of the response.
There are several kinds of question and response modes in questionnaires, including, for example: dichotomous questions; multiple choice questions; rating scales; constant sum questions; ratio data and open-ended questions. These are considered below (see also Wilson, 1996). Closed questions prescribe the range of responses from which the respondent may choose. Highly structured, closed questions are useful in that they can generate frequencies of response amenable to statistical treatment and analysis. They also enable comparisons to be made across groups in the sample (Oppenheim, 1992: 115). They are quicker to code up and analyse than word-based data (Bailey, 1994: 118), and, often, they are directly to the point and deliberately more focused than open-ended questions. Indeed it would be almost impossible, as well as unnecessary, to try to process vast quantities of word-based data in a short time frame.
If a site-specific case study is required, then qualitative, less structured, word-based and open-ended questionnaires may be more appropriate as they can capture the specificity of a particular situation. Where measurement is sought then a quantitative approach is required; where rich and personal data are sought, then a word-based qualitative approach might be more suitable. Open-ended questions are useful if the possible answers are unknown or the questionnaire is exploratory (Bailey, 1994: 120), or if there are so many possible categories of response that a closed question would contain an extremely long list of options. They also enable respondents to answer as much as they wish, and are particularly suitable for investigating complex issues, to which simple answers cannot be provided. Open questions may be useful for generating items that will subsequently become the stuff of closed questions in a subsequent questionnaire (i.e. a pre-pilot).
In general closed questions (dichotomous, multiple choice, constant sum and rating scales) are quick to complete and straightforward to code (e.g. for computer analysis), and do not discriminate unduly on the basis of how articulate respondents are (Wilson and McLean, 1994: 21). On the other hand they do not enable respondents to add any remarks, qualifications and explanations to the categories, and there is a risk that the categories might not be exhaustive and that there might be bias in them (Oppenheim, 1992: 115).
Open questions enable participants to write a free account in their own terms, to explain and qualify their responses and avoid the limitations of pre-set categories of response. On the other hand open questions can lead to irrelevant and redundant information; they may be too open-ended for the respondent to know what kind of information is being sought; they may require much more time from the respondent to enter a response (thereby leading to refusal to complete the item), and they may make the questionnaire appear long and discouraging. With regard to analysis, the data are not easily compared across participants, and the responses are difficult to code and to classify.
We consider in more detail below the different kinds of closed and open questions.
The questionnaire designer will need to choose the metric – the scale of data – to be adopted. This concerns numerical data, and we advise readers to turn to Part 5 for an analysis of the different scales of data that can be gathered (nominal, ordinal, interval and ratio), and the different statistics that can be used for analysis. Nominal data indicate categories; ordinal data indicate order (‘high’ to low’, ‘first’ to ‘last’, ‘smallest’ to ‘largest’, ‘strongly disagree’ to ‘strongly agree’, ‘not at all’ to ‘a very great deal’); ratio data indicate continuous values and a true zero (e.g. marks in a test, number of attendances per year, hours spent on study). These are presented thus:
QUESTION TYPE |
LEVEL OF DATA |
Dichotomous questions |
Nominal |
Multiple choice questions |
Nominal |
Rank ordering |
Ordinal |
Rating scales |
Ordinal |
Constant sum questions |
Ordinal |
Ratio data questions |
Ratio |
Open-ended questions |
Word-based data |
There is often an assumption that respondents will have the information or have an opinion about the matters in which researchers are interested. This is a dangerous assumption. It is particularly a problem when administering questionnaires to children, who may write anything rather than nothing. This means that the opportunity should be provided for respondents to indicate that they have no opinion, or that they don’t know the answer to a particular question, or to state that that they feel the question does not apply to them. This is frequently a matter in surveys of customer satisfaction in social science, where respondents are asked, for example, to answer a host of questions about the services provided by utility companies (electricity, gas, water, telephone) about which they have no strong feelings, and, in fact, they are only interested in whether the service is uninterrupted, reliable, cheap, easy to pay for, and that their complaints are solved.
There is also the issue of choice of vocabulary and the concepts and information behind them. It is essential that, regardless of the type of question asked, the language and the concepts behind the language should be within the grasp of the respondents. Simply because the researcher is interested in, and has a background in, a particular topic is no guarantee that the respondents will be like-minded. The effect of the questionnaire on the respondent has to be considered carefully.
A highly structured questionnaire will ask closed questions. These can take several forms. Dichotomous questions require a ‘yes’/‘no’ response, e.g. ‘have you ever had to appear in court?’, ‘do you prefer didactic methods to child-centred methods?’. The layout of a dichotomous question can be thus:
Sex (please tick): Male Female
The dichotomous question is useful, for it compels respondents to ‘come off the fence’ on an issue. It provides a clear, unequivocal response. Further, it is possible to code responses quickly, there being only two categories of response. A dichotomous question is also useful as a funnelling or sorting device for subsequent questions, for example: ‘if you answered “yes” to question X, please go to question Y; if you answered “no” to question X, please go to question Z’ (see the section below on contingency questions). Sudman and Bradburn (1982: 89) suggest that if dichotomous questions are being used, then it is desirable to use several to gain data on the same topic, in order to reduce the problems of respondents ‘guessing’ answers.
On the other hand, the researcher must ask, for instance, whether a ‘yes’/‘no’ response actually provides any useful information. Requiring respondents to make a ‘yes’/‘no’ decision may be inappropriate; it might be more appropriate to have a range of responses, for example in a rating scale. There may be comparatively few complex or subtle questions which can be answered with a simple ‘yes’ or ‘no’. A ‘yes’ or a ‘no’ may be inappropriate for a situation whose complexity is better served by a series of questions which catch that complexity. Further, Youngman (1984: 163) suggests that it is a natural human tendency to agree with a statement rather than to disagree with it; this suggests that a simple dichotomous question might build in respondent bias. Indeed people may be more reluctant to agree with a negative statement than to disagree with a positive question (Weems et al., 2003).
In addition to dichotomous questions (‘yes’/‘no’ questions), a piece of research might ask for information about dichotomous variables, for example gender (male/female), type of school (elementary/secondary), type of course (vocational/non-vocational). In these cases only one of two responses can be selected. This enables nominal data to be gathered, which can then be processed using the chi-square statistic, the binomial test, the G-test, and crosstabulations (see Cohen and Holliday (1996) for examples). Dichotomous questions are treated as nominal data (see Part 5).
To try to gain some purchase on complexity, the researcher can move towards multiple choice questions, where the range of choices is designed to capture the likely range of responses to given statements. For example, the researcher might ask a series of questions about a new chemistry scheme in the school; a statement precedes a set of responses thus:
The New Intermediate Chemistry Education (NICE) is:
(a) a waste of time;
(b) an extra burden on teachers;
(c) not appropriate to our school;
(d) a useful complementary scheme;
(e) a useful core scheme throughout the school;
(f) well-presented and practicable.
The categories would have to be discrete (i.e. having no overlap and being mutually exclusive) and would have to exhaust the possible range of responses. Guidance would have to be given on the completion of the multiple choice, clarifying, for example, whether respondents are able to tick only one response (a single answer mode) or several responses (multiple answer mode) from the list. Like dichotomous questions, multiple choice questions can be quickly coded and quickly aggregated to give frequencies of response. If that is appropriate for the research, then this might be a useful instrument.
The layout of a multiple choice question can be thus:
Number of years in teaching
1–5 |
|
6–14 |
|
15–24 |
|
25+ |
|
Which age group do you teach at present (you may tick more than one)?
Infant |
|
Primary |
|
Secondary (excluding sixth form) |
|
Sixth form only |
|
Just as dichotomous questions have their parallel in dichotomous variables, so multiple choice questions have their parallel in multiple elements of a variable. For example, the researcher may be asking to which form a student belongs – there being up to, say, 40 forms in a large school, or the researcher may be asking which post-16 course a student is following (e.g. academic, vocational, manual, non-manual). In these cases only one response may be selected. As with the dichotomous variable, the listing of several categories or elements of a variable (e.g. form membership and course followed) enables nominal data to be collected and processed using the chi-square statistic, the G-test, and crosstabulations (Cohen and Holliday, 1996). Multiple choice questions are treated as nominal data (see Part 5).
It may be important to include in the multiple choices those that will enable respondents to select the response that most closely represents their view, hence a pilot is needed to ensure that the categories are comprehensive, exhaustive and representative. On the other hand, the researcher may be only interested in certain features, and it is these that would figure in the response categories.
The multiple choice questionnaire seldom gives more than a crude statistic, for words are inherently ambiguous. In the example above of chemistry, the notion of ‘useful’ is unclear, as are ‘appropriate’, ‘practicable’ and ‘burden’. Respondents could interpret these words differently in their own contexts, thereby rendering the data ambiguous. One respondent might see the utility of the chemistry scheme in one area and thereby say that it is useful – ticking (d). Another respondent might see the same utility in that same one area but because it is only useful in that single area may see this as a flaw and therefore not tick category (d). With an anonymous questionnaire this difference would be impossible to detect.
This is the heart of the problem of questionnaires – that different respondents interpret the same words differently. ‘Anchor statements’ can be provided to allow a degree of discrimination in response (e.g. ‘strongly agree’, ‘agree’, etc.) but there is no guarantee that respondents will always interpret them in the way that is intended. In the example above this might not be a problem as the researcher might only be seeking an index of utility – without wishing to know the areas of utility or the reasons for that utility. The evaluator might be wishing only for a crude statistic (which might be very useful statistically in making a decisive judgement about a programme). In this case this rough and ready statistic might be perfectly acceptable.
One can see in the example of chemistry above not only ambiguity in the wording but a very incomplete set of response categories which is hardly capable of representing all aspects of the chemistry scheme. That this might be politically expedient cannot be overlooked, for if the choice of responses is limited, then those responses might enable bias to be built into the research. For example, if the responses were limited to statements about the utility of the chemistry scheme, then the evaluator would have little difficulty in establishing that the scheme was useful. By avoiding the inclusion of negative statements or the opportunity to record a negative response the research will surely be biased. The issue of the wording of questions has been discussed earlier.
Multiple choice items are also prone to problems of word order and statement order. For example, Dillman et al. (2003: 6) report a study of sports, in which tennis was found to be less exciting than football when the tennis option was presented before the football option, and more exciting when the football option was placed before the tennis option. This suggests that respondents tend to judge later items in terms of the earlier items, rather than vice versa and that they overlook features specific to later items if these are not contained in the earlier items. This is an instance of the ‘primacy effect’ or ‘order effect’, wherein items earlier in a list are given greater weight than items lower in the list. Order effects are resilient to efforts to minimize them, and primacy effects are particularly strong in internet questionnaires (Dillman et al., 2003: 22). Preceding questions and the answers given may influence responses to subsequent questions (Schwartz et al., 1998: 177).
Order effects and the primacy effects are examples of context effects, in which some questions in the questionnaire (sometimes coming later in the questionnaire, as respondents do not always answer questions in the given sequence, and may scan the whole questionnaire before answering specific items) may effect the responses given to other questions in the questionnaire (Friedman and Amoo, 1999: 122), biasing the responses by creating a specific mindset, i.e. a predisposition to answering questions in a particular way.
The rank order question is akin to the multiple choice question in that it identifies options from which respondents can choose, yet it moves beyond multiple choice items in that it asks respondents to identify priorities. This enables a relative degree of preference, priority, intensity, etc. to be charted. Rank ordering requires respondents to compare values across variables; in this respect they are unlike rating scales in which the values are entered independently of each other (Ovadia, 2004: 404), i.e. the category ‘strongly agree’ can be applied to a single variable without any regard to what one enters for any other variable. In a ranking exercise the respondent is required to take account of the other variables, because he/she is being asked to see their relative value, weighting or importance. This means that, in a ranking exercise, the task is fair, i.e. the variables are truly able to be compared and placed in a rank order, they lie on the same scale and/or can be judged on the same criteria.
In the rank ordering exercise a list of factors is set out and the respondent is required to place them in a rank order, for example:
Please indicate your priorities by placing numbers in the boxes to indicate the ordering of your views, 1 =the highest priority, 2 =the second highest, and so on.
The proposed amendments to the mathematics scheme might be successful if the following factors are addressed:
|
the appropriate material resources are in school; |
|
|
the amendments are made clear to all teachers; |
|
|
the amendments are supported by the mathematics team; |
|
|
the necessary staff development is assured; |
|
|
there are subsequent improvements to student achievement; |
|
|
the proposals have the agreement of all teachers; |
|
|
they improve student motivation; |
|
|
parents approve of the amendments; |
|
|
they will raise the achievements of the brighter students; |
|
|
the work becomes more geared to problem-solving. |
|
In this example ten items are listed. Whilst this might be enticing for the researcher, enabling fine distinctions possibly to be made in priorities, it might be asking too much of the respondents to make such distinctions. They genuinely might not be able to differentiate their responses, or they simply might not feel strongly enough to make such distinctions. The inclusion of too long a list might be overwhelming. Indeed Wilson and McLean (1994: 26) suggest that it is unrealistic to ask respondents to arrange priorities where there are more than five ranks that have been requested. In the case of the list of ten points above, the researcher might approach this problem in one of two ways. The list in the questionnaire item can be reduced to five items only, in which case the range and comprehensiveness of responses that fairly catches what the respondent feels is significantly reduced. Alternatively, the list of ten items can be retained, but the request can be made to the respondents only to rank their first five priorities, in which case the range is retained and the task is not overwhelming (though the problem of sorting the data for analysis is increased).
An example of a shorter list might be:
Please place these in rank order of the most to the least important, by putting the position (1–5) against each of the following statements, number one being the most important and number 5 being the least important:
Students should enjoy school |
[ ] |
Teachers should set less homework |
[ ] |
Students should have more choice of subjects in school |
[ ] |
Teachers should use more collaborative methods |
[ ] |
Students should be tested more, so that they work harder |
[ ] |
Rankings may also assume that the different items can truly be placed on a single scale. Consider the example above, where the respondent is required to place five items on a single scale of importance. Can these items really be differentiated according to the single criterion of ‘importance’? Surely ‘fitness for purpose’ and context would suggest that a fairer answer is that ‘it all depends’ on what is happening in a specific context, i.e. even though one could place items in a rank order, in fact it may be meaningless to do so. The items may truly not be comparable (Ovadia, 2004: 405). As Ovadia (2004: 407) reports, valuing justice may say nothing about valuing love, so to place them in a single ranking scale of importance may be meaningless.
Rankings are useful in indicating degrees of response. In this respect they are like rating scales, discussed below. Ranking questions are treated as ordinal data (see Part 5 for a discussion of ordinal data). However, rankings do not enable sophisticated statistical analysis to be conducted (Ovadia, 2004: 405), as the ranks are interdependent rather than independent, and these vary for each respondent, i.e. not only does the rank ‘1st’ mean different things to different respondents, but there are no equal intervals between each rank, and the rank of, say, ‘3rd’ has a different meaning for different respondents, which is relative to their idea of what constitutes ‘2nd’ and ‘4th’, i.e. the rankings are interdependent; there is no truly common metric here. Further, because rankings force a respondent to place items in a rank order, differences between values may be overstated.
Rankings operate on a zero-sum model (Ovadia, 2004: 406), i.e. if one places an item in the 1st position then this means that another item drops in the ranking; this may or may not be desirable, depending on what the researcher wishes to find out. Researchers using rankings will need to consider whether it is fair to ask respondents really to compare items and to judge one item in relation to another; to ask ‘are they really commensurable?’ (able to be measured by the same single standard or criterion).
One way in which degrees of response, intensity of response and the move away from dichotomous questions have been managed can be seen in the notion of rating scales – Likert scales, semantic differential scales, Thurstone scales and Guttman scaling. These are very useful devices for the researcher, as they build in a degree of sensitivity and differentiation of response whilst still generating numbers. This chapter will focus on the first two of these, though readers will find the others discussed in Oppenheim (1992). A Likert scale (named after its deviser, Rensis Likert, 1932) provides a range of responses to a given question or statement, for example:
How important do you consider work placements to be for secondary school students?
1 = not at all
2 = very little
3 = a little
4 = quite a lot
5 = a very great deal
All students should have access to free higher education.
1 = strongly disagree
2 = disagree
3 = neither agree nor disagree
4 = agree
5 = strongly agree
Such a scale could be set out thus:
Please complete the following by placing a tick in one space only, as follows:
1 = strongly disagree; 2 = disagree;
3 = neither agree nor disagree;
4 = agree; 5 = strongly agree
Senior school staff should teach more
1 |
2 |
3 |
4 |
5 |
[ ] |
[ ] |
[ ] |
[ ] |
[ ] |
In these examples the categories need to be discrete and to exhaust the range of possible responses which respondents may wish to give. Notwithstanding the problems of interpretation which arise as in the previous example – one respondent’s ‘agree’ may be another’s ‘strongly agree’, one respondent’s ‘very little’ might be another’s ‘a little’ – the greater subtlety of response which is built into a rating scale renders this a very attractive and widely used instrument in research.
These two examples both indicate an important feature of an attitude scaling instrument, namely the assumption of unidimensionality in the scale; the scale should only be measuring one thing at a time (Oppenheim, 1992: 187–8). Indeed this is a cornerstone of Likert’s own thinking (1932).
It is a very straightforward matter to convert a dichotomous question into a multiple choice question. For example, instead of asking the ‘do you?’, ‘have you?’, ‘are you?’, ‘can you?’ type questions in a dichotomous format, a simple addition to wording will convert it into a much more subtle rating scale, by substituting the words ‘to what extent?’, ‘how far?’, ‘how much?’, ‘how often?’, etc.
A semantic differential is a variation of a rating scale which operates by putting an adjective at one end of a scale and its opposite at the other, for example:
How informative do you consider the new set of history textbooks to be?
|
1 |
2 |
3 |
4 |
5 |
6 |
7 |
|
useful |
- |
- |
- |
- |
- |
- |
- |
useless |
Respondents indicate their opinion by circling or putting a mark on that position on the scale which most represents what they feel. Researchers devise their own terms and their polar opposites, for example:
Approachable |
... |
Unapproachable |
Generous |
... |
Mean |
Friendly |
... |
Hostile |
Caring |
... |
Uncaring |
Attentive |
... |
Inattentive |
Hard-working |
... |
Lazy |
Osgood et al. (1957), the pioneers of this technique, suggest that semantic differential scales are useful in three contexts: evaluative (e.g. valuable–valueless, useful–useless, good–bad); potency (e.g. large–small, weak–strong, light–heavy); and activity (e.g. quick–slow; active–passive, dynamic–lethargic).
There are several commonly used categories in rating scales, for example:
Strongly disagree/disagree/neither agree nor disagree/agree/strongly agree
Very seldom/occasionally/quite often/very often
Very little/a little/somewhat/a lot/a very great deal
Never/almost never/sometimes/often/very often
Not at all important/unimportant/neither important nor unimportant/important/very important
Very true of me/a little bit true of me/don’t know/not really true of me/very untrue of me
Strongly agree /agree /uncertain /disagree /strongly disagree.
To these could be added the category ‘don’t know’ or ‘have no opinion’. Rating scales are widely used in research, and rightly so, for they combine the opportunity for a flexible response with the ability to determine frequencies, correlations and other forms of quantitative analysis. They afford the researcher the freedom to fuse measurement with opinion, quantity and quality.
Though rating scales are powerful and useful in research, the investigator, nevertheless, needs to be aware of their limitations. For example, the researcher may infer a degree of sensitivity and subtlety from the data that they cannot bear. There are other cautionary factors about rating scales, be they Likert scales or semantic differential scales:
1 There is no assumption of equal intervals between the categories, hence a rating of 4 indicates neither that it is twice as powerful as 2 nor that it is twice as strongly felt; one cannot infer that the intensity of feeling in the Likert scale between ‘strongly agree’ and ‘disagree’ somehow matches the intensity of feeling between ‘strongly disagree’ and ‘agree’. These are illegitimate inferences. The problem of equal intervals has been addressed in Thurstone scales (Thurstone and Chave, 1929; Oppenheim, 1992: 190–5). Friedman and Amoo (1999: 115) suggest that if the researcher wishes to assume equal intervals (‘equal-sized gradations’) between points in the rating scale, then he or she must ensure that the category descriptors are genuinely equal interval. Take, for example, the scale ‘not at all’, ‘very little’, ‘a little’, ‘quite a lot’, ‘a very great deal’. Here the conceptual distance between ‘a little’ and ‘quite a lot’ is much greater than between ‘very little’ and ‘a little’, i.e. there are not equal intervals.
2 Numbers have different meanings for different respondents, so one person may use a particular criterion to award a score of ‘6’ on a seven-point scale, whilst another person using exactly the same criterion would award a score of ‘5’ on the same scale. Here ‘6’ and ‘5’ actually mean the same but the numbers are different. Alternatively, one person looking at a score of, say, 7 marks out of 10 on a ten-point scale would consider that to be a high score, whereas another person looking at the same score would consider it to be moderate only. Similarly the same word has a different meaning for different respondents; one teacher may think that ‘very poor’ is a very negative descriptor, whereas another might think less negatively about it, and what one respondent might term ‘poor’, another respondent, using the same criterion, might term ‘very poor’. Friedman and Amoo (1999: 115) report that there was greater consistency between subjects on the meanings of positive words rather than negative words, and they suggest that, therefore, researchers should use descriptors that have lesser strength at the negative pole of a scale (p. 3). Further, they suggest that temporal words (e.g. ‘very often’, ‘seldom’, ‘fairly often’, ‘occasionally’, etc.) are open to great variation in their meanings for respondents (p. 3).
3 Some rating scales are unbalanced, forcing unrealistic choices to be made, for example in the scale ‘very acceptable’, ‘quite acceptable’, ‘a little acceptable’ ‘acceptable’ and ‘unacceptable’, or in the scale ‘excellent, ‘very good’, ‘quite good’, ‘good’ and ‘poor’, there are four positive categories and only one negative category (cf. Friedman and Amoo, 1999: 119). This can skew results. Such imbalance could even be called unethical.
4 Respondents are biased towards the left-hand side of a bipolar scale (Friedman and Amoo, 1999: 120; Hartley and Betts, 2010: 25). For example, if the scale ‘extremely good’ to ‘extremely poor’ runs from left to right respectively, then the results will be different if the same scale is reversed (‘extremely poor’ to ‘extremely good’) and runs from left to right (or, for example, ‘strongly agree’ on the left, to ‘strongly disagree’ on the right and vice versa). Typically, the authors report, the categories on the left-hand side of a scale are used more frequently than those on the right-hand side of a scale. Further, Hartley and Betts (2010: 25) found that those scales that had a positive label in the left-hand side would elicit higher scores than other orderings. Hence researchers must be cautious about putting all the positive categories on the left-hand side alone, as this can result in more respondents using those categories than if they were placed at the right-hand side of the scale, i.e. rating scales may want to mix the item scales so that sometimes there are positive scores on the left and sometimes positive scores on the right.
5 The ‘direction of comparison’ (Friedman and Amoo, 1999: 120) also makes a difference to results. The authors cite an example where students were asked how empathetic their male and female teachers were in regard to academic and personal problems. When the question asked ‘would you say that female teachers were more empathetic ... than the male teachers?’, the mean score of the responses on a nine-point scale was different from that when the question was ‘would you say that male teachers were more empathetic ... than the female teachers?’. In the former, 41 per cent of responses indicated that female teachers were more empathetic, whereas in the latter only 9 per cent of responses indicated that female teachers were more empathetic.
6 We have no check on whether respondents are telling the truth. Some may be deliberately falsifying their replies.
7 We have no way of knowing if the respondent wishes to add any other comments about the issue under investigation. It might be the case that there is something far more pressing about the issue than the rating scale includes but which is condemned to silence for want of a category. A straightforward way to circumvent this issue is to run a pilot and also to include a category entitled ‘other (please state)’.
8 Most of us would not wish to be called extremists; we often prefer to appear like each other in many respects. For rating scales this means that we might wish to avoid the two extreme poles at each end of the continuum of the rating scales, reducing the number of positions in the scales to a choice of three (in a five-point scale). That means that in fact there could be very little choice for us. The way round this is to create a larger scale than a five-point scale, for example a seven-point scale. To go beyond a seven-point scale is to invite a degree of detail and precision which might be inappropriate for the item in question, particularly if the argument set out above is accepted, namely that one respondent’s scale point 3 might be another’s scale point 4. Friedman and Amoo (1999: 120) suggest that five-point to 11-point scales might be most useful, whilst Schwartz et al. (1991: 571) suggest that seven-point scales seem to be best in terms of reliability, the ability of respondents to discriminate between the values in the scales, and the percentages of respondents who are ‘undecided’.
9 Schwartz et al. (1991: 571) report that rating scales that have a verbal label for each point in the scale are more reliable than rating scales that provide labels only for the end points of the numerical scales.
10 If the researcher wishes to use ratio data (discussed in Part 5) in order to calculate more sophisticated level statistics (e.g. regressions, factor analysis, structural equation modelling), then a ratio scale must have a true zero (‘0’) and equal intervals. Many rating scales use an 11-point scale here that runs from 0 to 10, with 0 being ‘not at all’ (or something equivalent to this, depending on the question/item) and 10 being the highest score (e.g. ‘completely’ or ‘excellent’).
11 The end-point descriptors on a scale have a significant effect on the responses (Friedman and Amoo, 1999: 117). For example, if the end points of a scale are extreme (e.g. ‘terrible’ and ‘marvellous’) then respondents will avoid these extremes, whereas if the end points are ‘very bad’ and ‘very good’ then more responses in these categories are chosen.
12 The nature of the scaling may affect significantly the responses given and the range of responses actually given (Schwartz and Bienias, 1990: 63). Further, Schwartz et al. (1991) found that if a scale only had positive integers (e.g. 1 to 10) on a scale of ‘extremely successful’ to ‘not at all successful’ then 34 per cent of respondents chose values in the 1–5 categories. However, when the scale was set at –5 for ‘not at all successful’ and +5 for ‘extremely successful’, then only 13 per cent of respondents chose the equivalent lower 5 values (–5 to 0). The authors surmised that the former scale (0–10) was perceived by respondents to indicate degrees of success, whereas the latter scale (–5 to 0) was perceived by respondents to indicate not only the absence of success but the presence of the negative factor of failure (see also Schwartz et al., 1998: 177). Indeed they reported that respondents were reluctant to use negative scores (p. 572) and that responses to a -5 to +5 scale tended to be more extreme than responses to a 0–10 scale, even when they used the same scale verbal labels. They also suggest (p. 577) that, in a –5 to +5 scale, zero (0) indicates absence of an attribute, whereas in a 0–10 scale a zero (0) indicates the presence of the negative end of the bipolar scale, i.e. the zero has two different meanings, depending on the scale used. Hence researchers must be careful not only on the verbal labels that they use, but the scales and scale points that they use with those same descriptors. Kenett (2006: 409) also comments, in this respect, that researchers will need to consider whether they are asking about a bipolar dimension (e.g. ‘very successful’ to ‘very unsuccessful’) where an attribute and its opposite are included, or whether a single pole is being used (e.g. only degrees of positive response or presence of a factor). For a bipolar dimension a combination of negative and positive numbers on a scale may be useful (with the cautions indicated above), whereas for a singly polar dimension then only positive numbers should be used (cf. Schwartz et al., 1991: 577). In other words, if the researcher is looking to discover the intensity of a single attribute then it is better to use positive numbers only (p. 578).
13 Response alternative may signal the nature of the considerations to be borne in mind by respondents (Gaskell et al., 1994: 243). For example, if one is asking about how often there are incidents of indiscipline in a class, the categories ‘several times each lesson’, ‘several times each morning’, ‘several times each day’ may indicate that a more inclusive, wider definition of ‘indiscipline’ is required than if the categories of ‘several times each week’, ‘several times each month’ or ‘several times each term’ were used. The terms used may frame the nature of the thinking or responses that the respondent uses. The authors suggest that this is particularly the case if some vague phrases are included in the response categories (p. 242). Obtained responses, as Schwartz and Bienias (1990: 62) indicate, are a function of the response alternatives that the researcher has provided. Indeed Bless et al. (1992: 309) indicate that scales which offer higher response categories/values tend to produce higher estimates from the respondents (and that this tendency increases as questions become increasingly difficult (p. 312).
14 There is a tendency for participants to opt for the mid-point of a five- or seven-point scale (the central tendency). This is notably an issue in East Asian respondents, where the ‘doctrine of the mean’ is advocated in Confucian culture. One way to overcome this is to use an even number scaling system, as there is no mid-point. On the other hand, it could be argued that if respondents wish to ‘sit on the fence’ and choose a mid-point, then they should be given the option to do so.
15 Respondents tend to cluster their responses, e.g. around the centre, or around one end or another of the scale, and their responses to one item may affect their responses to another item (e.g. creating a single mindset).
16 Choices may be ‘forced’ by omitting certain categories (e.g. ‘no opinion’, ‘undecided’, ‘don’t know’, ‘neither agree nor disagree’). If the researcher genuinely believes that respondents do, or should, have an opinion then such omissions may be justified. Alternatively, it may be unacceptable to force a choice for want of a category that genuinely lets respondents say what is in their minds, even if their minds are not made up about a factor or if they have a reason for concealing their true feelings. Forcing a choice may lead to respondents having an opinion on matters that they really have no opinion about, or, indeed, on matters that do not exist, e.g. phoney topics (Friedman and Amoo, 1999: 118).
17 On some scales there are mid-points; on the five-point scale it is category three, and on the seven point scale it is category four. The use of an odd number of points on a scale enables this to occur. However, choosing an even number of scale points, for example a six-point scale, might require a decision on rating to be indicated.
For example, suppose a new staffing structure has been introduced into a school and the head teacher is seeking some guidance on its effectiveness. A six-point rating scale might ask respondents to indicate their response to the statement:
The new staffing structure in the school has enabled teamwork to be managed within a clear model of line management.
(Circle one number)
|
1 |
2 |
3 |
4 |
5 |
6 |
|
strongly agree |
- |
- |
- |
- |
- |
- |
strongly disagree |
Let us say that one member of staff circled 1, eight staff circled 2, twelve staff circled 3, nine staff circled 4, two staff circled 5, and seven staff circled 6. There being no mid-point on this continuum, the researcher could infer that those respondents who circled 1, 2 or 3 were in some measure of agreement, whilst those respondents who circled 4, 5 or 6 were in some measure of disagreement. That would be very useful for, say, a head teacher, in publicly displaying agreement, there being 21 staff (1+8 + 12) agreeing with the statement and 18 (9+2+7) displaying a measure of disagreement. However, one could point out that the measure of ‘strongly disagree’ attracted seven staff – a very strong feeling – which was not true for the ‘strongly agree’ category, which only attracted one member of staff. The extremity of the voting has been lost in a crude aggregation.
Further, if the researcher were to aggregate the scoring around the two mid-point categories (3 and 4) there would be 21 members of staff represented, leaving nine (1 +8) from categories 1 and 2 and nine (2+7) from categories 5 and 6; adding together categories 1, 2, 5 and 6, a total of 18 is reached, which is less that the 21 total of the two categories 3 and 4. It seems on this scenario that it is far from clear that there was agreement with the statement from the staff; indeed taking the high incidence of ‘strongly disagree’, it could be argued that those staff who were perhaps ambivalent (categories 3 and 4), coupled with those who registered a ‘strongly disagree’ indicate not agreement but disagreement with the statement.
The interpretation of data has to be handled very carefully; ordering them to suit a researcher’s own purposes might be very alluring but quite illegitimate. The golden rule here is that crude data can only yield crude interpretation; subtle statistics require subtle data. The interpretation of data must not distort the data unfairly. Rating scale questions are treated as ordinal data (see Part 5), using modal scores and non-parametric data analysis, though one can find very many examples where this rule has been violated, and non-parametric data have been treated as parametric data. This is unacceptable.
It has been suggested that the attraction of rating scales is that they provide more opportunity than dichotomous questions for rendering data more sensitive and responsive to respondents. This makes rating scales particularly useful for tapping attitudes, perceptions and opinions. The need for a pilot study to devise and refine categories, making them exhaustive and discrete, has been suggested as a necessary part of this type of data collection.
Questionnaires that are going to yield numerical or word-based data can be analysed using computer programs (for example SPSS or Ethnograph, SphinxSurvey, N-Vivo respectively). If the researcher intends to process the data using a computer package it is essential that the layout and coding system of the questionnaire is appropriate for that particular computer package. Instructions for layout in order to facilitate data entry are contained in manuals that accompany such packages.
Rating scales are more sensitive instruments than dichotomous scales. Nevertheless they are limited in their usefulness to researchers by their fixity of response caused by the need to select from a given choice. A questionnaire might be tailored even more to respondents by including open-ended questions to which they can reply in their own terms and own opinions. We consider these later. For further reviews of, and references to, rating scales we refer the reader to Hartley and Betts (2010).
If the researcher wishes respondents to compare variables (items) and award scores for items in relation to each other, then rankings are suitable. If the researcher wishes respondents to give a response/score to variables (items) that are independent of the score awarded to any other variables (items), then ratings should be considered. In the latter, the score that one awards to one variable has no bearing or effect on the score that one awards to another. In practice, the results of many rating scales may enable the researcher to place items in a rank order (Ovadia, 2004: 405), but rating scales may also result in many variables having ties (the same score) in the values given, which may be coincidental or, indeed, the ‘result of indifference’ (Ovadia, 2004: 405) on the part of the respondent to the variable in question (e.g. respondents simply and quickly tick the middle box (e.g. ‘3’ in a five-point scale) going down a list of items).
Rankings force the respondent to use the full range of the scale (the scale here being the number of items included, e.g. if there are ten items then ten rankings must be given). By contrast, ratings do not have such a stringent requirement; respondents may cluster their responses to all the items around one end of a scale (e.g. points ‘5’, ‘6’ and ‘7’ in a seven-point scale, or point ‘3’ in a five-point scale).
Let us imagine that a researcher asked respondents to indicate the importance of three items in respect of student success, and that the scale used was to award points out of ten. Here are the results for respondent A and respondent B (cf. Ovadia, 2004: 407):
Respondent A: working hard (9 points); family pressure (6 points); enjoyment of the subject (5 points).
Respondent B: working hard (6 points); family pressure (4 points); enjoyment of the subject (2 points).
A ranking exercise would accord the same positioning of the items on these two scores: in first place comes ‘working hard’, then ‘family pressure’ and in the lowest position, ‘enjoyment of the subject’. However, as we can see, the actual scores are very different, and respondent A awards much higher scores than respondent B, i.e. for respondent A these items are much more important than for respondent B, and any single item is much more important for respondent A than for respondent B. Whilst rankings and ratings here will yield equally valid results, the issue is one of ‘fitness for purpose’: if the researcher wishes to compare then rankings might be useful, whereas if the researcher wishes to examine actual values then ratings might be more useful.
Further, let us imagine that for respondent A in this example, the score for ‘working hard’ drops by two points over time, the score for ‘family pressure’ drops by one point, and the score for ‘enjoyment of the subject’; drops by three points over time. The result of the ranking, however, remains the same, i.e. even though the level of importance has dropped for these three items; the ranking is insensitive to these changes.
In this type of question respondents are asked to distribute a given number of marks (points) between a range of items. For example:
‘Please distribute a total of ten points among the sentences that you think most closely describe your behaviour. You may distribute these freely: they may be spread out, or awarded to only a few statements, or all allocated to a single sentence if you wish.’
I can take advantage of new opportunities |
[ ] |
I can work effectively with all kinds of people |
[ ] |
Generating new ideas is one of my strengths |
[ ] |
I can usually tell what is likely to work in practice |
[ ] |
I am able to see tasks through to the very end |
[ ] |
I am prepared to be unpopular for the good of the school |
[ ] |
This enables priorities to be identified, comparing highs and lows, and for equality of choices to be indicated, and, importantly, for this to be done in the respondents’ own terms. It requires respondents to make comparative judgements and choices across a range of items. For example, we may wish to distribute ten points for aspects of an individual’s personality:
Talkative |
[ ] |
Cooperative |
[ ] |
Hard-working |
[ ] |
Lazy |
[ ] |
Motivated |
[ ] |
Attentive |
[ ] |
This means that the respondent has to consider the relative weight of each of the given aspects before coming to a decision about how to award the marks. To accomplish this means that the all-round nature of the person, in the terms provided, has to be considered, to see, on balance, which aspect is stronger when compared to another.1
The difficulty with this approach is to decide how many marks can be distributed (a round number, for example ten makes subsequent calculation easily comprehensible) and how many statements/items to include, e.g. whether to have the same number of statements as there are marks, or more or fewer statements than the total of marks. Having too few statements/items does not do justice to the complexity of the issue, and having too many statements/items may mean that it is difficult for respondents to decide how to distribute their marks. Having too few marks available may be unhelpful, but, by contrast, having too many marks and too many statements/items can lead to simple computational errors by respondents. Our advice is to keep the number of marks to ten and the number of statements to around six to eight. Constant sum data are ordinal, and this means that non-parametric analysis can be performed on the data (see Part 5).
We discuss ratio data in Part 5 and we refer the reader to the discussion and definition there. For our purposes here we suggest that ratio data questions deal with continuous variables where there is a true zero, e.g.
How much money do you have in the bank? |
___ |
How many times have you been late for school? |
___ |
How many marks did you score in the mathematics test? |
___ |
How old are you (in years)? |
___ |
Here no fixed answer or category is provided, and the respondent puts in the numerical answer that fits his/her exact figure, i.e. the accuracy is higher, much higher than in categories of data. This enables averages (means), standard deviations, range, and high-level statistics to be calculated, e.g. regression, factor analysis, structural equation modelling (see Part 5).
An alternative form of ratio scaling is where the respondent has to award marks out of, say, ten, for a particular item. This is a device that has been used in business and commerce for measuring service quality and customer satisfaction, and is being used in education by Kgaile and Morrison (2006), for example Table 20.2.
This kind of scaling is often used in telephone interviews, as it is easy for respondents to understand. The argument could be advanced that this is a sophisticated form of rating scale, but the terminology used in the instruction clearly suggests that it asks for ratio scale data.
The open-ended question is a very attractive device for smaller scale research or for those sections of a questionnaire that invite an honest, personal comment from respondents in addition to ticking numbers and boxes. The questionnaire simply puts the open-ended questions and leaves a space (or draws lines) for a free response. It is the open-ended responses that might contain the ‘gems’ of information that otherwise might not be caught in the questionnaire. Further, it puts the responsibility for and ownership of the data much more firmly into respondents’ hands.
It is useful for the researcher to provide some support for respondents, so that they know the kind of reply being sought. For example, an open question that includes a prompt could be:
‘Please indicate the most important factors that reduce staff participation in decision making’;
‘Please comment on the strengths and weaknesses of the mathematics course’;
‘Please indicate areas for improvement in the teaching of foreign languages in the school’.
This is not to say that the open-ended question might well not frame the answer, just as the stem of a rating scale question might frame the response given. However, an open-ended question can catch the authenticity, richness, depth of response, honesty and candour which, as is argued elsewhere in this book, are the hallmarks of qualitative data.
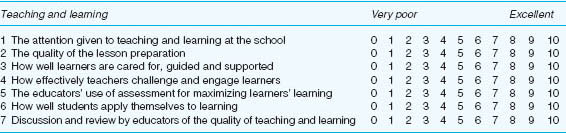
TABLE 20.2 A TEN-POINT MARKING SCALE IN A QUESTIONNAIRE
‘Please give a mark from 0 to 10 for the following statements, with 10 being excellent and 0 being very poor. Please circle the appropriate number for each statement.’
Oppenheim (1992: 56–7) suggests that a sentence-completion item is a useful adjunct to an open-ended question, for example:
Please complete the following sentence in your own words:
An effective teacher...
or
The main things that I find annoying with disruptive students are...
Open-endedness also carries problems of data handling. For example, if one tries to convert opinions into numbers (e.g. so many people indicated some degree of satisfaction with the new principal’s management plan), then it could be argued that the questionnaire should have used rating scales in the first place. Further, it might well be that the researcher is in danger of violating one principle of word-based data, which is that they are not validly susceptible to aggregation, i.e. that it is trying to bring to word-based data the principles of numerical data, borrowing from one paradigm (quantitative, positivist methodology) to inform another paradigm (qualitative, interpretive methodology).
Further, if a genuinely open-ended question is being asked, it is perhaps unlikely that responses will bear such a degree of similarity to each other so as to enable them to be aggregated too tightly. Open-ended questions make it difficult for the researcher to make comparisons between respondents, as there may be little in common to compare. Moreover, to complete an open-ended questionnaire takes much longer than placing a tick in a rating scale response box; not only will time be a constraint here, but there is an assumption that respondents will be sufficiently or equally capable of articulating their thoughts and committing them to paper.
In practical terms, Redline et al. (2002) report that using open-ended questions can lead to respondents overlooking instructions, as they are occupied with the more demanding task of writing in their own words than reading instructions.
Despite these cautions, the space provided for an open-ended response is a window of opportunity for the respondent to shed light on an issue or course. Thus, an open-ended questionnaire has much to recommend it.
Matrix questions are not types of questions but concern the layout of questions. Matrix questions enable the same kind of response to be given to several questions, for example ‘strongly disagree’ to ‘strongly agree’. The matrix layout helps to save space, for example:
Please complete the following by placing a tick in one space only, as follows:
1 =not at all; 2 =very little; 3 =a moderate amount; 4 = quite a lot; 5 = a very great deal
How much do you use the following for assessment purposes?
|
1 |
2 |
3 |
4 |
5 |
a commercially published tests |
[ ] |
[ ] |
[ ] |
[ ] |
[ ] |
b your own made-up tests |
[ ] |
[ ] |
[ ] |
[ ] |
[ ] |
c students’ projects |
[ ] |
[ ] |
[ ] |
[ ] |
[ ] |
d essays |
[ ] |
[ ] |
[ ] |
[ ] |
[ ] |
e samples of students’ work |
[ ] |
[ ] |
[ ] |
[ ] |
[ ] |
Here five questions have been asked in only five lines, excluding, of course, the instructions and explanations of the anchor statements. Such a layout is economical of space.
A second example indicates how a matrix design can save a considerable amount of space in a questionnaire. Here the size of potential problems in conducting a piece of research is asked for, and data on how much these problems were soluble are requested. For the first issue (the size of the problem) 1 = no problem, 2 = a small problem, 3 = a moderate problem, 4 = a large problem, 5 = a very large problem. For the second issue (how much the problem was solved) 1 =not solved at all, 2 = solved only a very little, 3 = solved a moderate amount, 4 = solved a lot, 5 = completely solved. In Table 20.3 30 questions (15 X 2) have been able to be covered in just a short amount of space.
Laying out the questionnaire like this enables the respondent to fill in the questionnaire rapidly. On the other hand, it risks creating a mindset in the respondent (a ‘response set’ (Baker, 1994: 181)) in that the respondent may simply go down the questionnaire columns and write the same number each time (e.g. all number 3) or, in a rating scale, tick all number 3. Such response sets can be detected by looking at patterns of replies and eliminating response sets from subsequent analysis.
The conventional way of minimizing response sets has been by reversing the meaning of some of the questions so that the respondents will need to read them carefully. However Weems et al. (2003) argue that using positively and negatively worded items within a scale is not measuring the same underlying traits. They report that some respondents will tend to disagree with a negatively worded item, that the reliability levels of negatively worded items are lower than for positively worded items, and that negatively worded items receive greater non-response than positively worded items. Indeed the authors argue against mixed-item formats, and supplement this by reporting that inappropriately worded items can induce an artificially extreme response which, in turn, compromises the reliability of the data. Mixing negatively and positively worded items in the same scale, they argue, compromises both validity and reliability. Indeed they suggest that respondents may not read negatively worded items as carefully as positively worded items.
TABLE 20.3 POTENTIAL PROBLEMS IN CONDUCTING RESEARC
Potential problems in conducting research |
Size of the problem (1–5) |
How much the problem was solved (1–5) |
1 Gaining access to schools and teachers; 2 Gaining permission to conduct the research (e.g. from principals); 3 Resentment by principals; 4 People vetting what could be used; 5 Finding enough willing participants for your sample; 6 Schools suffering from ‘too much research’ by outsiders and insiders; 7 Schools/people not wishing to divulge information about themselves; 8 Schools not wishing to be identifiable, even with protections guaranteed; 9 Local political factors that impinge on the school; 10 Teachers’ fear of being identified/traceable, even with protections guaranteed; 11 Fear of participation by teachers (e.g. if they are critical of the school or others they could lose their contracts); 12 Unwillingness of teachers to be involved because of their workload; 13 The principal deciding on whether to involve the staff, without consultation with the staff; 14 Schools’/institutions’ fear of criticism/loss of face; 15 The sensitivity of the research: the issues being investigated. |
|
|
Contingency questions depend on responses to earlier questions, for example: ‘if your answer to question (1) was “yes” please go to question (4)’. The earlier question acts as a filter for the later question, and the later question is contingent on the earlier, and is a branch of the earlier question. Some questionnaires will write in words the number of the question to which to go (e.g. ‘please go to question 6’); others will place an arrow to indicate the next question to be answered if your answer to the first question was such-and-such.
Contingency and filter questions may be useful for the researcher, but they can be confusing for the respondent as it is not always clear how to proceed through the sequence of questions and where to go once a particular branch has been completed. Redline et al. (2002) found that respondents tend to ignore, misread and incorrectly follow branching instructions, such that item non-response occurs for follow-up questions that are only applicable to certain subsamples, and respondents skip over, and therefore fail to follow-up on those questions that they should have completed. The authors found that the increased complexity of the questionnaire brought about by branching instructions negatively influenced its correct completion.
The authors report (Redline et al., 2002: 7) that the number of words in the question affects the respondents’ ability to follow branching instructions – the greater the number of words in the question, the greater is the likelihood of the respondents overlooking the branching instructions. The authors report that up to seven items, and no more, can be retained in the short-term memory. This has implications for the number of items in a list of telephone interviews, where there is no visual recall or checking possible. Similarly, the greater the number of answer categories, the greater is the likelihood of making errors, e.g. overlooking branching instructions (p. 19). They report that respondents tend to see branching instructions when they are placed by the last category, particularly if they have chosen that last category.
Further, Redline et al. (2002: 8) note that sandwiching branching instructions between items that do not branch is likely to lead to errors of omission and commission being made: omitting to answer all the questions and answering the wrong questions. Further, locating the instructions for branching some distance away from the preceding answer box can also lead to errors in following the instructions. They report (p. 17) that ‘altering the visual and verbal design of branching instructions has a substantial impact on how well respondents read, comprehend, and act upon the branching instructions’. It follows from this that the clear location and visual impact of instructions are important for successful completion of branching instructions. Most respondents, they acknowledge, do not deliberately ignore branching instructions; they simply are unaware of them.
The implications of the findings from Redline et al. (2002) are that instructions should be placed where they are to be used and where they can be seen.
We would advise judicious and limited use of filtering and branching devices. It is particularly important to avoid having participants turning pages forwards and backwards in a questionnaire in order to follow the sequence of questions that have had filters and branches following from them. It is a particular problem in internet surveys where the screen size is much smaller than the length of a printed page. One way of overcoming the problem of branches is to sectionalize the questionnaire, keeping together conceptually close items and keeping the branches within that section.
Sudman and Bradburn (1982: chapter 3) draw attention to the important issue of including sensitive items in a questionnaire. Whilst the anonymity of a questionnaire and, frequently, the lack of face-to-face contact between the researcher and the respondents in a questionnaire might facilitate responses to sensitive material, the issues of sensitivity and threat cannot be avoided, as they might lead to under-reporting (nondisclosure and withholding data) or over-reporting (exaggeration) by participants. Some respondents may be unwilling to disclose sensitive information, particularly if it could harm themselves or others. Why should they share private matters (e.g. about family life and opinions of school managers and colleagues) with a complete stranger (Cooper and Schindler, 2001: 341)? Even details of age, income, educational background, qualifications and opinions can be regarded as private and/or sensitive matters.
Sudman and Bradburn (1982: 55–6) identify several important considerations in addressing potentially threatening or sensitive issues, for example socially undesirable behaviour (e.g. drug abuse, sexual offences, violent behaviour, criminality, illnesses, employment and unemployment, physical features, sexual activity, behaviour and sexuality, gambling, drinking, family details, political beliefs, social taboos). They suggest that:
Open rather than closed questions might be more suitable to elicit information about socially undesirable behaviour, particularly frequencies.
Long rather than short questions might be more suitable for eliciting information about socially undesirable behaviour, particularly frequencies.
Using familiar words might increase the number of reported frequencies of socially undesirable behaviour.
Using data gathered from informants, where possible, can enhance the likelihood of obtaining reports of threatening behaviour.
Deliberately loading the question so that overstatements of socially desirable behaviour and understatements of socially undesirable behaviour are reduced might be a useful means of eliciting information.
With regard to socially undesirable behaviour, it might be advisable first to ask whether the respondent has engaged in that behaviour previously, and then move to asking about his or her current behaviour. By contrast, when asking about socially acceptable behaviour the reverse might be true, i.e. asking about current behaviour before asking about everyday behaviour.
In order to defuse threat, it might be useful to locate the sensitive topic within a discussion of other more or less sensitive matters, in order to suggest to respondents that this issue might not be too important.
Use alternative ways of asking standard questions, for example sorting cards, or putting questions in sealed envelopes, or repeating questions over time (this has to be handled sensitively, so that respondents do not feel that they are being ‘checked’), and in order to increase reliability.
Ask respondents to keep diaries in order to increase validity and reliability.
At the end of an interview ask respondents their views on the sensitivity of the topics that have been discussed.
If possible, find ways of validating the data.
Indeed the authors suggest (Sudman and Bradburn, 1982: 86) that, as the questions become more threatening and sensitive, it is wise to expect greater bias and unreliability. They draw attention to the fact (p. 208) that several nominal, demographic details might be considered threatening by respondents. This has implications for their location within the questionnaire (discussed below). The issue here is that sensitivity and threat are to be viewed through the eyes of respondents rather than the questionnaire designer; what might appear innocuous to the researcher might be highly sensitive or offensive to participants. We refer readers to Chapter 9 on sensitive educational research.
Though there are several kinds of questions that can be used, there are some caveats about the framing of questions in a questionnaire:
i |
Avoid leading questions, that is, questions which are worded (or their response categories presented) in such a way as to suggest to respondents that there is only one acceptable answer, and that other responses might or might not gain approval or disapproval respectively. For example: Do you prefer abstract, academic-type courses, or down-to-earth, practical courses that have some pay-off in your day-to-day teaching? The guidance here is to check the ‘loadedness’ or possible pejorative overtones of terms or verbs. |
ii |
Avoid highbrow questions even with sophisticated respondents. For example: What particular aspects of the current positivistic/interpretive debate would you like to see reflected in a course of developmental psychology aimed at a teacher audience? Where the sample being surveyed is representative of the whole adult population, misunderstandings of what researchers take to be clear, unambiguous language are commonplace. Therefore it is important to use clear and simple language. |
iii |
Avoid complex questions. For example: Would you prefer a short, non-award bearing course (3, 4 or 5 sessions) with part-day release (e.g. Wednesday afternoons) and one evening per week attendance with financial reimbursement for travel, or a longer, non-award bearing course (6, 7 or 8 sessions) with full-day release, or the whole course designed on part-day release without evening attendance? |
iv |
Avoid irritating questions or instructions. For example: Have you ever attended an in-service course of any kind during your entire teaching career? If you are over 40, and have never attended an in-service course, put one tick in the box marked NEVER and another in the box marked OLD. |
v |
Avoid questions that use negatives and double negatives (Oppenheim, 1992: 128). For example: How strongly do you feel that no teacher should enrol on the in-service, award-bearing course who has not completed at least two years’ full-time teaching? Or: Do you feel that without a parent/teacher association teachers are unable to express their views to parents clearly? In this case, if you feel that a parent/teacher association is essential for teachers to express their views, do you vote ‘yes’ or ‘no’? The hesitancy involved in reaching such a decision, and the possible required rereading of the question could cause the respondent simply to leave it blank and move on to the next question. The problem is the double negative: ‘without’ and ‘unable’; it creates confusion. |
vi |
Avoid too many open-ended questions on self-completion questionnaires. Because self-completion questionnaires cannot probe respondents to find out just what they mean by particular responses, open-ended questions are a less satisfactory way of eliciting information. (This caution does not hold in the interview situation, however.) Open-ended questions, moreover, are too demanding of most respondents’ time. Nothing can be more off-putting than the following format: Use pages 5, 6 and 7 respectively to respond to each of the questions about your attitudes to in-service courses in general and your beliefs about their value in the professional life of the serving teacher. |
vii |
Avoid extremes in rating scales, e.g. ‘never’, ‘always’, ‘totally’, ‘not at all’ unless there is a good reason to include them. Most respondents are reluctant to use such extreme categories (Anderson and Arsenault, 1998: 174). |
viii |
Avoid pressuring/biasing by association, for example: ‘Do you agree with your head teacher that boys are more troublesome than girls?’ In this case the reference to the head teacher should simply be excised. |
Avoid Statements with which people tend either to disagree or agree (i.e. that have built-in skewedness (the ‘base-rate’ problem, in which natural biases in the population affect the sample results)). |
|
x |
Avoid ambiguous questions or questions that could be interpreted differently from the way that is intended. The problem of ambiguity in words is intractable; at best it can be rninimized rather than eliminated altogether. The most innocent of questions is replete with ambiguity (Youngman, 1984: 158–9; Morrison, 1993: 71–2). Take the following examples: |
Does your child regularly do homework?
What does ‘regularly’ mean – once a day; once a year; once a term; once a week?
How many students are there in the school?
What does this mean: on roll, on roll but absent; marked as present but out of school on a field trip; at this precise moment or this week (there being a difference in attendance between a Monday and a Friday), or between the first term of an academic year and the last term of the academic year for secondary school students as some of them will have left school to go into employment and others will be at home revising for examinations or have completed them?
How many computers do you have in school?
What does this mean: present but broken; including those out of school being repaired; the property of the school or staffs’ and students’ own computers; on average or exactly in school today?
Have you had a French lesson this week?
What constitutes a ‘week’: the start of the school week (i.e. from Monday to a Friday), since last Sunday (or Saturday depending on one’s religion), or, if the question were put on a Wednesday, since last Wednesday; how representative of all weeks is this week – there being public examinations in the school for some of the week?
How old are you?
15–20
20–30
30–40
40–50
50–60
The categories are not discrete; will an old-looking 40-year-old flatter himself and put himself in the 30–40 category, or will an immature 20-year-old seek the maturity of being put into the 20–30 category? The rule in questionnaire design is to avoid any overlap of categories.
Vocational education is only available to the lower ability students but it should be open to every student.
This is, in fact, a double question. What does the respondent do who agrees with the first part of the sentence – ‘vocational education is only available to the lower ability students’ – but disagrees with the latter part of the sentence, or vice versa? The rule in questionnaire design is to ask only one question at a time.
Though it is impossible to legislate for the respondents’ interpretation of wording, the researcher, of course, has to adopt a common-sense approach to this, recognizing the inherent ambiguity but nevertheless still feeling that it is possible to live with this indeterminacy.
An ideal questionnaire possesses the same properties as a good law, being clear, unambiguous and practicable, reducing potential errors in participants and data analysts, being motivating for participants and ensuring as far as possible that respondents are telling the truth (Davidson, 1970).
The golden rule is to keep questions as short and as simple as possible.
To some extent the order of questions in a schedule is a function of the target sample (e.g. how they will react to certain questions), the purposes of the questionnaire (e.g. to gather facts or opinions), the sensitivity of the research (e.g. how personal and potentially disturbing the issues are that will be addressed) and the overall balance of the questionnaire (e.g. where best to place sensitive questions in relation to less threatening questions, and how many of each to include).
The ordering of the questionnaire is important, for early questions may set the tone or the mindset of the respondent to later questions. For example, a questionnaire that makes a respondent irritated or angry early on is unlikely to have managed to enable that respondent’s irritation or anger to subside by the end of the questionnaire. As Oppenheim remarks (1992: 121) one covert purpose of each question is to ensure that the respondent will continue to cooperate.
Further, a respondent might ‘read the signs’ in the questionnaire, seeking similarities and resonances between statements so that responses to early statements will affect responses to later statements and vice versa. Whilst multiple items may act as a cross-check, this very process might be irritating for some respondents.
Krosnick and Alwin (1987) found a ‘primacy effect’ (discussed earlier), i.e. respondents tend to choose items that appear earlier in a list rather than items that appear later in a list. This is particularly important for branching instructions, where the instruction, because it appears at the bottom of the list, could easily be overlooked. Krosnick (1991, 1999) also found that the more difficult a question is, the greater is the likelihood of ‘satisficing’, i.e. choosing the first reasonable response option in a list, rather than working through a list methodically to find the most appropriate response category.
The key principle, perhaps, is to avoid creating a mood-set or a mindset early on in the questionnaire. For this reason it is important to commence the questionnaire with non-threatening questions that respondents can readily answer. After that it might be possible to move towards more personalized questions.
Completing a questionnaire can be seen as a learning process in which respondents become more at home with the task as they proceed. Initial questions should therefore be simple, have high interest value and encourage participation. This will build up the confidence and motivation of the respondent. The middle section of the questionnaire should contain the difficult questions; the last few questions should be of high interest in order to encourage respondents to return the completed schedule.
A common sequence of a questionnaire is:
a to commence with unthreatening factual questions (that, perhaps, will give the researcher some nominal data about the sample, e.g. age group, sex, occupation, years in post, qualifications, etc.);
b to move to closed questions (e.g. dichotomous, multiple choice, rating scales, constant sum questions) about given statements or questions, eliciting responses that require opinions, attitudes, perceptions, views;
c to move to more open-ended questions (or, maybe, to intersperse these with more closed questions) that seek responses on opinions, attitudes, perceptions and views, together with reasons for the responses given. These responses and reasons might include sensitive or more personal data.
The move is from objective facts to subjective attitudes and opinions through justifications and to sensitive, personalized data. Clearly the ordering is neither as discrete nor as straightforward as this. For example, an apparently innocuous question about age might be offensive to some respondents; a question about income is unlikely to go down well with somebody who has just become unemployed, and a question about religious belief might be seen as an unwarranted intrusion into private matters. Indeed, many questionnaires keep questions about personal details until the very end.
The issue here is that the questionnaire designer has to anticipate the sensitivity of the topics in terms of the respondents, and this has a large socio-cultural dimension. What is being argued here is that the logical ordering of a questionnaire has to be mediated by its psychological ordering. The instrument has to be viewed through the eyes of the respondent as well as the designer.
In addition to the overall sequencing of the questionnaire, Oppenheim (1992: chapter 7) suggests that the sequence within sections of the questionnaire is important. He indicates that the questionnaire designer can use funnels and filters within the question. A funnelling process moves from the general to the specific, asking questions about the general context or issues and then moving toward specific points within that. A filter is used to include and exclude certain respondents, i.e. to decide if certain questions are relevant or irrelevant to them, and to instruct respondents about how to proceed (e.g. which items to jump to or proceed to). For example, if respondents indicate a ‘yes’ or a ‘no’ to a certain question, then this might exempt them from certain other questions in that section or subsequently.
The discussion so far has assumed that questionnaires are entirely word-based. This might be off-putting for many respondents, particularly children. In these circumstances a questionnaire might include visual information and ask participants to respond to this (e.g. pictures, cartoons, diagrams) or might include some projective visual techniques (e.g. to draw a picture or diagram, to join two related pictures with a line, to write the words or what someone is saying or thinking in a ‘bubble’ picture), to tell the story of a sequence of pictures together with personal reactions to it. The issue here is that in tailoring the format of the questionnaire to the characteristics of the sample, a very wide embrace might be necessary to take in non-word-based techniques. This is not only a matter of appeal to respondents, but, perhaps more significantly, is a matter of accessibility of the questionnaire to the respondents, i.e. a matter of reliability and validity.
The appearance of the questionnaire is vitally important. It must look easy, attractive and interesting rather than complicated, unclear, forbidding and boring. A compressed layout is uninviting and it clutters everything together; a larger questionnaire with plenty of space for questions and answers is more encouraging to respondents. Verma and Mallick (1999: 120) suggest the use of high quality paper if funding permits.
Dillman et al. (1999) found that respondents tend to expect less of a form-filling task than is actually required. They expect to read a question, read the response, make a mark and move on to the next question, but in many questionnaires it is more complicated than this. The rule is simple: keep it as uncomplicated as possible.
It is important, perhaps, for respondents to be introduced to the purposes of each section of a questionnaire, so that they can become involved in it and maybe identify with it. If space permits, it is useful to tell the respondent the purposes and focuses of the sections/of the questionnaire, and the reasons for the inclusion of the items.
Clarity of wording and simplicity of design are essential. Clear instructions should guide respondents – ‘Put a tick’, for example, invites participation, whereas complicated instructions and complex procedures intimidate respondents. Putting ticks in boxes by way of answering a questionnaire is familiar to most respondents, whereas requests to circle precoded numbers at the right-hand side of the questionnaire can be a source of confusion and error. In some cases it might also be useful to include an example of how to fill in the questionnaire (e.g. ticking a box, circling a statement), though, clearly, care must be exercised to avoid leading the respondents to answering questions in a particular way by dint of the example provided (e.g. by suggesting what might be a desired answer to the subsequent questions). Verma and Mallick (1999: 121) suggest the use of emboldening to draw the respondent’s attention to significant features.
Ensure that short, clear instructions accompany each section of the questionnaire. Repeating instructions as often as necessary is good practice in a postal questionnaire. Since everything hinges on respondents knowing exactly what is required of them, clear, unambiguous instructions, boldly and attractively displayed, are essential.
Clarity and presentation also impact on the numbering of the questions. For example a four-page questionnaire might contain 60 questions, broken down into four sections. It might be off-putting to respondents to number each question (1–60) as the list will seem interminably long, whereas to number each section (1–4) makes the questionnaire look manageable. Hence it is useful, in the interests of clarity and logic, to break down the questionnaire into subsections with section headings. This will also indicate the overall logic and coherence of the questionnaire to the respondents, enabling them to ‘find their way’ through the questionnaire. It might be useful to preface each subsection with a brief introduction that tells them the purpose of that section.
The practice of sectionalizing and sublettering questions (e.g. Q9 (a) (b) (c) and so on) is a useful technique for grouping together questions about a specific issue. It is also a way of making the questionnaire look smaller than it actually is!
This previous point also requires the questionnaire designer to make it clear if respondents are exempted from completing certain questions or sections of the questionnaire (discussed earlier in the section on filters). If so, then it is vital that the sections or questions are numbered so that the respondent knows exactly where to move to next. Here the instruction might be, for example: ‘if you have answered “yes” to question 10 please go to question 15, otherwise continue with question 11’, or, for example: ‘if you are the school principal please answer this section, otherwise proceed to section three’.
Arrange the contents of the questionnaire in such a way as to maximize cooperation. For example, include questions that are likely to be of general interest. Make sure that questions which appear early in the format do not suggest to respondents that the enquiry is not intended for them. Intersperse attitude questions throughout the schedule to allow respondents to air their views rather than merely describe their behaviour. Such questions relieve boredom and frustration as well as providing valuable information in the process.
Coloured pages can help to clarify the overall structure of the questionnaire and the use of different colours for instructions can assist respondents.
It is important to include in the questionnaire, perhaps at the beginning, assurances of confidentiality, anonymity and non-traceability, for example by indicating that respondents need not give their name, that the data will be aggregated, that individuals will not be able to be identified through the use of categories or details of their location, etc. (i.e. that it will not be possible to put together a traceable picture of the respondents through the compiling of nominal, descriptive data about them). In some cases, however, the questionnaire might ask respondents to put their names so that they can be traced for follow-up interviews in the research (Verma and Mallick, 1999: 121); here the guarantee of eventual anonymity and non-traceability will still need to be given.
Redline et al. (2002) indicate that the placing of the response categories to the immediate right of the text increases the chance of it being answered (the visual location), and making the material more salient (e.g. through emboldening and capitalization) can increase the chances of it being addressed (the visibility issue). This is particularly important for branching questions and instructions.
Redline et al. (2002) also note that questions placed at the bottom of a page tend to receive more non-response than questions placed further up on the page. Indeed they found that putting instructions at the bottom of the page, particularly if they apply to items on the next page, can easily lead to those instructions being overlooked. It is important, then, to consider what should go at the bottom of the page, perhaps the inclusion of less important items at that point. The authors suggest that questions with branching instructions should not be placed at the bottom of a page.
Finally, a brief note at the very end of the questionnaire can: (a) ask respondents to check that no answer has been inadvertently missed out; (b) solicit an early return of the completed schedule; (c) thank respondents for their participation and cooperation, and offer to send a short abstract of the major findings when the analysis is completed.
The purpose of the covering letter/sheet is to indicate the aim of the research, to convey to respondents its importance, to assure them of confidentiality and to encourage their replies. The covering letter/sheet should:
provide a title to the research;
introduce the researcher, her/his name, address, organization, contact telephone/fax/email address, together with an invitation to feel free to contact the researcher for further clarification or details;
indicate the purposes of the research;
indicate the importance and benefits of the research;
indicate why the respondent has been selected for receipt of the questionnaire;
indicate any professional backing, endorsement, or sponsorship of, or permission for, the research (e.g. university, professional associations, government departments). The use of a logo can be helpful here;
set out how to return the questionnaire (e.g. in the accompanying stamped addressed envelope, in a collection box in a particular institution, to a named person; whether the questionnaire will be collected – and when, where and by whom);
indicate the address to which to return the questionnaire;
indicate what to do if questions or uncertainties arise;
indicate a return-by date;
indicate any incentives for completing the questionnaire;
provide assurances of confidentiality, anonymity and non-traceability;
indication of how the results will and will not be disseminated, and to whom;
thank respondents in advance for their cooperation.
Verma and Mallick (1999: 122) suggest that, where possible, it is useful to personalize the letter, avoiding ‘Dear colleague’, ‘Dear Madam/Ms/Sir’, etc., and replacing these with exact names.
With these intentions in mind, the following practices are to be recommended:
The appeal in the covering letter must be tailored to suit the particular audience. Thus, a survey of teachers might stress the importance of the study to the profession as a whole.
Neither the use of prestigious signatories, nor appeals to altruism, nor the addition of handwritten postscripts affects response levels to postal questionnaires.
The name of the sponsor or the organization conducting the survey should appear on the letterhead as well as in the body of the covering letter.
A direct reference should be made to the confidentiality of respondents’ answers and the purposes of any serial numbers and codings should be explained.
A pre-survey letter advising respondents of the forthcoming questionnaire has been shown to have substantial effect on response rates.
A short covering letter is most effective; aim at no more than one page. An example of a covering letter for teachers and senior staff might be:
IMPROVING SCHOOL EFFECTIVENESS
We are asking you to take part in a project to improve school effectiveness, by completing this short research questionnaire. The project is part of your school development, support management and monitoring of school effectiveness, and the project will facilitate a change management programme that will be tailor-made for the school. This questionnaire is seeking to identify the nature, strengths and weaknesses of different aspects of your school, particularly in respect of those aspects of the school over which the school itself has some control. It would be greatly appreciated if you would be involved in this process by completing the sheets attached, and returning them to me. Please be as truthful as possible in completing the questionnaire.
You do not need to write your name, and no individuals will be identified or traced from this, i.e. confidentiality and anonymity are assured. If you wish to discuss any aspects of the review or this document please do not hesitate to contact me. I hope that you will feel able to take part in this project.
Thank you.
Signed
Contact details (address, fax, telephone, email)
Another example might be:
Dear Colleague,
PROJECT ON CONDUCTING EDUCATIONAL RESEARCH
I am conducting a small-scale piece of research into issues facing researchers undertaking investigations in education. The topic is very much under-researched in education, and that is why I intend to explore the area.
I am asking you to be involved as you yourself have conducted empirical work as part of a Master’s or doctorate degree. No one knows the practical problems facing the educational researcher better than you.
The enclosed questionnaire forms part of my investigation. May I invite you to spend a short time in its completion?
If you are willing to be involved, please complete the questionnaire and return it to XXX by the end of November. You may either place it in the collection box at the General Office at my institution or send it by post (stamped addressed envelope enclosed), or by fax or email attachment.
The questionnaire will take around fifteen minutes to complete. It employs rating scales and asks for your comments and a few personal details. You do not need to write your name, and you will not be able to be identified or traced. ANONYMITY AND NON-TRACEABILITY ARE ASSURED. When completed, I intend to publish my results in an education journal.
If you wish to discuss any aspects of the study then please do not hesitate to contact me.
I very much hope that you will feel able to participate. May I thank you, in advance, for your valuable cooperation.
Yours sincerely,
Signed
Contact details (address, fax, telephone, email)
For a further example of a questionnaire see the accompanying website.
It bears repeating that the wording of questionnaires is of paramount importance and that pre-testing is crucial to their success. A pilot has several functions, principally to increase the reliability, validity and practicability of the questionnaire (Oppenheim, 1992; Morrison, 1993: Wilson and McLean, 1994: 47):
to check the clarity of the questionnaire items, instructions and layout;
to gain feedback on the validity of the questionnaire items, the operationalization of the constructs and the purposes of the research;
to eliminate ambiguities or difficulties in wording;
to check readability levels for the target audience;
to gain feedback on the type of question and its format (e.g. rating scale, multiple choice, open, closed, etc.);
to gain feedback on response categories for closed questions and multiple choice items, and for the appropriateness of specific questions or stems of questions;
to identify omissions, redundant and irrelevant items;
to gain feedback on leading questions;
to gain feedback on the attractiveness and appearance of the questionnaire;
to gain feedback on the layout, sectionalizing, numbering and itemization of the questionnaire;
to check the time taken to complete the questionnaire;
to check whether the questionnaire is too long or too short, too easy or too difficult;
to generate categories from open-ended responses to use as categories for closed-response modes (e.g. rating scale items);
to identify how motivating/non-motivating/sensitive/threatening/intrusive/offensive items might be;
to identify redundant questions (e.g. those questions which consistently gain a total ‘yes’ or ‘no’ response (Youngman, 1984: 172)), i.e. those questions with little discriminability;
to identify which items are too easy, too difficult, too complex or too remote from the respondents’ experience;
to identify commonly misunderstood or non-completed items (e.g. by studying common patterns of unexpected response and non-response (Verma and Mallick, 1999: 120));
to try out the coding/classification system for data analysis.
In short, as Oppenheim (1992: 48) remarks, everything about the questionnaire should be piloted; nothing should be excluded, not even the type face or the quality of the paper.
The above outline describes a particular kind of pilot: one that does not focus on data, but on matters of coverage and format, gaining feedback from a limited number of respondents and experts on the items set out above.
There is a second type of pilot. This is one which starts with a long list of items and, through statistical analysis and feedback, reduces those items (Kgaile and Morrison, 2006). For example, a researcher may generate an initial list of, for example, 120 items to be included in a questionnaire, and wish to know which items to excise. A pilot is conducted on a sizeable and representative number of respondents (e.g. 50–100) and this generates real data–numerical responses. These data can be analysed for:
a reliability: those items with low reliability (Cronbach’s alpha for internal consistency: see Part 5) can be removed;
b collinearity: if items correlate very strongly with others then a decision can be taken to remove one or more of them, provided, of course, that this does not result in the loss of important areas of the research (i.e. human judgement would have to prevail over statistical analysis);
c multiple regression: those items with low betas (see Part 5) can be removed, provided, of course, that this does not result in the loss of important areas of the research (i.e. human judgement would have to prevail over statistical analysis);
d factor analysis: to identify clusters of key variables and to identify redundant items (see Part 5).
As a result of such analysis, the items for removal can be identified, and this can result in a questionnaire of manageable proportions. It is important to have a good-sized and representative sample here in order to generate reliable data for statistical analysis; too few respondents to this type of pilot and this may result in important items being excluded from the final questionnaire.
Taking the issues discussed so far in questionnaire design, a range of practical implications for designing a questionnaire can be highlighted:
Operationalize the purposes of the questionnaire carefully.
Be prepared to have a pre-pilot to generate items for a pilot questionnaire, and then be ready to modify the pilot questionnaire for the final version.
If the pilot includes many items, and the intention is to reduce the number of items through statistical analysis or feedback, then be prepared to have a second round of piloting, after the first pilot has been modified.
Decide on the most appropriate type of question – dichotomous, multiple choice, rank orderings, rating scales, constant sum, ratio, closed, open.
Ensure that every issue has been explored exhaustively and comprehensively; decide on the content and explore it in depth and breadth.
Use several items to measure a specific attribute, concept or issue.
Ensure that the data acquired will answer the research questions.
Ask more closed than open questions for ease of analysis (particularly in a large sample).
Balance comprehensiveness and exhaustive coverage of issues with the demotivating factor of having respondents complete several pages of a questionnaire.
Ask only one thing at a time in a question. Use single sentences per item wherever possible.
Keep response categories simple.
Avoid jargon.
Keep statements in the present tense wherever possible.
Strive to be unambiguous and clear in the wording.
Be simple, clear and brief wherever possible.
Clarify the kinds of responses required in open questions.
Balance brevity with politeness (Oppenheim, 1992: 122). It might be advantageous to replace a blunt phrase like ‘marital status’ with a gentler ‘please indicate whether you are married, living with a partner, or single...’ or ‘I would be grateful if would tell me if you are married, living with a partner, or single.’
Ensure a balance of questions which ask for facts and opinions (this is especially true if statistical correlations and crosstabulations are required).
Avoid leading questions.
Try to avoid threatening questions.
Do not assume that respondents know the answers, or have information to answer the questions, or will always tell the truth (wittingly or not). Therefore include ‘don’t know’, ‘not applicable’, ‘unsure’, ‘neither agree not disagree’ and ‘not relevant’ categories.
Avoid making the questions too hard.
Balance the number of negative questions with the number of positive questions (Black, 1999: 229).
Consider the readability levels of the questionnaire and the reading and writing abilities of the respondents (which may lead the researcher to conduct the questionnaire as a structured interview).
Put sensitive questions later in the questionnaire in order to avoid creating a mental set in the mind of respondents, but not so late in the questionnaire that boredom and lack of concentration have set in.
Intersperse sensitive questions with non-sensitive questions.
Be very clear on the layout of the questionnaire so that it is unambiguous and attractive (this is particularly the case if a computer program is going to be used for data analysis).
Avoid, where possible, splitting an item over more than one page, as the respondent may think that the item from the previous page is finished.
Ensure that the respondent knows how to enter a reply to each question, e.g. by underlining, circling, ticking, writing; provide the instructions for introducing, completing and returning (or collection of) the questionnaire (provide a stamped addressed envelope if it is to be a postal questionnaire).
Pilot the questionnaire, using a group of respondents who are drawn from the possible sample but who will not receive the final, refined version.
With the data analysis in mind, plan so that the appropriate scales and kinds of data (e.g. nominal, ordinal, interval and ratio) are used.
Decide how to avoid falsification of responses (e.g. introduce a checking mechanism into the questionnaire responses to another question on the same topic or issue).
Be satisfied if you receive a 50 per cent response to the questionnaire; decide what you will do with missing data and what is the significance of the missing data (that might have implications for the strata of a stratified sample targeted in the questionnaire), and why the questionnaires have not been completed and returned (e.g. were the questions too threatening?, was the questionnaire too long? – this might have been signalled in the pilot).
Include a covering explanation, thanking the potential respondent for anticipated cooperation, indicating the purposes of the research, how anonymity and confidentiality will be addressed, who you are and what position you hold, and who will be party to the final report.
If the questionnaire is going to be administered by someone other than the researcher, ensure that instructions for administration are provided and that they are clear.
A key issue that permeates this lengthy list is for the reader to pay considerable attention to respondents; to see the questionnaire through their eyes, and envisage how they will regard it (e.g. from hostility to suspicion to apathy to grudging compliance to welcome, from easy to difficult, from motivating to boring, from straightforward to complex, etc.).
Questionnaires can be administered in several ways, including:
self-administration
post
face-to-face interview
telephone
internet.
Here we discuss only self-administered and postal questionnaires. Chapter 21 covers administration by face-to-face interview, telephone, and administration by the internet. We also refer readers to Chapter 13 on surveys, to the section on conducting surveys by interview.
The setting in which the questionnaire is completed can also exert an influence on the results. Strange et al. (2003: 343), for example, found that asking students to complete a questionnaire in silence in a classroom or in a hall set out in an examination style might be very challenging for some; some students did not want to complete a questionnaire ‘on their own’ and wanted clarification from other students, some wanted a less ‘serious’ atmosphere to prevail whilst completing the questionnaire, and some (often boys) simply did not complete a questionnaire in conditions that they did not like (p. 344). Researchers will need to consider how best to achieve reliability by taking into account the setting and preferences of the respondents, and this includes, for example, with reference to schools (p. 345):
the timing of the completion;
the school timetable
the space available;
the layout of the room;
the size of the school;
the relationships between the students and the researchers;
the culture of the school and classrooms;
the duration of lessons.
There are two types of self-administered questionnaire: those that are completed in the presence of the researcher and those that are filled in when the researcher is absent (e.g. at home, in the workplace).
Self-administered questionnaires in the presence of the researcher
The presence of the researcher is helpful in that it enables any queries or uncertainties to be addressed immediately with the questionnaire designer. Further, it typically ensures a good response rate (e.g. undertaken with teachers at a staff meeting or with students in one or more classes). It also ensures that all the questions are completed (the researcher can check these before finally receiving the questionnaire) and filled in correctly (e.g. no rating scale items that have more than one entry per item, and no missed items). It means that the questionnaires are completed rapidly and on one occasion, i.e. it can gather data from many respondents simultaneously.
On the other hand, having the researcher present may be threatening and exert a sense of compulsion, where respondents may feel uncomfortable about completing the questionnaire, and may not want to complete it or even start it. Respondents may also want extra time to think about and complete the questionnaire, maybe at home, and they are denied the opportunity to do this.
Having the researcher present also places pressure on the researcher to attend at an agreed time and in an agreed place, and this may be time-consuming and require the researcher to travel extensively, thereby extending the time frame for data collection. Travel costs for conducting the research with dispersed samples could also be expensive.
Self-administered questionnaires without the presence of the researcher
On the other hand, the absence of the researcher is helpful in that it enables respondents to complete the questionnaire in private, to devote as much time as they wish to its completion, to be in familiar surroundings, and to avoid the potential threat or pressure to participate caused by the researcher’s presence. It can be inexpensive to operate, and is more anonymous than having the researcher present. This latter point, in turn, can render the data more or less honest: it is perhaps harder to tell lies or not to tell the whole truth in the presence of the researcher, and it is also easier to be very honest and revealing about sensitive matters without the presence of the researcher.
The down side, however, is that the researcher is not there to address any queries or problems that respondents may have, and they may omit items or give up rather than try to contact the researcher. They may also wrongly interpret and, consequently, answer questions inaccurately. They may present an untrue picture to the researcher, for example answering what they would like a situation to be rather than what the actual situation is, or painting a falsely negative or positive picture of the situation or themselves. Indeed, the researcher has no control over the environment in which the questionnaire is completed, e.g. time of day, noise distractions, presence of others with whom to discuss the questions and responses, seriousness given to the completion of the questionnaire, or even whether it is completed by the intended person.
Frequently, the postal questionnaire is the best form of survey in an educational enquiry. Take, for example, the researcher intent on investigating the adoption and use made of a new curriculum series in secondary schools. An interview survey based upon some sampling of the population of schools would be both expensive and time-consuming. A postal questionnaire, on the other hand, would have several distinct advantages. Moreover, given the usual constraints over finance and resources, it might well prove the only viable way of carrying through such an enquiry.
What evidence we have about the advantages and disadvantages of postal surveys derives from settings other than educational. Many of the findings, however, have relevance to the educational researcher. Here, we focus upon some of the ways in which educational researchers can maximize the response level that they obtain when using postal surveys.
A number of myths about postal questionnaires are not borne out by the evidence (see Hoinville and Jowell, 1978). Response levels to postal surveys are not invariably less than those obtained by interview procedures; frequently they equal, and in some cases surpass, those achieved in interviews. Nor does the questionnaire necessarily have to be short in order to obtain a satisfactory response level. With sophisticated respondents, for example, a short questionnaire might appear to trivialize complex issues with which they are familiar. Hoinville and Jowell (1978) identify a number of factors in securing a good response rate to a postal questionnaire.
Initial mailing
Use good-quality envelopes, typed and addressed to a named person wherever possible.
Use first-class – rapid – postage services, with stamped rather than franked envelopes wherever possible.
Enclose a first-class stamped envelope for the respondent’s reply.
In surveys of the general population, Thursday is the best day for mailing out; in surveys of organizations, Monday or Tuesday are recommended.
Avoid at all costs a December survey (questionnaires will be lost in the welter of Christmas postings in the western world).
Follow-up letter
Of the four factors that Hoinville and Jowell (1978) discuss in connection with maximizing response levels, the follow-up letter has been shown to be the most productive. The following points should be borne in mind in preparing reminder letters:
All of the rules that apply to the covering letter apply even more strongly to the follow-up letter.
The follow-up should re-emphasize the importance of the study and the value of the respondents’ participation.
The use of the second person singular, the conveying of an air of disappointment at non-response and some surprise at non-cooperation have been shown to be effective ploys.
Nowhere should the follow-up give the impression that non-response is normal or that numerous non-responses have occurred in the particular study.
The follow-up letter must be accompanied by a further copy of the questionnaire together with a first-class stamped addressed envelope for its return.
Second and third reminder letters suffer from the law of diminishing returns, so how many follow-ups are recommended and what success rates do they achieve? It is difficult to generalize, but the following points are worth bearing in mind. A well-planned postal survey should obtain at least a 40 per cent response rate and with the judicious use of reminders, a 70 per cent to 80 per cent response level should be possible. A preliminary pilot survey is invaluable in that it can indicate the general level of response to be expected. The main survey should generally achieve at least as high as and normally a higher level of return than the pilot enquiry. The Office of Population Censuses and Surveys recommends the use of three reminders which, they say, can increase the original return by as much as 30 per cent in surveys of the general public. A typical pattern of responses to the three follow-ups is as follows:
Original despatch |
40 per cent |
First follow-up |
+20 per cent |
Second follow-up |
+10 per cent |
Third follow-up |
+5 per cent |
Total |
75 per cent |
Bailey (1994: 163–9) shows that follow-ups can be both by mail and by telephone. If a follow-up letter is sent, then this should be around three weeks after the initial mailing. A second follow-up is also advisable (Bailey, 1994), and this should take place one week after the first follow-up. He reports research (p. 165) that indicates that a second follow-up can elicit up to a 95.6 per cent response rate compared to a 74.8 per cent response with no follow-up. A telephone call in advance of the questionnaire can also help in boosting response rates (by up to 8 per cent).
Incentives
An important factor in maximizing response rates is the use of incentives. Although such usage is comparatively rare in British surveys, it can substantially reduce non-response rates particularly when the chosen incentives accompany the initial mailing rather than being mailed subsequently as rewards for the return of completed schedules. The explanation of the effectiveness of this particular ploy appears to lie in the sense of obligation that is created in the recipient. Care is needed in selecting the most appropriate type of incentive. It should clearly be seen as a token rather than a payment for the respondent’s efforts and, according to Hoinville and Jowell (1978), should be as neutral as possible. In this respect, they suggest that books of postage stamps or ballpoint pens are cheap, easily packaged in the questionnaire envelopes and appropriate to the task required of the respondent.
The preparation of a flow chart can help the researcher to plan the timing and the sequencing of the various parts of a postal survey. One such flow chart suggested by Hoinville and Jowell (1978) is shown in Figure 20.2. The researcher might wish to add a chronological chart alongside it to help plan the exact timing of the events shown here.
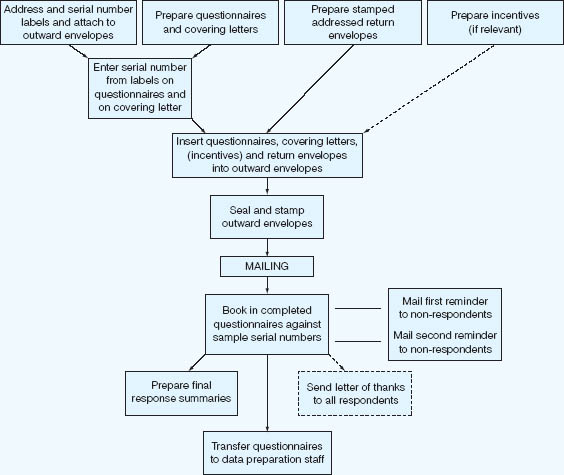
FIGURE 20.2 A flow chart for the planning of a postal survey
Source: Adapted from Hoinville and Jowell, 1978
Our discussion, so far, has concentrated on ways of increasing the response rate of postal questionnaires; we have said nothing yet about the validity of this particular technique.
Validity of postal questionnaires can be seen from two viewpoints according to Belson (1986). First, whether respondents who complete questionnaires do so accurately and second, whether those who fail to return their questionnaires would have given the same distribution of answers as did the returnees.
The question of accuracy can be checked by means of the intensive interview method, a technique consisting of 12 principal tactics that include familiarization, temporal reconstruction, probing and challenging. The interested reader should consult Belson (1986: 35–8).
The problem of non-response (the issue of ‘volunteer bias’ as Belson calls it) can, in part, be checked on and controlled for, particularly when the postal questionnaire is sent out on a continuous basis. It involves follow-up contact with non-respondents by means of interviewers trained to secure interviews with such people. A comparison is then made between the replies of respondents and non-respondents.
Let us assume that researchers have followed the advice we have given about the planning of postal questionnaires and have secured a high response rate to their surveys. Their task is now to reduce the mass of data they have obtained to a form suitable for analysis. ‘Data reduction’, as the process is called, generally consists of coding data in preparation for analysis – by hand in the case of small surveys; by computers when numbers are larger. First, however, prior to coding, the questionnaires have to be checked. This task is referred to as editing.
Editing questionnaires is intended to identify and eliminate errors made by respondents. (In addition to the clerical editing that we discuss in this section, editing checks are also performed by the computer. For an account of computer-run structure checks and valid coding range checks, see Hoinville and Jowell (1978: 150–5)). Moser and Kalton (1977) point to three central tasks in editing:
1 Completeness: a check is made that there is an answer to every question. In most surveys, interviewers are required to record an answer to every question (a ‘not applicable’ category always being available). Missing answers can sometimes be cross-checked from other sections of the survey. At worst, respondents can be contacted again to supply the missing information.
2 Accuracy: as far as is possible a check is made that all questions are answered accurately. Inaccuracies arise out of carelessness on the part of either interviewers or respondents. Sometimes a deliberate attempt is made to mislead. A tick in the wrong box, a ring round the wrong code, an error in simple arithmetic – all can reduce the validity of the data unless they are picked up in the editing process.
3 Uniformity: a check is made that interviewers have interpreted instructions and questions uniformly. Sometimes the failure to give explicit instructions over the interpretation of respondents’ replies leads to interviewers recording the same answer in a variety of answer codes instead of one. A check on uniformity can help eradicate this source of error.
The primary task of data reduction is coding, that is assigning a code number to each answer to a survey question. Of course, not all answers to survey questions can be reduced to code numbers. Many open-ended questions, for example, are not reducible in this way for computer analysis. Coding can be built into the construction of the questionnaire itself. In this case, we talk of precoded answers. Where coding is developed after the questionnaire has been administered and answered by respondents, we refer to post-coded answers. Pre-coding is appropriate for closed-ended questions – male 1, female 2, for example; or single 1, married 2, separated 3, divorced 4. For questions such as those whose answer categories are known in advance, a coding frame is generally developed before the interviewing commences so that it can be printed into the questionnaire itself. For open-ended questions (Why did you choose this particular in-service course rather than XYZ?), a coding frame has to be devised after the completion of the questionnaire. This is best done by taking a random sample of the questionnaires (10 per cent or more, time permitting) and generating a frequency tally of the range of responses as a preliminary to coding classification. Having devised the coding frame, the researcher can make a further check on its validity by using it to code up a further sample of the questionnaires. It is vital to get coding frames right from the outset – extending them or making alterations at a later point in the study is both expensive and wearisome.
There are several computer packages that will process questionnaire survey data. At the time of writing one such is SphinxSurvey. This package, like others of its type, assists researchers in the design, administration and processing of questionnaires, either for paper-based or for onscreen administration. Responses can be entered rapidly, and data can be examined automatically, producing graphs and tables, as well as a wide range of statistics. (The Plus edition offers lexical analysis of open-ended text, and the Lexica Edition has additional functions for qualitative data analysis.) A website for previewing a demonstration of this program can be found at www.scolari.co.uk and is typical of several of its kind.
Whilst coding is usually undertaken by the researcher, Sudman and Bradburn (1982: 149) also make the case for coding by the respondents themselves, to increase validity. This is particularly valuable in open-ended questionnaire items, though, of course, it does assume not only the willingness of respondents to become involved post hoc but, also, that the researcher can identify and trace the respondents, which, as was indicated earlier, is an ethical matter.
 Companion Website
The companion website to the book includes PowerPoint slides for this chapter, which list the structure of the chapter and then provide a summary of the key points in each of its sections. This resource can be found online at www.routledge.com/textbooks/cohen7e.