what is a survey?
Surveys, longitudinal, cross-sectional and trend studies |
CHAPTER 13 |
There are many different kinds of survey; each has its own characteristics and key issues. We set these out in this chapter, addressing such matters as:
what is a survey?
some preliminary considerations
planning a survey
low response and non- response, and how to reduce them
survey sampling
longitudinal, cross- sectional and trend studies
strengths and weaknesses of longitudinal, cohort and cross- sectional studies
postal, interview and telephone surveys
internet- based surveys
comparing methods of data collection in surveys
We advise readers to take this chapter in conjunction with the chapters on sampling, questionnaires, interviews and data analysis techniques. Many researchers reading this book will probably be studying for higher degrees within a fixed and maybe short time frame; that may render longitudinal study out of the question for them. Nevertheless longitudinal study is an important type of research, and we introduce it here. More likely, researchers for higher degrees will find cross- sectional survey research appropriate, and it is widely used in higher degree research.
Many educational research methods are descriptive; that is they set out to describe and to interpret what is. Such studies look at individuals, groups, institutions, methods and materials in order to describe, compare, contrast, classify, analyse and interpret the entities and the events that constitute their various fields of enquiry. We deal here with several types of descriptive survey research, including longitudinal, cross- sectional and trend or prediction studies.
Typically, surveys gather data at a particular point in time with the intention of describing the nature of existing conditions, or identifying standards against which existing conditions can be compared, or determining the relationships that exist between specific events. Thus, surveys may vary in their levels of complexity from those which provide simple frequency counts to those which present relational analysis.
Surveys may be further differentiated in terms of their scope. A study of contemporary developments in post-secondary education, for example, might encompass the whole of Western Europe; a study of subject choice, on the other hand, might be confined to one secondary school. The complexity and scope of surveys in education can be illustrated by reference to familiar examples.
A survey has several characteristics and several claimed attractions; typically it is used to scan a wide field of issues, populations, programmes, etc. in order to measure or describe any generalized features. It is useful (Morrison, 1993: 38–40) in that it usually:
gathers data on a one- shot basis and hence is economical and efficient;
represents a wide target population (hence there is a need for careful sampling, see Chapter 8);
generates numerical data;
provides descriptive, inferential and explanatory information;
manipulates key factors and variables to derive frequencies (e.g. the numbers registering a particular opinion or test score);
gathers standardized information (i.e. using the same instruments and questions for all participants);
ascertains correlations (e.g. to find out if there is any relationship between gender and scores);
presents material which is uncluttered by specific contextual factors;
captures data from multiple choice, closed questions, test scores or observation schedules;
supports or refutes hypotheses about the target population;
generates accurate instruments through their piloting and revision;
makes generalizations about, and observes patterns of response in, the targets of focus;
gathers data which can be processed statistically;
usually relies on large- scale data gathering from a wide population in order to enable generalizations to be made about given factors or variables.
Examples of surveys1 are:
opinion polls (which refute the notion that only opinion polls can catch opinions);
test scores (e.g. the results of testing students nationally or locally);
students’ preferences for particular courses (e.g. humanities, sciences);
reading surveys (e.g. Southgate et al.’s example of teaching practices in 1981 in the United Kingdom).
The websites for the National Child Development Study (NCDS) can be found at www.cls.ioe.ac.uk/text. asp?section=000100020003 and www.cls.ioe.ac.uk/.
Websites for the Centre for Longitudinal Studies (CLS) can be found at www.cls.ioe.ac.uk/, which includes the British Cohort Study and the Millennium Cohort Study.
Surveys in education often use test results, self-completion questionnaires and attitude scales. A researcher using this model typically will be seeking to gather large- scale data from as representative a sample population as possible in order to say with a measure of statistical confidence that certain observed characteristics occur with a degree of regularity, or that certain factors cluster together (see Chapter 37) or that they correlate with each other (correlation and covariance), or that they change over time and location (e.g. results of test scores used to ascertain the ‘value- added’ dimension of education, maybe using regression analysis and analysis of residuals to determine the difference between a predicted and an observed score), or regression analysis to use data from one variable to predict an outcome on another variable.
Surveys can be exploratory, in which no assumptions or models are postulated, and in which relationships and patterns are explored (e.g. through correlation, regression, stepwise regression and factor analysis). They can also be confirmatory, in which a model, causal relationship or hypothesis is tested (see the discussion of exploratory and confirmatory analysis in Chapter 37). Surveys can be descriptive or analytic (e.g. to examine relationships). Descriptive surveys simply describe data on variables of interest, whilst analytic surveys operate with hypothesized predictor or explanatory variables that are tested for their influence on dependent variables.
Most surveys will combine nominal data on participants’ backgrounds and relevant personal details with other scales (e.g. attitude scales, data from ordinal, interval and ratio measures). Surveys are useful for gathering factual information, data on attitudes and preferences, beliefs and predictions, opinions, behaviour and experiences – both past and present (Weisberg et al., 1996; Aldridge and Levine, 2001).
The attractions of a survey lie in its appeal to generalizability or universality within given parameters, its ability to make statements which are supported by large data banks and its ability to establish the degree of confidence which can be placed in a set of findings.
On the other hand, if a researcher is concerned to catch local, institutional or small- scale factors and variables – to portray the specificity of a situation, its uniqueness and particular complexity, its interpersonal dynamics, and to provide explanations of why a situation occurred or why a person or group of people returned a particular set of results or behaved in a particular way in a situation, or how a programme changes and develops over time, then a survey approach is probably unsuitable. Its degree of explanatory potential or fine detail is limited; it is lost to broad brush generalizations which are free of temporal, spatial or local contexts, i.e. its appeal largely rests on the basis of positivism. The individual instance is sacrificed to the aggregated response (which has the attraction of anonymity, non- traceability and confidentiality for respondents).
Surveys typically, though by no means exclusively, rely on large- scale data, e.g. from questionnaires, test scores, attendance rates, results of public examinations, etc., all of which enable comparisons to be made over time or between groups. This is not to say that surveys cannot be undertaken on a small- scale basis, as indeed they can; rather it is to say that the generalizability of such small- scale data will be slight. In surveys the researcher is usually very clearly an outsider, indeed questions of reliability must attach themselves to researchers conducting survey research on their own subjects, e.g. participants in a course that they have been running (e.g. Bimrose and Bayne (1995) and Morrison (1997)). Further, it is critical that attention is paid to rigorous sampling, otherwise the basis of the survey’s applicability to wider contexts is seriously undermined. Non- probability samples tend to be avoided in surveys if generalizability is sought; probability sampling will tend to lead to generalizability of the data collected.
Three prerequisites to the design of any survey are: the specification of the exact purpose of the enquiry; the population on which it is to focus; and the resources that are available. Hoinville and Jowell’s (1978) consideration of each of these key factors in survey planning can be illustrated in relation to the design of an educational enquiry.
First, a survey’s general purpose must be translated into a specific central aim. Thus, ‘to explore teachers’ views about in- service work’ is somewhat nebulous, whereas ‘to obtain a detailed description of primary and secondary teachers’ priorities in the provision of in- service education courses’ is reasonably specific.
Having decided upon and specified the primary objective of the survey, the second phase of the planning involves the identification and itemizing of subsidiary topics that relate to its central purpose. In our example, subsidiary issues might well include: the types of courses required; the content of courses; the location of courses; the timing of courses; the design of courses; and the financing of courses.
The third phase follows the identification and itemization of subsidiary topics and involves formulating specific information requirements relating to each of these issues. For example, with respect to the type of courses required, detailed information would be needed about the duration of courses (one meeting, several meetings, a week, a month, a term or a year), the status of courses (non- award bearing, award bearing, with certificate, diploma, degree granted by college or university), the orientation of courses (theoretically oriented involving lectures, readings, etc., or practically oriented involving workshops and the production of curriculum materials).
As these details unfold, note Hoinville and Jowell (1978), consideration would have to be given to the most appropriate ways of collecting items of information (interviews with selected teachers, postal questionnaires to selected schools, etc.).
The second prerequisite to survey design, the specification of the population to which the enquiry is addressed, affects decisions that researchers must make both about sampling and resources. In our hypothetical survey of in- service requirements, for example, we might specify the population as ‘those primary and secondary teachers employed in schools within a 30- mile radius of Loughborough University’. In this case, the population is readily identifiable and, given sufficient resources to contact every member of the designated group, sampling decisions do not arise. Things are rarely so straightforward, however. Often the criteria by which populations are specified (‘severely challenged’, ‘under- achievers’, ‘intending teachers’ or ‘highly anxious’) are difficult to operationalize. Populations, moreover, vary considerably in their accessibility; pupils and student teachers are relatively easy to survey, gypsy children and headteachers are more elusive. More importantly, in a large survey researchers usually draw a sample from the population to be studied; rarely do they attempt to contact every member. We deal with the question of sampling shortly.
The third important factor in designing and planning a survey is the financial cost. Sample surveys are labour-intensive (see Davidson, 1970), the largest single expenditure being the fieldwork where costs arise out of the interviewing time, travel time and transport claims of the interviewers themselves. There are additional demands on the survey budget. Training and supervising the panel of interviewers can often be as expensive as the costs incurred during the time that they actually spend in the field. Questionnaire construction, piloting, printing, posting, coding, together with computer programming – all eat into financial resources.
Proposals from intending education researchers seeking governmental or private funding are often weakest in the amount of time and thought devoted to a detailed planning of the financial implications of the projected enquiries. (In this chapter we confine ourselves from this point to a discussion of surveys based on self- completion questionnaires. A full account of the interview as a research technique is given in Chapter 21.)
There are two main issues to be addressed here:
1 Will the researcher be completing the survey by entering data, or will the participants be self-administering the survey?
2 How will the survey be administered, e.g. a postal survey, a telephone survey, an internet survey, by face- to-face interviews, by email?
There can be a significant difference in the responses gained from self- reporting and those obtained from face- to-face survey interviews or telephone interviews (Dale 2006: 145). Many surveys ask respondents not only to administer the questionnaires themselves but also to report on themselves. This may introduce bias, as respondents may under- report (e .g. to avoid socially undesirable responses) or over- report (to give socially desirable answers). Self- reporting also requires the researcher to ensure that respondents all understand the question, understand it in the same way and understand it in the way intended by the researcher (Kenett, 2006: 406). The difficulty here is that words are inherently ambiguous (see Chapter 20 on questionnaire design), so the researcher should be as specific as possible. The researcher should also indicate how much contextual information the respondent should provide, what kind of answer is being sought (so that the respondent knows how to respond appropriately), how much factual detail is required, and what constitutes relevant and irrelevant data (e.g. the level of detail or focus on priority issues required) (Kenett, 2006: 407–8). Further, surveys that rely on respondents’ memory may be prone to the bias of forgetting or selective recall.
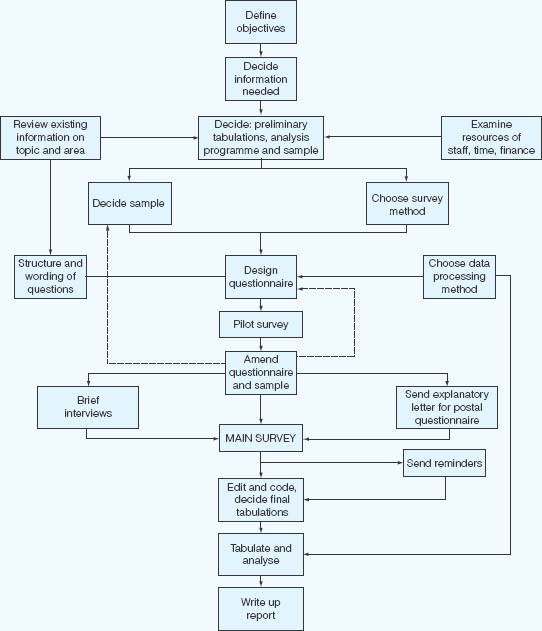
Whether the survey is large scale and undertaken by some governmental bureau or small scale and carried out by the lone researcher, the collection of information typically involves one or more of the following data- gathering techniques: structured or semi-structured interviews, self- completion or postal questionnaires, telephone interviews, internet surveys, standardized tests of attainment or performance, and attitude scales. Typically, too, surveys proceed through well- defined stages, though not every stage outlined in Figure 13.1 is required for the successful completion of a survey.
The process moves from the general to the specific. A general research topic is broken down into complementary issues and questions, and, for each component, questions are set. As will be discussed in questionnaires (Chapter 20), it is important, in the interests of reliability and validity, to have several items or questions for each component issue, as this does justice to the all- round nature of the topic. Sapsford (1999: 34–40) suggests that there are four main considerations in planning a survey:
problem definition (e.g. deciding what kinds and contents of answers are required; what hypotheses there are to be tested; what variables there are to explore);
sample selection (e.g. what is the target population; how can access and representativeness be assured; what other samples will need to be drawn for the purpose of comparison);
design of measurements (e.g. what will be measured, and how (i.e. what metrics will be used – see Chapter 20 on questionnaires); what variables will be required; how reliability and validity will be assured);
concern for participants (e.g. protection of confidentiality and anonymity; avoidance of pain to the respondents; avoiding harm to those who might be affected by the results; avoiding over- intrusive questions; avoiding coercion; informed consent – see Chapter 5 on ethics).
A 14- stage process of planning a survey can be considered:
Stage 1: define the objectives;
Stage 2: decide the kind of survey required (e.g. longitudinal, cross- section, trend study; cohort study);
Stage 3: formulate research questions or hypotheses (if appropriate): the null hypothesis and alternative hypothesis;
Stage 4: decide the issues on which to focus;
Stage 5: decide the information that is needed to address the issues;
Stage 6: decide the sampling required;
Stage 7: decide the instrumentation and the metrics required;
Stage 8: generate the data collection instruments;
Stage 9: decide how the data will be collected (e.g. postal survey, interviews);
Stage 10: pilot the instruments and refine them;
Stage 11: train the interviewers (if appropriate);
Stage 12: collect the data;
Stage 13: analyse the data;
Stage 14: report the results.
Rosier (1997: 154–62) suggests that the planning of a survey will need to include clarification of:
the research questions to which answers need to be provided;
the conceptual framework of the survey, specifying in precise terms the concepts that will be used and explored;
operationalizing the research questions (e.g. into hypotheses);
the instruments to be used for data collection, e.g. to chart or measure background characteristics of the sample (often nominal data), academic achievements (e.g. examination results, degrees awarded), attitudes and opinions (often using ordinal data from rating scales) and behaviour (using observational techniques);
sampling strategies and subgroups within the sample (unless the whole population is being surveyed, e.g. through census returns or nationally aggregated test scores etc.);
pre-piloting the survey;
piloting the survey;
data collection practicalities and conduct (e.g. permissions, funding, ethical considerations, response rates);
data preparation (e.g. coding, data entry for computer analysis, checking and verification);
data analysis (e.g. statistical processes, construction of variables and factor analysis, inferential statistics);
reporting the findings (answering the research questions).
It is important to pilot and pre- pilot a survey. The difference between the pre- pilot and the pilot is significant. Whereas the pre- pilot is usually a series of open- ended questions that are used to generate categories for closed, typically multiple-choice questions, the pilot is used to test the actual survey instrument itself (see Chapter 20).
A rigorous survey, then, formulates clear, specific objectives and research questions, ensures that the instrumentation, sampling and data types are appropriate to yield answers to the research questions, ensures that as high a level of sophistication of data analysis is undertaken as the data will sustain (but no more!).
A survey is no stronger than its weakest point, and we consider a range of issues here in an endeavour to strengthen each aspect of a survey. Surveys have to minimize errors caused by:
poor sampling (e.g. failure to represent or include sufficiently the target population);
poor question design and wording (e.g. failure to catch accurately the views of, or meanings from, the respondents or to measure the factors of interest);
incorrect or biased responses;
low response or non- response.
The first of these – a sampling matter – may be caused by a failure correctly to identify the population and its characteristics, or a failure to use the correct sampling strategy, or systematically to bias the sample (e.g. using a telephone survey based on telephone directory entries, when key people in the population may not have a telephone (e.g. the poor), or may have a cellphone rather than a fixed line (e.g. the young, the middle aged but not the elderly), or using an internet or email based survey, when many respondents do not have access). We address the issue of sampling in Chapter 8 and below.
The second of these is a failure to operationalize the variables fairly (i.e. a validity issue) or a failure in the wording or meanings used or inferred, such that incorrect responses are collected (a reliability issue) (e.g. people may not understand a question, or may misinterpret it, or interpret it differently). We address this in Chapter 10 and below.
The third problem is that some participants may deliberately over- report or under- report the real situation in – often sensitive – matters (e.g. teenage alcohol, smoking or drug use, underage sexual relations, bullying, domestic violence, petty criminality may be systematically under- reported (i.e. biased), whereas popularity of a teacher or students might be over- reported (biased)). Bias obtains where there is a systematic skewing or distortion in the responses. Further, some questions may rely on memory, and memory can be selective and deceptive (e.g. people may not remember accurately). Also, some responses will depend on a person’s state of mind at the time of completing the survey – asking a teacher about teacher stress and tiredness, late on a Friday afternoon in school with a difficult class, could well elicit a completely different response from asking her directly after a week’s holiday. Some questions may be so general as to be unhelpful (e.g. ‘how stressed do you feel?’), whereas others might be so specific as to prevent accurate recall (e.g. ‘how many times have you shouted at a class of children in the past week?’) (one solution to the latter might be to ask participants to keep a diary of instances).
Fowler (2009: 15) suggests that the answer that a respondent gives is a combination of the true response plus an error in the answer given, and he indicates that errors may come from many sources.
The fourth of these – low response or non- response – is a problem that besets researchers, and is so signi-ficant that we devote a separate section to it below.
Non- response to a whole questionnaire (‘unit non-response’ (Durrant, 2009: 293)) or to a specific item (‘item non- response’ (Durrant, 2009: 293)) is a serious problem for much survey research, though Denscombe (2009: 282) notes that online surveys tend to have lower item non- response than paper- based surveys, though there may be more dropouts before reaching the end of an online survey than in a paper- based survey.
Dale (2006: 148) suggests that ‘non- respondents almost invariably differ from respondents’, and that this affects the validity and reliability of the responses obtained, and their analysis. If non- response is received from a very homogenous sample then this might be less of a problem than if the sample is very varied. Further, if non- response is received randomly across a sample then this might be less of a problem than if the non-response was from a particular sub- sector of the respondents (e.g. a very low or a very high socio-economic group), as this would bias the results (cf. Dale, 2006: 148). A subset of non- response to a whole questionnaire is item non- response, and here missing data should not be ignored (Dale, 2006: 15).
Rubin (1987), Little and Rubin (1989), Allison (2001), Dale (2006: 149–50) and Durrant (2006, 2009) review a range of different ‘imputation methods’ for handling and weighting non- response (i.e. methods for filling in data with ‘plausible values’ in order to render a set of data complete and yet to reduce bias in the non-responses, i.e. that bias which might be caused by the non- responses having different values from the non-missing responses (Durrant, 2009: 295)). These depend on whether the non- response is largely confined to a single variable or many variables. The researcher has to determine whether there are patterns of non- response, as these affect the method for handling non- response. For example, if the non- response is randomly distributed across several variables, with no clear patterns of non- response, then this may be less problematic than if there is a systematic non- response to one or more variables in a survey (Durrant, 2009: 295). Durrant sets out several ways of calculating missing values, including, for example:
a calculating missing values from regression techniques using auxiliary variables (p. 296);
b ‘hot deck’ methods, in which subgroups of participants (based on their scores on auxiliary variables) are constructed and the researcher compares their results to the non- missing results of the respondent who had omitted a particular response (p. 297);
c ‘nearest neighbour’ techniques, in which the results from a person whose data diverge as little as possible from those of the missing person are used to replace the missing values.
Durrant (2006, 2009) identifies further, statistical methods of calculating missing scores, such as multiple and fractional imputation, and propensity score weighting. She makes the point that how one calculates the values of missing data depends on a range of factors such as the purpose of the analysis, the variable(s) in question, the kinds of data, any patterns of missing data, and the characteristics and fittingness of the assumptions on which the particular intended imputation method is based. For further guidance on this matter we refer the reader to the sources indicated above.
In some cases (e.g. when all the students in a class complete a questionnaire during a lesson) the response rate may be very high, but in other circumstances the response rate may be very low or zero, either for the whole survey or for individual items within it, for several reasons, e.g.
the survey never reaches the intended people;
people refuse to answer;
people may not be available (e.g. for a survey administered by interview), for example they may be out at work when a telephone survey administrator calls;
people may not be able to answer the questions (e.g. language or writing difficulties);
people may not actually have the information requested;
people may overlook some items in error;
the survey was completed and posted but failed to return;
the pressure of competing activities on the time of the respondent;
potential embarrassment at their own ignorance if respondents feel unable to answer a question;
ignorance of the topic/no background in the topic;
dislike of the contents or subject matter of the interview;
fear of possible consequences of the survey to himself/herself or others;
lack of clarity in the instructions;
fear or dislike of being interviewed;
sensitivity of the topic, or potentially insulting or threatening topic;
betrayal of confidences;
losing the return envelope or return address;
the wrong person may open the mail, and fail to pass it on to the most appropriate person.
Later in this chapter we discuss ways of improving response rates. However, here we wish to insert a note of caution: some researchers suggest that, for non-responders to an item, an average score for that item can be inserted. This might be acceptable if it can be shown that the sample or the population is fairly homogeneous, but, for heterogeneous populations or samples, or those where the variation in the sample or population is not known, it may be dangerous to assume homoge neity and hence to infer what the missing data may look like, as this could distort the results.
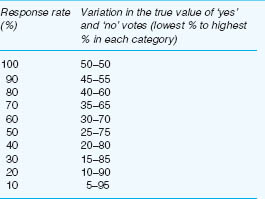
Let us suppose that out of a sample of 200 participants 90 per cent reply (180 participants) to a ‘yes/no’ type of question, e.g. for the question ‘Do you agree with public examinations at age 11?’, and let us say that 50 per cent (90 people) indicate ‘yes’ and 50 per cent indicate ‘no’. If the 10 per cent who did not reply (20 people) would have said ‘yes’ then this would clearly swing the results as 110 people say ‘yes’ (55 per cent) and 90 people say ‘no’ (45 per cent). However, if the response rates vary, then the maximum variation could be very different, as in Table 13.1 (cf. Fowler, 2009: 55). Table 13.1 assumes that if a 100 per sample had replied, 50 per said ‘yes’ and 50 per cent said ‘no; the rest of the table indicates the possible variation depending on response rate.
Table 13.1 indicates the possible variation in a simple ‘yes/no’ type of question. If a rating scale is chosen, for example a 5-point rating scale, the number of options increases from two to five, and, correspondingly, the possibility for variation increases even further.
A major difficulty in survey research is securing a suf-ficiently high response rate to give credibility and reliability to the data. In some postal research, response rates can be as low as 20–30 per cent, and this compromises the reliability of the data very considerably. There is a difference between the intended and the achieved sample (Fogelman, 2002: 105). Punch (2003: 43) suggests that it is important to plan for poor response rates (e.g. by increasing the sample size) rather than trying to adjust sampling post hoc. He also suggests that access to the sample needs to be researched before the survey commences, maybe pre-notifying potential participants if that is deemed desirable. He argues that a poor response level may also be due to the careless omission of details of how and when the questionnaire will be returned or collected. This is a matter that needs to be made clear in the questionnaire itself. In the case of a postal survey a stamped addressed envelope should always be included.
Kenett (2006) and Fowler (2009: 52) report that responses rates increase when people are interested in the subject matter of the survey, or if the subject is very relevant to them, or if the completion of the survey brings a sense of satisfaction to the respondent. Denscombe (2009: 288) reports that response rates increase if the ‘respondent burden’ is low (i.e. the effort required by the respondent to answer a question).
Further, the design, layout and presentation of the survey may also exert an influence on response rate. It is important to include a brief covering letter that explains the research clearly and introduces the researcher. The timing of the survey is important, for example schools will not welcome researchers or surveys in examination periods or at special periods, e.g. Christmas or inspection times (Fogelman, 2002: 106). Finally, it is important to plan the follow-up to surveys, to ensure that non- respondents are called again and reminded of the request to complete the survey. Fowler (2009: 57) indicates that between a quarter and a third of people may agree to complete a survey if a follow- up is undertaken.
There are several possible ways of increasing response rates to mailed surveys, including, for example (e.g. Aldridge and Levine, 2001; Fowler, 2009: 56):
follow- ups and polite reminders (e.g. by mail, email, telephone call) in which the reminder is short, polite, indicating the value of the respondent’s participation and, if the reminder is postal, another clean copy of the questionnaire;
advance notification of the survey (e.g. by telephone, post or email);
pre- paid return stamped addressed envelopes;
institutional affiliation, survey sponsorship or support from a high status agent;
financial incentives (though increasing the financial incentive to a high figure does not bring commensurate returns in response rates);
rewards for return;
making surveys easy to read and to complete;
making instructions about responses and return very clear;
avoid open- ended questions unless these are really important (as the quality of responses is usually poor to open- ended questions: people tend not to write anything or to write very little);
avoid placing open- ended questions at the start of a questionnaire;
make the surveys attractive, with easy- to-follow instructions and spacing of the text;
flatter the participants without being seen to flatter them;
providing information about the research through a covering letter and/or advance notification;
making the survey look very unlike junk mail;
consider asking the respondents for an interview to complete the survey questionnaire;
deliver the questionnaire personally rather than through mail;
ensure that the questions or items are non-judgemental (e.g.in sensitive matters);
assure confidentiality and anonymity.
Cooper and Schindler (2001: 314–15) and Fowler (2009: 58) report that the following factors make little or no appreciable difference to response rates:
personalizing the introductory letter;
writing an introductory letter;
promises of anonymity;
questionnaire length (it is not always the case that a short questionnaire produces more returns than a long questionnaire, but researchers will need to consider the effect of a long survey questionnaire on the respondents – they may feel positive or negative about it, or set it aside temporarily and forget to return it later);
size, reproduction and colour of the questionnaire;
deadline dates for return (it was found that these did not increase response rate but did accelerate the return of questionnaires).
Potential respondents may be persuaded to participate depending on, for example:
the status and prestige of the institution or researcher carrying out the research;
the perceived benefit of the research;
the perceived importance of the topic;
personal interest in the research;
interest in being interviewed, i.e. the interview experience;
personal liking for, or empathy with, the researcher;
feelings of duty to the public and sense of civic responsibility;
loneliness or boredom (nothing else to do);
sense of self- importance.
Dillman (2007) suggests that response rates can be increased if, in sequence: (a) non- respondents are sent a friendly reminder after ten days, stressing the importance of the research; (b) non- respondents are sent a further friendly reminder ten days after the initial reminder, stressing the importance of the research; (c) a telephone call is made to the respondents shortly after the second reminder, indicating the importance of the research.
Fowler (2009: 60) suggests that the initial questionnaire might also include a statement to say that completion and return of the questionnaire will ensure that no follow-up reminders will be sent (though this may be regarded by some respondents as presumptuous).
Sampling is a key feature of a survey approach, and we advise readers to look closely at Chapter 8 on sampling. Because questions about sampling arise directly from the second of our preliminary considerations, that is defining the population upon which the survey is to focus, researchers must take sampling decisions early in the overall planning of a survey (see Figure 13.1). We have already seen that due to factors of expense, time and accessibility, it is not always possible or practical to obtain measures from a population. Indeed Wilson et al. (2006: 352) draw attention to the tension between the need for large samples in order to conduct ‘robust statistical analysis’, and issues of resources such as cost and practicability (p. 353).
Researchers endeavour therefore to collect information from a smaller group or subset of the population in such a way that the knowledge gained is representative of the total population under study. This smaller group or subset is a ‘sample’. Unless researchers identify the total population in advance, it is virtually impossible for them to assess how representative the sample is that they have drawn. Chapter 8 addresses probability and non- probability samples, and we refer readers to the detailed discussion of these in that chapter. The researcher will need to decide the sampling strategy to be used on the basis of fitness for purpose, e.g.
a probability and non- probability sample;
the desire to generalize, and to whom;
the sampling frame (those who are eligible to be included);
the sample size;
the representativeness of the sample;
access to the sample;
the response rate.
Even if the researcher has taken extraordinary care with the sampling strategy, there may still be problems (e.g. response rate, respondent characteristics or availability) that may interfere with the best- laid strategies.
In addition to the sampling strategy to be used, there are the issues of sample size and selection. We discussed this in Chapter 8, but here we wish to address the issue of practicability. For example, let us say that, in the interests of precision, the researcher wishes to have a sample in which there are four strata (e.g. age groups in a primary school), and that each stratum comprised 50 students, i.e. 200 students. If that researcher wished to increase the sample size of one stratum by, say 20 students, this would necessitate an overall increase of 80 students (20 × 4) in the sample. Do the benefits outweigh the costs here?
An alternative to increasing the total size of the sample would be to increase the size of one stratum only, under certain conditions. For example, let us say that the researcher is studying attitudes of males and females to learning science, in a secondary school which had only recently moved from being a single- sex boys’ school to a mixed sex school, so the ratio of male to female students is 4:1. The researcher wishes to include a minimum of 200 female students. This could require a total of 1,000 students in the sample (200 females + {200 × 4} male students in the sample); this could be unmanageable. Rather, the researcher could identify two female students for each male student (i.e. 400 females) and then, when analysing the data, could give one-quarter of the weight to the response of the female students, in order to gain a truer representation of the target population of the school. This would bring the total sample to 600 students, rather than 1,000, involved in the survey. Over-sampling a smaller group (in this case the females), and then weighting the analysis is frequently undertaken in surveys (cf. Fowler, 2009: 27).
In sampling, the probability might also exist of excluding some legitimate members of population in the target sample; however, the researcher will need to weigh the cost of excluding these members (e.g. the very- hard-to- reach) against the cost of ensuring that they are included – the benefit gained from including them may not justify the time, cost and effort (cf. Fowler, 2009: 179). Similarly, the precision gained from stratified sampling (see Chapter 8) may not be worth the price to be paid in necessarily increasing the sample size in order to represent each stratum.
In many cases a sampling strategy may be in more than one stage. For example, let us consider the instance of a survey of 1,000 biology students from a population of 10,000 biology students in a city. In the first stage a group of, say, ten, schools is identified (A), then, within that, an age group of students (B), and then, within that the individuals in that group who are studying biology (C), and, finally, the sample (D) is taken from that group. The intention is to arrive at (D), but, in order to reach this point, a series of other steps has to be taken.
This raises the matter of deciding what are those steps to be taken. For example, the researcher could decide the sampling for the survey of the biology students by taking the random sample of 1,000 students from ten schools. The researcher lists all the 1,000 relevant students from the list of 10,000 students, and decides to select 100 students from each of the ten schools (a biology student, therefore, in one of these ten schools has a 1 in 10 chance of being selected). Alternatively the researcher could decide to sample from five schools only, with 200 students from each of the five schools, so students in each of these five schools have a 1 in 5 chance of being selected. Alternatively, the researcher could decide to sample from two schools, with 500 students, so students in each of these two schools have a 1 in 2 chance of being selected. There are other permutations. The point here is that, as the number of schools decreases, so does the possible cost of conducting the survey, but so does the overall reliability, as so few schools are included. It is a trade- off.
In order to reduce sampling error (the variation of the mean scores of the sample from the mean score of the population), a general rule is to increase the sample, and this is good advice. However, it has to be tempered by the fact that the effect of increasing the sample size in a small sample reduces sampling error more than in a large sample, e.g. increasing the sample size from 50 to 80 (30 persons) will have greater impact on reducing sampling error than increasing the sample size from 500 to 530 (30 persons). Hence it may be unprofitable simply to increase sample sizes in already large samples.
Further, the researcher has to exercise his or her judgement in attending to sampling. For example, if it is already known that a population is homogenous, then the researcher may feel it a needless exercise in having too large and unmanageable a sample if the results are not likely to be much different from those of a small sample of the same homogeneous group (though theoretical sampling (see Chapter 33) may suggest where a researcher needs to include participants from other small samples). As Fowler (2009: 44) remarks, the results of a sample of 150 people will describe a population of 15,000 or 25 million with more or less the same degree of accuracy. He remarks that samples of more than 150 or 200 may not yield more than modest gains to the precision of the data (p. 45), though this, of course, has to be addressed in relation to the population characteristics, the number, size and kind of strata to be included, and the type of sample being used. Sampling errors, he notes (p. 45) are more a function of sample size than of the proportions of the sample to the population. Further, he advocates probability rather than non- probability samples, unless there are persuasive reasons for non- probability samples to be used.
Whilst sample sizes can be calculated on the basis of statistics alone (e.g. confidence levels, confidence intervals, population size and so on, see Chapter 8), this is often not the sole criterion, as it accords a degree of precision to the sample which takes insufficient account of other sampling issues, for example access, variation or homogeneity in the population, levels of literacy in the population (e.g. in the case of a self- administered questionnaire survey) and costs.
Sampling is one of several sources of error in surveys, as indicated earlier in this chapter.
The term ‘longitudinal’ is used to describe a variety of studies that are conducted over a period of time. Often, as we have seen, the word ‘developmental’ is employed in connection with longitudinal studies that deal specifically with aspects of human growth.
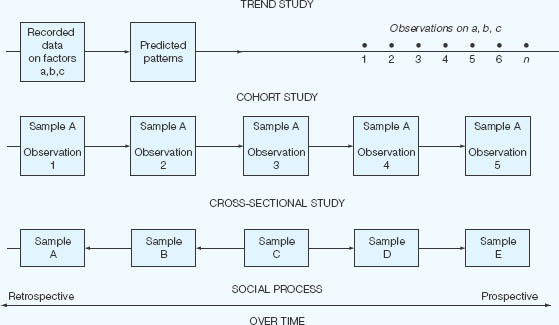
A clear distinction is drawn between longitudinal and cross-sectional studies.2 The longitudinal study gathers data over an extended period of time; a short-term investigation may take several weeks or months; a long- term study can extend over many years. Where successive measures are taken at different points in time from the same respondents, the term ‘follow- up study’ or ‘cohort study’ is used in the British literature, the equivalent term in the United States being the ‘panel study’. The term ‘cohort’ is a group of people with some common characteristic. A cohort study is sometimes differentiated from a panel study. In a cohort study a specific population is tracked over a specific period of time but selective sampling within that sample occurs (Borg and Gall, 1979: 291). This means that some members of a cohort may not be included each time. By contrast, in a panel study each same individual is tracked over time.
Where different respondents are studied at different points in time, the study is called ‘cross- sectional’. Where a few selected factors are studied continuously over time, the term ‘trend study’ is employed. One example of regular or repeated cross- sectional social surveys is the General Household Survey, in which the same questions are asked every year though they are put to a different sample of the population each time. The British Social Attitudes Survey is an example of a repeated cross- sectional survey, using some 3,600 respondents.
A famous example of a longitudinal (cohort) study is the National Child Development Study, which started in 1958. The British General Household Panel Survey interviewed individuals from a representative sample each year in the 1990s. Another example is the British Family Expenditure Survey. These latter two are cross-sectional in that they tell us about the population at a given point in time, and hence provide aggregated data.
By contrast, longitudinal studies can also provide individual level data, by focusing on the same individuals over time (e.g. the Household Panel Studies which follow individuals and families over time (Ruspini, 2002: 4). Lazarsfeld introduced the concept of a panel in the 1940s, attempting to identify causal patterns and the difficulties in tracing causal patterns (Ruspini, 2002: 13)).
Longitudinal studies can be of the survey type or of other types (e.g. case study). Here we confine ourselves to the survey type. Such longitudinal studies can use repeated cross- sectional studies, which are ‘carried out regularly, each time using a largely different sample or a completely new sample’ (Ruspini, 2002: 3), or use the same sample over time. They enable researchers to: ‘analyse the duration of social phenomena’ (Ruspini, 2002: 24); highlight similarities, differences and changes over time in respect of one or more variables or participants (within and between participants); identify long- term (‘sleeper’) effects; and explain changes in terms of stable characteristics, e.g. sex, or variable characteristics, such as income. The appeal of longitudinal research is its ability to establish causality and to make inferences. Ruspini (2002) adds to these the ability of longitudinal research to ‘construct more complicated behavioural models than purely cross- sectional or time- series data’ (p. 26); they catch the complexity of human behaviour. Further, longitudinal studies can combine numerical and qualitative data.
Cohort studies and trend studies are prospective longitudinal methods, in that they are ongoing in their collection of information about individuals or their monitoring of specific events. Retrospective longitudinal studies, on the other hand, focus upon individuals who have reached some defined end- point or state. For example, a group of young people may be the researcher’s particular interest (intending social workers, convicted drug offenders or university dropouts, for example), and the questions to which she will address herself are likely to include ones such as: ‘Is there anything about the previous experience of these individuals that can account for their present situation?’ Retrospective longitudinal studies will specify the period over which to be retrospective, e.g. one year, five years.
Retrospective analysis is not confined to longitudinal studies alone. For example Rose and Sullivan (1993: 185) and Ruane (2005: 87) suggest that cross-sectional studies can use retrospective factual questions, e.g. previous occupations, dates of birth within the family, dates of marriage, divorce, though Rose and Sullivan (1993: 185) advise against collecting other types of retrospective data in cross- sectional studies, as the quality of the data diminishes the further back one asks respondents to recall previous states or even facts.
It is important, in longitudinal studies, to decide when, and how frequently to collect data over time, and this is informed by issues of fitness for purpose as well as practicability. Further, in order to allow for attrition (dropout) of the sample, it is wise to have as large a sample as practicable and possible at the start of the study (Wilson et al., 2006: 354).
A cross-sectional study is one that produces a ‘snapshot’ of a population at a particular point in time. The epitome of the cross- sectional study is a national census in which a representative sample of the population consisting of individuals of different ages, different occupations, different educational and income levels, and residing in different parts of the country is interviewed on the same day. More typically in education, cross-sectional studies involve indirect measures of the nature and rate of changes in the physical and intellectual development of samples of children drawn from representative age levels. The single ‘snapshot’ of the cross-sectional study provides researchers with data for either a retrospective or a prospective enquiry.
A cross-sectional study can also bear several hallmarks of a longitudinal study of parallel groups (e.g. age groups) which are drawn simultaneously from the population. For example, drawing students aged 5, 7, 9 and 11 at a single point in time would bear some characteristics of a longitudinal study in that developments over age groups could be seen, though, of course, it would not have the same weight as a longitudinal study conducted on the same age group over time. This is the case for international studies of educational achievement, requiring samples to be drawn from the same population (Lietz and Keeves, 1997: 122) and for factors that might influence changes in the dependent variables to remain constant across the age groups. Cross- sectional studies, catching a frozen moment in time, may be ineffective for studying change. If changes are to be addressed through cross- sectional surveys, then this suggests the need for repeated applications of the survey, or by the use of trend analysis.
Trend studies focus on factors rather than people, and these factors are studied over time. New samples are drawn at each stage of the data collection, but focusing on the same factors. By taking different samples the problem of reactivity is avoided (see below: ‘pre- test sensitisation’), i.e. earlier surveys affecting the behaviour of participants in the later surveys. This is particularly useful if the research is being conducted on sensitive issues, as raising a sensitive issue early on in research may change an individual’s behaviour, which could affect the responses in a later round of data collection. By drawing a different sample each time this problem is overcome.
Trend or prediction studies have an obvious importance to educational administrators or planners. Like cohort studies, they may be of relatively short or long duration. Essentially, the trend study examines recorded data to establish patterns of change that have already occurred in order to predict what will be likely to occur in the future. In trend studies two or more cross-sectional studies are undertaken with identical age groups at more than one point in time in order to make comparisons over time (e.g. the Scholastic Aptitude and Achievement tests in the United States) (Keeves, 1997a: 141) and the National Assessment of Educational Progress results (Lietz and Keeves, 1997: 122). A major difficulty that researchers face in conducting trend analyses is the intrusion of unpredictable factors that invalidate forecasts formulated on past data. For this reason, short- term trend studies tend to be more accurate than long- term analyses. Trend studies do not include the same respondents over time, so the possibility exists for variation in data due to the different respondents rather than the change in trends. Gorard (2001b: 87) suggests that this problem can be attenuated by a ‘rolling sample’ in which a proportion of the original sample is retained in the second wave of data collection, and a proportion of this sample is retained in the third wave, and so on.
The distinctions we have drawn between the various terms used in developmental research are illustrated in Figure 13.2.
Longitudinal studies of the cohort analysis type have an important place in the research armoury of educational investigators. Longitudinal studies have considerable potential for yielding rich data that can trace changes over time, and with great accuracy (Gorard, 2001b: 86). On the other hand they suffer from problems of attrition (participants leaving the research over time, a particular problem in panel studies which research the same individuals over time), and they can be expensive to conduct in terms of time and money (Ruspini, 2002: 71). Gorard (2001b) reports a study of careers and identities that had an initial response rate of between 60 and 70 per cent in the first round, and then risked dropping to 25 per cent by the third round, becoming increasingly more middle class in each wave of the study. He also discusses a Youth Cohort Study (2001b) in which only 45 per cent of the respondents took part in all three waves of the data collection. Ruspini (2002: 72) identi-fies an attrition rate of 78 per cent in the three waves of the European Community Household Panel survey of the UK in 1997.
Ruspini (2002) also indicates how a small measurement error in a longitudinal study may be compounded over time. She gives the example of an error in income occurring at a point in time (p. 72) that could lead to ‘false transitions’ appearing over time in regard to poverty and unemployment.
Further, long- term studies, Gorard (2001b: 86) avers, face ‘a threat to internal validity’ that stems from the need ‘to test and re- test the same individuals’. Dooley (2001: 120) terms this ‘pre- test sensitisation’; it is also termed ‘panel conditioning’ or ‘time- in sample bias’ (Ruspini, 2002: 73). Here the first interview in an interview survey can cause changes in the second interview, i.e. the first interview may set up a self- fulfilling prophecy that is recorded in the second interview. He gives the example of a health survey in the first round of data collection, which may raise participants’ awareness of the dangers of smoking, such that they reduce or give up smoking by the time the second round takes place. Trend studies overcome this problem by drawing different populations at each stage of the data collection in the research.
Dooley (2001) also raises the issue of the difficulties caused by changes in the research staff over time in longitudinal surveys. Changes in interviewee response, he suggests, may be due to having different researchers rather than to the respondents themselves. Even using the same instruments, different researchers may use them differently (e.g. in interviewing behaviour).
To add to these matters, Ruspini (2002: 73) suggests that longitudinal data are affected by:
a history (events occurring may change the observations of a group under study);
b maturation (participants mature at different speeds and in different ways);
c testing (test sensitization may occur – participants learn from exposure to repeated testing/interviews);
d the timing of cause and effect (some causes may produce virtually instantaneous effects and others may take a long time for the effects to show);
e the direction of causality not always being clear or singular.
A major concern in longitudinal studies concerns the comparability of data over time. For example, though public examinations may remain constant over time (e.g. GCSE, A levels), the contents and format of those examinations do not. (This rehearses the argument that public examinations like A levels are becoming easier over time.) This issue concerns the need to ensure consistency in the data collection instruments over time. Further, if comparability of data in a longitudinal study is to be addressed then this means that the initial rounds of data collection, in the earliest stage of the research, will need to anticipate and include all the variables that will be addressed over time.
Longitudinal studies are more prone to attrition than cross- sectional studies, and are more expensive to conduct in terms of time and cost. On the other hand, whereas trend studies change their populations, thereby disabling micro- level – individual- level – analysis from being conducted, longitudinal analysis enables such individual- level analysis to be performed. Indeed, whereas cross-sectional designs (even if they are repeated cross- sectional designs) may be unsuitable for studying developmental patterns and causality within cohorts, in longitudinal analysis this is a strength. Longitudinal data can supply ‘satisfactory answers to questions concerning the dynamics and the determinants of individual behaviour’ (Ruspini, 2002: 71), issues which are not easily addressed in cross- sectional designs.
Retrospective longitudinal studies rely on the memories of the participants. These may be faulty, and the further back one’s memory reaches, the greater is the danger of distortion or inability to recall. Memory is affected by, for example (Ruspini, 2002: 97):
the time that has elapsed since the event took place;
the significance of the event for the participant;
the amount of information required for the study – the greater the amount, the harder it is to provide;
the contamination/interference effect of other memories of a similar event (i.e. the inability to separate similar events);
the emotional content or the social desirability of the content;
the psychological condition of the participant at interview.
Further, participants will look at past events through the lens of hindsight and subsequent events rather than what those events meant at the time. Further, it is not always easy for these participants to recall their emotional state at the time in question. Factually speaking, it may not be possible to gather data from some time past, as they simply do not exist, e.g. medical records, data on income, or they cannot be found or recovered.
Cohort studies of human growth and development conducted on representative samples of populations are uniquely able to identify typical patterns of development and to reveal factors operating on those samples which elude other research designs. They permit researchers to examine individual variations in characteristics or traits, and to produce individual growth curves. Cohort studies, too, are particularly appropriate when investigators attempt to establish causal relationships, for this task involves identifying changes in certain characteristics that result in changes in others.
Cross-sectional designs are inappropriate in causal research as they cannot sustain causal analysis unless they are repeated over time. Cohort analysis is especially useful in sociological research because it can show how changing properties of individuals fit together into changing properties of social systems as a whole. For example, the study of staff morale and its association with the emerging organizational climate of a newly opened school would lend itself to this type of developmental research. A further strength of cohort studies in schools is that they provide longitudinal records whose value derives in part from the known fallibility of any single test or assessment (see Davie, 1972). Finally, time, always a limiting factor in experimental and interview settings, is generally more readily available in cohort studies, allowing the researcher greater opportunity to observe trends and to distinguish ‘real’ changes from chance occurrences (see Bailey, 1994).
In longitudinal, cohort and trend studies there is the risk that characteristics of the respondents may affect the results (Robson, 1993: 128). For example, their memory, knowledge, motivation and personality may affect their responses, and, indeed, they may withhold information, particularly if it is sensitive.
Longitudinal research indicates the influence of biological factors over time (e.g. human development), environmental influences and intervention influences (Keeves, 1997a: 139) and their interactions. Addressing these, the appeal of longitudinal analysis is that it enables causal analysis to be undertaken. Time series studies in longitudinal research also enable emergent patterns to be observed over time, by examining a given range of variables over time, in addition to other factors. This permits individual and group profiles to be examined over time and development, indicating similarities and differences within and between individuals and groups in respect of given variables. As longitudinal studies do not concern themselves with time-specific infuences, only those naturally occurring influences are included (Keeves, 1997a: 142).
Longitudinal studies suffer several disadvantages (though the gravity of these weaknesses is challenged by supporters of cohort analysis). The disadvantages are first, that they are time- consuming and expensive, because the researcher is obliged to wait for growth data to accumulate. Second, there is the difficulty of sample mortality. Inevitably during the course of a long- term cohort study, subjects drop out, are lost or refuse further cooperation. Such attrition makes it unlikely that those who remain in the study are as representative of the population as the sample that was originally drawn. Sometimes attempts are made to lessen the effects of sample mortality by introducing aspects of cross- sectional study design, that is, ‘topping up’ the original cohort sample size at each time of retesting with the same number of respondents drawn from the same population. The problem here is that differences arising in the data from one survey to the next may then be accounted for by differences in the persons surveyed rather than by genuine changes or trends.
A third difficulty has been termed ‘control effect’ (sometimes referred to as measurement effect). Often, repeated interviewing results in an undesired and confusing effect on the actions or attitudes under study, influencing the behaviour of subjects, sensitizing them to matters that have hitherto passed unnoticed, or stimulating them to communication with others on unwanted topics (see Riley, 1963). Fourth, cohort studies can suffer from the interaction of biological, environmental and intervention influences (Keeves, 1997a: 139). Finally, cohort studies in education pose considerable problems of organization due to the continuous changes that occur in pupils, staff, teaching methods and the like. Such changes make it highly unlikely that a study will be completed in the way that it was originally planned.
Cohort studies, as we have seen, are particularly appropriate in research on human growth and development. Why then are so many studies in this area cross-sectional in design? The reason is that they have a number of advantages over cohort studies; they are less expensive; they produce findings more quickly; they are less likely to suffer from control effects; and they are more likely to secure the cooperation of respondents on a ‘one-off’ basis. Generally, cross-sectional designs are able to include more subjects than are cohort designs.
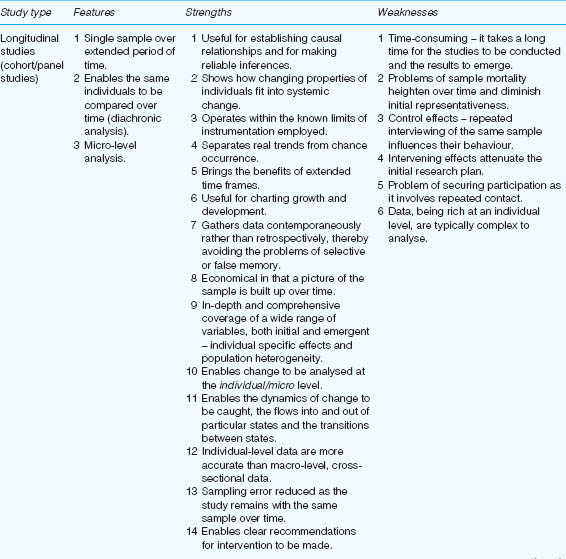
The strengths of cohort analysis are the weaknesses of the cross- sectional design. The cross- sectional study is a less effective method for the researcher who is concerned to identify individual variations in growth or to establish causal relationships between variables. Sampling in the cross- sectional study is complicated because different subjects are involved at each age level and may not be comparable. Further problems arising out of selection effects and the obscuring of irregularities in growth weaken the cross- sectional study so much that one observer dismisses the method as a highly unsatisfactory way of obtaining developmental data except for the crudest purposes. Douglas (1976), who pioneered the first national cohort study to be undertaken in any country, makes a spirited defence of the method against the common criticisms that are levelled against it – that it is expensive and time- consuming. His account of the advantages of cohort analysis over cross- sectional designs is summarized in Box 13.1.
Cross- sectional studies require attention to be given to sampling, to ensure that the information on which the sample is based is comprehensive (Lietz and Keeves, 1997: 124). Further, there is a risk that some potential participants may decline to take part, thereby weakening the sample, or that some respondents may not answer specific questions or, wittingly or unwittingly, give incorrect answers. Measurement error may also occur if the instrument is faulty, for example choosing inappropriate metrics or scales.
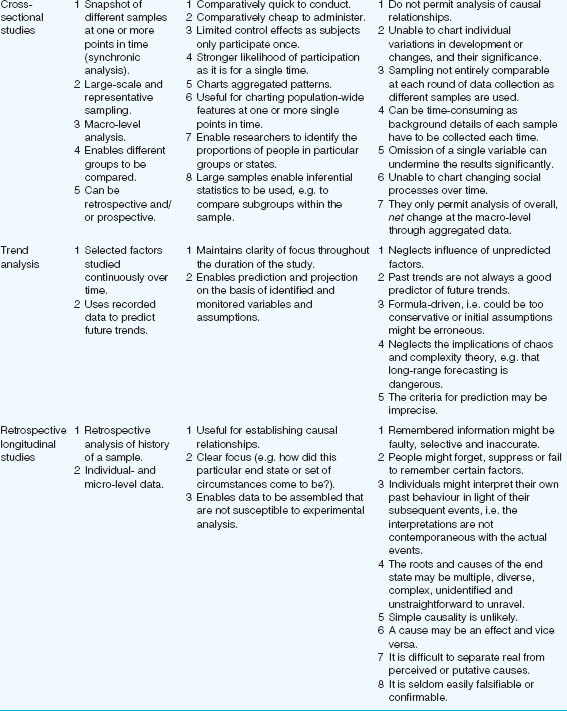
The comparative strengths and weaknesses of longitudinal studies (including retrospective studies), cross-section analysis and trend studies are summarized in Table 13.2 (see also Rose and Sullivan, 1993: 184–8).
Several of the strengths and weaknesses of retrospective longitudinal studies share the same characteristics as those of ex post facto research, discussed in Chapter 15.
BOX 13.1 ADVANTAGES OF COHORT OVER CROSS- SECTIONAL DESIGNS
1 Some types of information, for example on attitudes or assessment of potential ability, are only meaningful if collected contemporaneously. Other types are more complete or more accurate if collected during the course of a longitudinal survey, though they are likely to have some value even if collected retrospectively, for example length of schooling, job history, geographical movement.
2 In cohort studies, no duplication of information occurs, whereas in cross- sectional studies the same type of background information has to be collected on each occasion. This increases the interviewing costs.
3 The omission of even a single variable, later found to be important, from a cross- sectional study is a disaster, whereas it is usually possible in a cohort study to fill the gap, even if only partially, in a subsequent interview.
4 A cohort study allows the accumulation of a much larger number of variables, extending over a much wider area of knowledge than would be possible in a cross- sectional study. This is of course because the collection can be spread over many interviews. Moreover, information may be obtained at the most appropriate time, for example information on job entry may be obtained when it occurs even if this varies from one member of the sample to another.
5 Starting with a birth cohort removes later problems of sampling and allows the extensive use of subsamples. It also eases problems of estimating bias and reliability.
6 Longitudinal studies are free of one of the major obstacles to causal analysis, namely the reinterpretation of remembered information so that it conforms with conventional views on causation. It also provides the means to assess the direction of effect.
Source: Adapted from Douglas, 1976
Robson (1993) indicates strengths and difficulties with postal and interview surveys. Postal surveys can reach a large number of people, gather data at comparatively low cost and quite quickly, and can give assurances of confidentiality (Bailey, 1994: 148). Similarly they can be completed at the respondents’ own convenience and in their preferred surroundings and own time; this will enable them to check information if necessary (e.g. personal documents) and think about the responses. As standardized wording is used, there is a useful degree of comparability across the responses, and, as no interviewer is present, there is no risk of interviewer bias. Further, postal questionnaires enable widely scattered populations to be reached.
Postal surveys can also be used to gather detailed sensitive qualitative data (Beckett and Clegg, 2007), not least because the non- presence of another person (e.g. an interviewer) can increase the honesty and richness of the data (Beckett and Clegg, 2007), whereas the presence of an interviewer might inhibit the respondent. Further, in a postal survey, the relations of power between the researcher and the respondent are often more equal than in an interview situation (in which the former often controls the situation more than the latter) (Beckett and Clegg, 2007: 308).
On the other hand postal surveys typically suffer from a poor response rate, and, because one does not have any information about the non- respondents, one does not know whether the sample is representative of the wider population. Further, respondents may not take the care required to complete the survey carefully, and, indeed, may misunderstand the questions. There is no way of checking this. Bailey (1994: 149) suggests that the very issues that make postal surveys attractive might also render them less appealing, for example:
the standardization of wording;
the inability to catch anything other than a verbal response;
the lack of control over the environment in which the survey questionnaire is completed;
the lack of control over the order in which the questions are read and answered;
the risk that some questions will not be answered;
the inability to record spontaneous answers;
the difficulty in separating non- response from bad response (the former being where the intended respondent receives the survey but does not reply to it, and the latter being where the intended recipient does not receive the survey, e.g. because she/he has moved house);
the need for simplicity in format as there is no interviewer present to guide the respondent through a more complex format.
Postal surveys are an example of self- administered surveys. The anonymity and absence of face- to-face interaction between the interviewer and the respondent can render these useful for asking sensitive questions (Strange et al., 2003: 337), though Fowler (2009: 74) also counsels that sensitive questions can sometimes be handled better in private face- to-face interviews. In self- administered surveys, Fowler (2009: 72) remarks that it is advisable to keep to closed questions and to make the response categories simple and explicit (e.g. ticking a box). If open questions are to be asked then, he indicates, it is better to gather the survey data in a face- to-face interview.
TABLE 13.2 THE CHARACTERISTICS, STRENGTHS AND WEAKNESSES OF LONGITUDINAL, CROSS-SECTIONAL, TREND ANALYSIS AND RETROSPECTIVE LONGITUDINAL STUDIES
Further, Diaz de Rada (2005) reports that the design, size and colour of the paper used in postal surveys affects the response rates. He found that small sized questionnaires were mostly returned by males and those under 64 years of age (p. 69), whilst larger sized questionnaires were mostly returned by females and those over the age of 65 (p. 70). He recommends the use of paper size 14.85 cm × 21 cm (i.e. a sheet of A4 sized paper folded in half ), with white paper, and with a cover page (p. 73) (though this inevitably increases the number of pages in a questionnaire, and this can be off-putting for respondents). He reports that paper size has no effect on the quality of the responses.
Whereas postal surveys are self- administered, interview surveys are supervised, and, hence, potentially prone to fewer difficulties. Interview methods of gathering survey data are useful in that the presence of the interviewer can help clarify queries from the respondents and can stimulate the respondent to give full answers to an on- the-spot supervisor rather than an anonymous researcher known through an introductory letter (Robson, 1993). Indeed, there is evidence that face-to-face encounters improve response rates. Furthermore, as interviews can be flexible, questioners are able both to probe and explain more fully (Bailey, 1994: 174). Interviews are also useful when respondents have problems with reading and writing. Using non- verbal behaviour to encourage respondents to participate is also possible. Moreover, with interviews there are greater opportunities to control the environment in which the survey is conducted, particularly in respect of privacy, noise and external distractions.
The effective interviewer, Fowler (2009: 128) claims, is businesslike and assertive whilst being engaging, friendly and kind. Fowler argues for great care and training to be provided for interviewers, as much can hang on their behaviour.
The potential for trust, rapport and cooperation between the interviewer and the respondent is strong in face- to-face encounters (Dooley, 2001: 122; Gwartney, 2007: 16). Further, interviewers can either ensure that the sequence of the survey protocol is strictly adhered to or they can tailor the order of responses to individual participants, making certain, incidentally, that all questions are answered. Interview surveys, moreover, can guarantee that it is the respondent alone who answers the questions, whereas in postal surveys the researcher never knows what help or comments are solicited from or given by other parties. Bailey (1994) adds that the opportunity for spontaneous behaviour and responses is also possible in interview surveys. Further, interviews can use more complex structures than postal questionnaires, the researcher being on hand to take participants through the schedule.
On the other hand, the very features which make interview methods attractive may also make them problematic. For example, interview survey methods may be affected by the characteristics of the interviewer (e.g. sex, race, age, ethnicity, personality, skills, social status, clothing and appearance). They may also be affected by the conduct of the interview itself (e.g. rapport between the interviewer and the interviewee), and interviewees may be reluctant to disclose some information if they feel that the interview will not be anonymous or if sensitive information is being requested. The flexibility which the interview gives also contributes to the potential lack of standardization of the interview survey, and this may render consistency and, thereby, reliability, a problem. Further, interview surveys are costly in time for the researcher and the interviewee, and, as they are conducted at a fixed time, they may prevent the interviewee from consulting records that may be important to answer the questions. Further, they may require the interviewer to travel long distances to reach interviewees, which can be expensive both in time and travel costs (Bailey, 1994: 175). If interviews are intended to be conducted in the participants’ own homes, then participants may be unwilling to admit strangers. Moreover, neighbourhoods may be dangerous for some researchers to visit (e.g. a white researcher with a clipboard going into a non- white area of great deprivation, or a black researcher going into a conservative white area).
Telephone surveys lie between mailed questionnaires and personal interviews (Arnon and Reichel, 2009). They have the attraction of overcoming any bias in the researcher or the interviewee that may be caused by social characteristics, or matters of age, dress, race, ethnicity, appearance, etc. (e.g. Gwartney, 2007: 16). They also require the interviewer to be an articulate, clear speaker, a good listener and able to key in interviewee responses onto a computer whilst listening and speaking (Gwartney, 2007: 42–3).
It is suggested (Dooley, 2001: 122; Arnon and Reichel, 2009: 179) that telephone interviews have the advantage of reducing costs in time and travel, for where a potential respondent is not at home a call- back costs only a few coins and the time to redial. Re- visits to often distant locations, on the other hand, can incur considerable expense in time and travel. Furthermore, if the intended participant is unable or unwilling to respond, then it is a relatively easy matter to maintain the required sample size by calling a replacement. Again, where respondents are unable or unwilling to answer all the questions required, then their partial replies may be discarded and further substitutes sought from the sample listing. It is easy to see why telephone interviews must always have a much longer list of potential respondents in order to attain the required sample size.
On the other hand, not everyone has a telephone (e.g. the poor, the young, the less educated) and this may lead to a skewed sample (Arnon and Reichel, 2009: 179). Nor, for that matter, is everyone available for interview, particularly if they work. Furthermore, many people are ‘ex- directory’, i.e. their numbers are withheld from public scrutiny. In addition, Dooley (2001: 123) reports that others still (e.g. the younger, unmarried and higher occupational status groups) use answering machines that may screen out and delete researchers’ calls. These could lead to a skewed sample. Indeed Fowler (2009: 75) indicates that telephone surveys tend to elicit more socially desirable answers than face- to-face interviews.
Even when the telephone is answered, the person responding may not be the most suitable one to take the call; she/he may not know the answer to the questions or have access to the kind of information required. For example, in an enquiry about household budgets, the respondent may simply be ignorant about a family’s income or expenditure on particular items. A child may answer the call or an elderly person who may not be the householder. Interviewers will need to prepare a set of preliminary, screening questions or arrange a call- back time when a more appropriate person can be interviewed.
Telephone interviewing has its own strengths and weaknesses. For example, more often than not a respondent’s sex will be clear from their voice, so particular questions may be inappropriate. On the other hand, it is unwise to have several multiple choices in a telephone interview, as respondents will simply forget the categories available, there being no written prompts to which the respondent can refer.
Similarly, order effects can be high: items appearing early in the interview exert an influence on responses to later ones, whilst items appearing early in a list of responses may be given greater consideration than those occurring later, a matter not confined to telephone surveys but to questionnaires in general. Dooley (2001: 136) indicates that 17 per cent difference in agreement was recorded to a general statement question when it appeared before rather than after a specific statement. He cites further research demonstrating that responses to particular questions are affected by questions surrounding them. His advice is to ask general questions before specific ones. Otherwise, the general questions are influenced by earlier responses to specific questions. Once again, this is a matter not confined to telephone surveys but to questionnaires in general.
Further, if the questioning becomes too sensitive, respondents may simply hang up in the middle of the survey interview, tell lies or withhold information. Dooley (2001: 123) reports that, in comparison to face-to-face interviews, telephone respondents tend to produce more missing data, to be more evasive, more acquiescent (i.e. they tend to agree more with statements) and more extreme in their responses (e.g. opting for the extreme ends of rating scales).
Fowler (2009: 73–4) also indicates that, in a telephone survey, it is unwise to have too many response scale points, that it is better to avoid long lists of items, and that it is advisable to read the statement before indicating the response categories, unless a long list of items is to be given (i.e. is unavoidable) in which case he suggests that it is better to read and reread to the respondent the response categories before the list of statements. All of these points take account of the limits of the short- term memories on which respondents might rely in a telephone interview. He also suggests (p. 73) that complex questions can be approached in a staged manner. For example, if a researcher wishes to ask about a ten- category item (e.g. income level of the teacher), then the researcher could start with a general question (e.g. above or below a particular figure), and then, once that category has been identified, proceed to a sub-category, e.g. between such- and-such a figure; this avoids overload of asking a respondent to remember ten categories.
Because telephone interviews lack the sensory stimulation of visual or face- to-face interviews or written instructions and presentation, it is unwise to plan a long telephone survey call. Ten to 15 minutes is often the maximum time tolerable to most respondents, and, indeed 15 minutes for many may be too long. This means that careful piloting will need to take place in order to include those items, and only those items, that are necessary for the research. The risk to reliability and validity is considerable, as the number of items may be fewer than in other forms of data collection.
Procedures for telephone interviews also need to be decided (Gwartney, 2007), e.g.
how many times to let the telephone ring before conceding that there is nobody to answer the call (Gwartney (2007: 99) suggests eight rings);
how to introduce the caller and the project;
what to say and how to introduce items and conduct the interview;
how to determine who is receiving the call and whether he/she is the appropriate person to answer the call;
whether to leave a message on an answer phone/voice- mail/call- back facility and, if so, what that message will be;
how to handle language problems (e.g. which language is being used, meanings/explanations/vocabulary);
how to handle the situation if the receiver asks to call back later;
what to say and how to control the caller’s voice/tone/pitch/speed/pace of questions/repetitions/language/intonation/register;
caller’s pronunciation, enunciation and reading out loud;
caller’s ability to clarify, summarize, reiterate, probe (and when to stop probing), prompt (if the receiver does not understand), confirm, affirm, respond, give feedback, encourage respondents, keep respondents focused and to the point;
how to conduct closed and open questions, sensitive, factual and opinion- based questions;
how to indicate the nature and format of the responses sought;
caller’s ability to handle the called person’s initial hostility, refusal, reluctance to take part, feelings of invasion of privacy, lack of interest, reluctance to disclose information, feelings of being harassed or singled out, anger, antagonism, lack of interest, incomplete answers, hurriedness to complete, slowness or hesitancy, mistrust, rudeness, abusive responses or simply saying that they are too busy;
caller’s ability to remain neutral, impartial and non-judgemental;
how to record responses;
how to end the interview.
It is advisable, also, in order to avoid the frequent responses to ‘cold- calling’ (whereby the called person simply slams down the telephone), for the interviewer to contact the person in advance of the call, perhaps by mail, to indicate that the call will come, when and what it is about, and to ask for the recipient’s cooperation in the project.
It can be seen that many of the features of telephone interviewing are similar to those of effective interviewing per se, and we advise the reader to consult the comments on interviewing earlier and also in Chapter 21.
Using the internet for the conduct of surveys is becoming commonplace in many branches of social science (e.g. Virtual Surveys Limited, 2003). Though internet-based surveys have much in common with paper- based surveys, nevertheless they also have their own particular features.
Internet- based surveys have moved from being in the form of emails to emails- plus-attachments of the questionnaire itself, to emails directing potential respondents to a website, or simply to websites. Whilst emails have the attraction of immediacy, the potential for web- based surveys to include graphics has been too great for many researchers to resist. Often a combination of the two is used: emails direct potential participants to a website at which the survey questionnaire is located in HTML form. Though email surveys tend to attract greater response than web-based surveys, web-based surveys have the potential to reach greater numbers of participants, so web- based surveys are advisable; emails can be used as an addition, to contact participants to advise them to go to a particular website. Internet surveys have the added attraction of being cheap to administer. Though they take time to prepare, there are many online internet survey templates and (free) services available, e.g.
http://free- online-surveys.co.uk/
www.questionpro.com/internet-survey-software.html
www.magicsurveytool.com/email_surveys.html
www.my3q.com/misc/register/register.phtml
Several of these also automatically collate and present results.
Dillman et al. (1998a, 1998b, 1999) set out several principles of web- based surveys. Some of these are technical and some are presentational. For example, in terms of technical matters, they found that the difference between simple and ‘fancy’ (sic) versions of questionnaires (the former with few graphics, the latter with many, using sophisticated software) could be as much as three times the size of the file to be downloaded (317k in contrast to 959k), with a time of downloading of 225 seconds for the plain version and 682 seconds for the ‘fancy’ version. They found (1998a) that respondents with slow browsers or limited power either spent longer in downloading the file or, indeed, the machine crashed before the file was downloaded. They also found that recipients of plain versions were more likely to complete a questionnaire than those receiving fancy versions (93.1 per cent and 82.1 per cent respectively), as it took less time to complete the plain version. Utilizing advanced page layout features does not translate into higher completion rates, indeed, more advanced page layout reduced completion rates. This echoes the work of Fricker and Schonlau (2002) who report studies that indicate a 43 per cent response rate to an email survey compared to a 71 per cent response rate for the same mailed paper questionnaire. Indeed they report that it is only with specialized samples (e.g. undergraduates) that higher response rates can be obtained in an internet survey.
For presentational matters Dillman and his colleagues (1998a, 1999) make the point that in a paper-based survey the eyes and the hands are focused on the same area, whilst in a web- based survey the eyes are focused on the screen whilst the hands are either on the keyboard or on the mouse, and so completion is more difficult. This is one reason to avoid asking respondents to type in many responses to open- ended questions, and replacing these with radio buttons or clicking on a mouse that automatically inserts a tick into a box (Witte et al., 1999: 139). Further, some respondents may have less developed computer skills than others. They suggest a mixed mode of operation (paper- based together with web- based versions of the same questionnaire). The researchers also found that ‘check-all-that-apply’ lists of factors to be addressed had questionable reliability, as respondents would tend to complete those items at the top of the list and ignore the remainder. Hence they recommend avoiding the use of check-all-that-apply questions in a web- based survey.
Similarly they advocate keeping the introduction to the questionnaire short (no more than one screen), informative (e.g. of how to move on) and avoiding giving a long list of instructions. Further, as the first question in a survey tends to raise in respondents’ minds a particular mindset, care is needed on setting the first question, to entice participants and not to put them off participating (e.g. not too difficult, not too easy, interesting, straightforward to complete, avoiding drop- down boxes and scrolling). Dillman et al. (1998a, 1998b, 1999) make specific recommendations about the layout of the screen, for example keeping the response categories close to the question for ease of following, using features like brightness, large fonts and spacing for clarity in the early parts of the survey. They also suggest following the natural movement of the eyes from the top left (the most important part of the screen, hence the part in which the question is located) to the bottom right quadrants of the screen (the least important part of the screen which might contain the researcher’s logo). They comment that the natural movement of the eye is to read prose unevenly, with the risk of missing critical words, and that this is particularly true on long lines, hence they advocate keeping lines and sentences short (e.g. by inserting a hard break in the text or to use table- editing features, locating the text in a table frame). Taking this further, they also advocate the use of some marker to indicate to the respondent where he or she has reached in the questionnaire (e.g. a progress bar or a table that indicates what proportion of the questionnaire has been completed so far).
Respondents may not be familiar with web- based questionnaires, e.g. with radio buttons, scroll bars, the use of the mouse, the use of drop- down menus, where to insert open- ended responses, and the survey designer must not overestimate the capability of the respondent to use the software, though Roztocki and Lahri (2002) suggest that there is no relationship between perceived level of computer literacy and preference for web- based surveys. Indeed their use may have to be explained in the survey itself. Dillman et al. (1999) suggest that the problem of differential expertise in computer usage can be addressed in three ways:
1 by having the instructions for how to complete the item next to the item itself (not all placed together at the start of the questionnaire);
2 by asking the respondents at the beginning about their level of computer expertise, and, if they are more expert, offering them the questionnaire with certain instructions omitted, and if they are less experienced, directing them to instructions and further assistance;
3 having a ‘floating window’ that accompanies each screen and which can be maximized for further instructions.
Some web- based surveys prevent respondents from proceeding until they have completed all the items on the screen in question. Whilst this might ensure coverage, it can also both anger respondents – such that they give up and abandon the survey – or prevent them from having a deliberate non- response (e.g. if they do not wish to reveal particular information, or if in fact the question does not apply to them, or if they do not know the answer). Hence the advice of Dillman et al. (1999) is to avoid this practice. One way to address this matter is to give respondents the opportunity to answer an item with ‘prefer not to answer’ or ‘don’t know’. The point that relates to this is that it is much easier for participants in a web- based survey to abandon the survey – a simple click of a button – so more attention has to be given to keeping them participating than in a paper-based survey.
Redline et al. (2002) suggest that branching instructions (e.g. ‘skip to item 13’, ‘go to item 10’; ‘if “yes” go to item 12, if “no” then continue’) can create problems in web- based surveys, as respondents may skip over items and series of questions that they should have addressed. This concerns the location of the instruction (e.g. to the right of the item, underneath the item, to the right of the answer box). Locating the instruction too far to the right of the answer box (e.g. more than nine characters of text to the right) can mean that it is outside the foveal view (2 degrees) of the respondent’s vision, and, hence, can be overlooked. Further, they report that having a branching instruction in the same font size and colour as the rest of the text can result in it being regarded as unimportant, not least because respondents frequently expect the completion of a form to be easier than it actually is. Hence they advocate making the instruction easier to detect by locating it within the natural field of vision of the reader, printing it in a large font to make it bolder and using a different colour. They report that, for the most part, branching instruction errors occur because they are overlooked and respondents are unaware of them rather than deliberately disregarding them (p. 18).
The researchers also investigated a range of other variables that impacted on the success of using branching programs, and reported the following:
the number of words in the question has an impact on the reader: the greater the number of words the less is the likelihood of correct branching processing by the reader, as the reader is too absorbed with the question than with the instructions;
using large fonts, strategies and verbal design to draw attention to branching instructions leads to greater observance of these instructions;
the number of answer categories can exert an effect on the reader: more than seven categories and the reader may make errors and also overlook branching instructions;
having to read branching instructions at the same time as looking at answer categories results in overlooking the branching instructions;
locating the branching instruction next to the final category of a series of answer boxes is a much safer guarantee of it being observed than placing it further up a list; this may mean changing the order of the list of response categories, so that the final category naturally leads to the branching instruction;
branching instructions should be placed where they are to be used and where they can be seen;
response- order effects operate in surveys, such that respondents in a self- administered survey tend to choose earlier items in a list rather than later items in a list (the primacy effect), thereby erroneously acting on branching instructions that appear with later items in a list;
questions with alternating branches (i.e. more than one branch) may be forgotten by the time they need to be acted upon after respondents have completed an item;
if every answer has a branch then respondents may overlook the instructions for branching as all the branches appear to be similar;
if respondents are required to write an open- ended response this may cause them to overlook a branching instruction as they are so absorbed in composing their own response and the branching instruction may be out of their field of vision when writing in their answer;
items that are located at the bottom of a page are more likely to elicit a non- response than items further up a page, hence if branching instructions are located near the bottom of a page they are more likely to be overlooked; placing branching instructions at the bottom of the page should be avoided;
if the branching instructions are located too far from the answer box then they may be overlooked.
These pieces of advice from the research can be applied not only to online survey questionnaires but are also useful in the construction of paper- based survey questionnaires.
Dillman et al. (1999) and Dillman and Bowker (2000: 10–11) suggest that successful web- based surveys: (a) take account of the inability of some respondents to access and respond to web questionnaires that include advanced programming features (e.g. that may require software that the respondents do not have or which download very slowly); and (b) match the expectations of the respondents in completing the questionnaire design and layout.
There are several ‘principles’ for designing web-based questionnaires (e.g. Dillman et al., 1999; Dillman and Bowker, 2000: 10–11; Shropshire et al., 2009):
Start the web questionnaire with a welcome screen that will motivate the respondents to continue, which makes it clear that it is easy to complete and gives clear instructions on how to proceed.
Provide a PIN number in order to limit access to those people sought in the sample.
Ensure that that first question can be seen in its entirety on the first screen, and is easy to understand and complete.
Embed visual images in a survey (as this reduces premature dropout from the survey).
Place interest- based questions early on in the survey, as this, too, reduces premature dropout.
Ensure that the layout of each question is as close as possible to a paper format, as respondents may be familiar with this.
Ensure that the use of colour keeps the figure/ground consistency and readability, so that it is easy to navigate through the questionnaire and navigational flow is unimpeded, and so that the measurement properties of questions are clear and sustained.
Avoid differences in the visual appearance of questions that may happen as a result of different computers, configurations, operating systems, screen displays (e.g. partial and wrap- around text) and browsers.
Keep the line length short, to fit in with the screen size.
Minimize the use of drop-down boxes, and direct respondents to them where they occur.
Give clear instructions for how to move through the questionnaire using the computer.
Make instructions for skipping parts very clear.
Keep instructions for computer actions to be taken at the point where the action is needed, rather than placing them all at the start of the questionnaire.
Avoid requiring respondents to answer each question before being able to move on to the next questions.
Ensure that questionnaires scroll easily from question to question, unless order effects are important.
If multiple choices are presented, try to keep them to a single screen; if this is not possible then consider double columns, providing navigational instructions.
Provide graphical symbols or words to indicate where the respondent has reached in the questionnaire.
Avoid the kinds of questions that cause problems in paper questionnaires (e.g. tick- all-those- that-apply kinds of question).
Additionally, Heerwegh et al. (2005) report that personalizing the e- survey (i.e. using the recipient’s name in the salutation) increases response rates by 8.6 percentage points (e.g. starting an e- survey letter with Dear [name of specific person]), though care has to be taken to ensure consistency, e.g. it is counterproductive to start an e- survey letter with Dear [name of person] and then, later, to refer to ‘student’, ‘colleague’, etc. (i.e. a depersonalized version). The authors indicate that personalizing an e- survey increases the chances of a respondent starting the survey (p. 92) rather than dropout rates during the survey; whether participants continue and complete the survey depends on other factors, for example the difficulty in completing the items, the relevance of the topic to the respondents and the user- friendliness of the survey. They also report (p. 94) that personalizing an e- survey increases participant honesty on sensitive matters (e.g. number of sexual partners) and adherence to survey instructions (p. 96) and also increases the tendency of respondents to answer questions in a socially desirable way.
Denscombe (2009: 286–7) reports that, for online surveys, fixed choice questions tend to have a ‘lower item- response rate than open- ended questions’, and, for open- ended questions, item non- response is lower in online surveys than in paper- based surveys.
Christian et al. (2009) report that if a survey questionnaire presents the positive end of a scale first then, whilst it does not make a difference to the response, it does increase response time (which might lead to dropping out). They also note that if the positive categories are given lower numbers (e.g. ‘1’ and ‘2’), and the negative categories are given high numbers (e.g. ‘4’and ‘5’) then this can increase response times. Further, they report that displaying ‘the categories in multiple columns’ increases response time, as does giving the poles of rating scales numbers rather than words.
Toepoel et al. (2009) also suggest that account has to be taken of the ‘cognitive sophistication’ of the respondents, as those with less cognitive sophistication tend to be affected by contextual clues more than those respondents with more cognitive sophistication. Context effects occur when a particular item is affected by the items around it or which precede it, in effect providing cues for the respondent, or in which a particular mindset of responses is created in the respondent (Friedman and Amoo, 1999).
The most widely used data collection instrument for internet surveys is the questionnaire. There are several claimed advantages to using an internet questionnaire in comparison to a paper questionnaire (e.g. Watt, 1997; Dillman et al., 1999; Dillman and Bowker, 2000; Aldridge and Levine, 2001; Roztocki and Lahri, 2002; Glover and Bush, 2005; Fowler, 2009):
it reduces cost (e.g. of postage, paper, printing, keying in data, processing data, interviewer costs);
it reduces the time taken to distribute, gather and process data (data entered onto a web- based survey can be processed automatically as soon as they are entered by the respondent rather than being keyed in later by the researcher);
it enables a wider and much larger population to be accessed;
it enables researchers to reach difficult populations under the cover of anonymity and non- traceability;
it may have novelty value (though this decreases over time);
respondents can complete the questionnaire from home (rather than, for example, in the workplace), i.e. in self- chosen and familiar settings;
respondents can complete it at a time to suit themselves, thereby minimizing organizational constraints on the part of the researcher or the respondents;
respondents can complete the survey over time (i.e. they do not need to do it all at one sitting);
complex skip- patterns can be created and organized by the computer, so that participants do not have to understand complicated instructions, i.e. so that automated navigation through the questionnaire can occur;
the software can prompt respondents to complete missed items or to correct errors (e.g. two ticks for a single item in a rating scale);
the computer can check incomplete or inconsistent replies;
for each screen, the computer can provide an onscreen indication of how much of the questionnaire has been completed (e.g. 50 per cent completed, 75 per cent completed);
reduction of researcher effects;
responses in web- based surveys show fewer missing entries than paper- based surveys;
human error is reduced in entering and processing online data;
additional features may make the survey attractive (e.g. graphics, colour, fonts and so on);
greater generalizability may be obtained as internet users come from a wide and diverse population;
because of volunteer participation (i.e. an absence of coercion), greater authenticity of responses may be obtained.
With regard to costs, Watt (1997) alerts us to the fact that cost savings always make a difference in comparison to a telephone survey, but that an internet- based survey is only slightly cheaper than a mail survey unless that web- based survey gathers data from more than around 500 participants, as the costs in terms of development and design time are considerable. Over 500, and the internet- based survey makes considerable cost savings. Further, Fricker and Schonlau (2002) suggest that the claims that internet- based surveys are cheaper and faster are not always borne out by the evidence, and that, if internet survey development, programming, testing and modification time, initial contact time and follow-up time to ensure an increased response rate are factored in, then the savings may not be as strong as the claims made. That said, they do acknowledge that as internet surveys develop they are likely to meet these claims. Reips (2002a, 2002b) suggests that though there may be costs in terms of laboratory space, equipment and administration, these have to be offset by development costs. The jury is still out on overall time cost savings.
Glover and Bush (2005) suggest that response rates for internet- based surveys are generally higher than for conventional approaches (though there is some evidence to challenge this), and that e- surveys overcome spatial and temporal constraints (e.g. researchers and participants can be separated from each other in time and physical distance). Further, they report (pp. 140–3) that participants tended to respond more quickly and more fully, reflectively and incisively than in conventional postal questionnaires, particularly when e- reminders were sent (see also Deutskens et al., 2005). Deutskens et al. (2005: 2), whilst reporting higher quality data, higher item completion and response, higher item variability and fewer missing values in online surveys, also report that these findings are not unequivocal, and that more extreme responses might be elicited.
In comparing online and conventional surveys, one has to examine not only the means, range and standard deviations of results, but also the factor structure (is it the same in both, i.e. when factor analysis is conducted are the same factors and variables extracted) and the variables loadings onto the factors (whether they are the same or similar in both online and paper surveys).
On the other hand, internet- based surveys are not without their problems. Some of these are indicated below (Table 13.3), together with possible solutions (Coomber, 1997; Dillman et al., 1999; Dillman and Bowker, 2000; Witmer et al., 1999; Frick et al., 1999; Solomon, 2001; Reips, 2002a, 2002b; Dillman et al., 2003; Hewson et al., 2003; Smyth et al., 2004; Glover and Bush, 2005).
TABLE 13.3 PROBLEMS AND SOLUTIONS IN INTERNET-BASED SURVEYS
Problem (sampling) |
Possible solution |
Some subsample groups may be under-represented in the respondents |
Adjust the results by weighting the sample responses (see the comments on a ‘boosted sample’ and ‘weighting’ in chapter 4) |
There may be coverage error (not everyone has a nonzero chance of being included) |
Disclose the sample characteristics in reporting |
Non-response and volunteer bias |
Follow-up messages posted on websites and electronic discussion groups. use emails to contact potential participants. require the respondents to submit their replies screen by screen. (this enables the researcher not only to use some data from incomplete responses, but also enables her to identify in detail patterns of non-response, i.e. responding is not an all-or-nothing affair (either submit the whole questionnaire or none of it) but can be partial (a respondent may answer some questions but not others)) |
Problem (ethics) |
Possible solution |
Respondents may wish to keep their identity from the researcher, and an email address identifies the respondent (in the case of sensitive research, e.g. on child abuse or drug abuse, this may involve criminal proceedings if the identity of the respondent is known or able to be tracked by criminal investigators who break into the site). non-traceability of respondents may be problematic |
Direct respondents to a website rather than to using email correspondence. Provide advice on using non-traceable connections to access and return the survey (e.g. an internet café, a library, a university). advise the respondent to print off the survey and return it by post to a given address. avoid asking respondents to enter a password or to give an email address. Prevent access to unprotected directories and confidential data |
Respondents may not know anything about the researcher, or if it is a bona fide piece of research and not simply a marketing ploy |
Include the researcher’s affiliation (e.g. university), with a logo if possible |
Informed consent |
Ensure that it is easy for respondents to withdraw at any time (e.g. include a ‘Withdraw’ button at the foot of each screen) |
Problem (technical: hardware and software) |
Possible solution |
The configuration of the questionnaire may vary from one machine to another (because of web browsers, connection, hardware, software) and can lead to dropout |
Opt for simplicity. test the survey on different computer systems/browsers to ensure consistency. avoid surveys that require real-time completion |
The screen as set out by the survey designer may not appear the same as that which appears on the respondent’s screen |
Opt for simplicity. use a commercial survey software system for generating the questionnaire. avoid high level programs |
Slow network connections or limited bandwidth can slow down loading |
Keep the use of graphics to a minimum. advise on the possible time it takes to load |
Respondents may not have the same software, or the same version of the software as the sender, rendering downloading of the questionnaire either impossible or distorting the received graphics |
Avoid the use of graphics and more advanced software programs |
Graphics may be corrupted/incompatible between the sender and the user, i.e. between one kind of machine, user platform and software and another. hardware may differ between sender and receiver |
Opt for simplicity. use commercially available web-based surveying systems and packages. Use image files (e.g. .jpeg, .gif) to reduce loading time. Avoid pop-ups if possible as they reduce response rate |
The greater the use of graphics and plug-ins (e.g. using Java and applets), the longer it takes to download, and, particularly – though not exclusively – if respondents do not have broadband access then time-consuming downloads could result in either the respondent giving up and cancelling the download, or creating a bad mood in the respondent |
Keep software requirements as low-tech as possible. Avoid questionnaires that use sophisticated computer graphics |
There may be slow loading times due to internet congestion |
Avoid sophisticated graphics and ‘fancy’ presentations as these take longer to download |
The physical distance between points on an attitude scale may spread out because of configuration differences between machines |
Indicate how best the questionnaire may be viewed (e.g. 800 3 400) |
The construction procedures for wrap-around text may vary between computers |
Keep lines of text short |
Email questionnaires may distort the layout of the questionnaire (some email software uses HTML, others do not) |
Avoid sending a questionnaire directly using email; rather, post it on a website (e.g. so that respondents visit a website and then click a box for immediate transfer to the questionnaire). Consider using an email to direct participants to a website (e.g. the email includes the website which can be reached by clicking in the address contained in the email). Use an email that includes an attachment which contains the more graphically sophisticated survey instrument itself |
Problem (respondents) |
Possible solution |
Respondents may be unfamiliar or inexperienced with the internet and the media |
Keep the questionnaire simple and easy to complete |
Respondents may send multiple copies of their completed questionnaire from the same or different addresses |
Have a security device that tracks and limits (as far as possible) respondents who may be returning the same questionnaire on more than one occasion. Use passwords (though this, itself, may create problems of identifiability). Collect personal identification items. Check for internal consistency across submissions |
There may be more than one respondent to a single questionnaire (the same problem as in, for example, a postal questionnaire) |
Include questions to cross-check the consistency of replies to similar items |
Respondents may not be used to pull-down menus |
Provide clear instructions |
Drop-down boxes take up more space on a screen than conventional questionnaires |
Avoid their overuse |
Respondents dislike the situation where the computer prevents them from continuing to the next screen until all the items on a particular screen have been completed |
Avoid this unless considered absolutely necessary |
The language of email surveys can risk offending potential participants (‘flaming’) |
Check the language used to avoid angering the participants |
Respondents’ difficulty in navigating the pages of the online survey |
Keep instructions to the page in question. Make the instructions for branching very clear (font size, colour, etc.) |
Problem (layout and presentation) |
Possible solution |
A page of paper is longer than it is wide, but a screen is wider than it is long, and a screen is smaller than a page, i.e. layout becomes a matter of concern |
Remember that screen-based surveys take a greater number of screens than their equivalent number of pages in a paper copy. Sectionalize the questionnaire so that each section fills the screen, and does not take more than one screen |
The layout of the text and instructions assumes greater importance than for paper questionnaires |
Opt for clarity and simplicity |
The layout uses a lot of grids and matrices |
Avoid grids and matrices: they are a major source of non-response |
The order of items affects response rates |
Locate requests for personal information at the beginning of the survey. include ‘warm-ups’ and early ‘high hurdles’ to avoid dropout |
Respondents may be bombarded with too much information in an introductory message |
Place the advertisement for the survey on user groups as well as for the general public, inviting participants to contact such-and-such a person or website for further information and the questionnaire itself, i.e. separate the questionnaire from the advertisement for/introduction to the questionnaire |
Respondents may be overloaded with instructions at the beginning of the survey |
Avoid placing all the instructions at the start of the questionnaire, but keep specific instructions for specific questions |
Respondents may be overloaded with information at the beginning of the survey |
Keep the initial information brief and embed further information deeper in the survey |
Respondents may have to take multiple actions in order to answer each question (e.g. clicking on an answer, moving the scroll bar, clicking for the next screen, clicking to submit a screen of information) |
Keep the number of actions required in order to move on to a minimum |
Respondents may not be able to see all the option choices without scrolling down the screen |
Ensure that the whole item and options are contained on a single screen |
Respondents may not understand instructions |
Provide a helpline, email address or contact details of the researcher. Pilot the instrument |
Instructions about options may be unclear |
Use radio buttons for single choice items, and try to keep layout similar to a paper layout |
Respondents only read part of each question before going to the response category |
Keep instructions and words to a necessary minimum |
As suggested in these lists, the importance of the visual aspect of questionnaires is heightened in internet surveys (Smyth et al., 2004), and this affects the layout of questions, instructions and response lists, the grouping of items, the colours used, the spacing of response categories, the formatting of responses (e.g. writing in words or ticking boxes). Smyth et al. (2004) report that respondents use ‘preattentive processing’ when approaching internet surveys, i.e. They try to take in and understand the whole scene (or screen) before attending to specific items, hence visual features are important, e.g. emboldened words, large fonts, colours, brightness, section headings, spacing, placing boxes around items. This rests on Gestalt psychology that abides by the principles of: (a) proximity (we tend to group together those items that are physically close to each other); (b) similarity (we tend to group together those items that appear alike; (c) prägnanz (figures or items with simplicity, regularity and symmetry are more easily perceived and remembered).
Smyth et al. (2004: 21) also suggest that the use of headings and separation of sections take on added significance in internet-based surveys. They report that separating items into two sections with headings had a ‘dramatic effect’ on responses, as respondents felt compelled to answer both subgroups (70 per cent gave an answer in both subgroups whereas only 41 per cent did so when there were no headings or sectionalization). They also found that separating a vertical list of items into subgroups and columns (double- banking) was not a ‘desirable construction practice’ and should be avoided if possible. They report that asking respondents for some open- ended responses (e.g. writing their subject specialisms) can be more efficient than having them track down a long list of subjects to find the one that applies to them, though this can be mitigated by placing simple lists in alphabetical order. Finally they found that placing very short guides underneath the write- in box rather than at its side (e.g. dd/mm/yy for ‘day/month/year’, and using ‘yy’ for ‘year’ rather than ‘yyyy’) increased response rates, and that placing instructions very close to the answer box improved response rates.
Dillman et al. (2003) also found that having respondents use a yes/no format (a ‘forced choice’) for responding resulted in increased numbers of affirmative answers, even though this requires more cognitive processing than non-forced choice questions (e.g. ‘tick[check]-all- that-apply’ questions) (p. 23). This is because respondents may not wish to answer questions in the outright negative (p. 10); even if they do not really have an opinion or they are neutral or the item does not really apply to them, they may choose a ‘yes’ rather than a ‘no’ category. They may leave a blank rather than indicating a ‘no’. The percentage of affirmative responses was higher in a paper- based survey than in an internet-based survey (11.3 per cent and 6.5 per cent respectively) (p. 22).
Similarly, as mentioned earlier, Dillman et al. (2003) report that respondents tend to select items higher up a list than lower down a list of options (the primacy effect), opting for the ‘satisficing’ principle (they are satisfied with a minimum sufficient response, selecting the first reasonable response in a list and then moving on rather than working their way down the list to find the optimal response), suggesting that item order is a significant feature, making a difference of over 39 per cent to responses (p. 7). This is particularly so, the authors aver, when respondents are asked for opinions and beliefs rather than topics seeking factual information. They also suggest that the more difficult the item is, the more respondents will move towards ‘satisficing’. They found that ‘satisficing’ and the primacy effect were stronger in internet surveys than paper-based surveys (p. 22), and that changing ‘check-all-that-apply’ to forced responses (yes/no) did not eliminate response order effects.
Dillman et al. (2003) also report that the order of response items can have an effect on responses, citing, as an example (p. 6), a study that found that asking college students whether their male or female teachers were more empathetic was affected by whether the ‘male’ option was placed before or after the ‘female’ option: ‘respondents evaluated their female teachers more positively when they were asked to compare them to their male teachers than when they were asked to compare their male teachers to their female teachers’. Respondents compare the second item in light of the first item in a list rather than considering the items separately.
Internet-based surveys are subject to the same ethical rules as paper- based surveys. These include, for example, informed consent and confidentiality. Whilst the former may be straightforward to ensure, the issue of confidentiality on the internet is more troublesome for researchers. For example, on the one hand an email survey can be quick and uncomplicated, it can also reveal the identity and traceability of the respondent. As Witmer et al. (1999: 147) remark, this could stall a project. Security (e.g. through passwords and PIN numbers) is one possible solution, though this, too, can create problems in that respondents may feel that they are being identified and tracked, and, indeed, some surveys may deposit unwelcome ‘cookies’ onto the respondent’s computer, for future contact.
Sampling bias is a major concern for internet-based surveys (Coomber, 1997; Roztocki and Lahri, 2002; Schonlau et al., 2009). Hewson et al. (2003: 27) suggest that ‘internet-mediated research is immediately subject to serious problems concerning sampling representativeness and validity of data’, e.g. that the internet researcher tends to tap into middle-class and well-educated populations, mainly from the United States, or undergraduate and college students. Survey2000 (Witte et al., 1999) found that 92.5 per cent of respondents were white. However, this view of over- representation of some and under- representation of others is being increasingly challenged (Smith and Leigh, 1997; Witte et al., 1999; Hewson et al., 2003), with results showing that samples taken from users and non- users of the internet did not differ in terms of income, education, sexual orientation, marital status, ethnicity and religious belief. However, they did differ in terms of age, with the internet samples containing a wider age range than non- internet samples, and in terms of sex, with the internet samples containing more males. Hewson et al. (2003) report overall a greater diversity of sample characteristics in internet-based samples, though they caution that this is inconclusive, and that the sample characteristics of internet samples, like non- internet samples, depend on the sampling strategy used. Stewart and Yalonis (2001) suggest that one can overcome the possible bias in sampling through simple stratification techniques.
A major problem in sampling for internet surveys is estimating the size and nature of the population from which the sample is drawn: a key feature of sampling strategy. Researchers have no clear knowledge of the population characteristics or size, and indeed the same applies to the sample. The number of internet users is not a simple function of the number of computers or the number of servers (e.g. many users can employ a single computer or server), though at the time of writing, a figure of over 500 million users has been suggested (Hewson et al., 2003: 36). Further, it is diffi-cult to know how many or what kind of people saw a particular survey on a website (e.g. more males than females), i.e. the sampling frame is unclear. Moreover, certain sectors of the population may still be excluded from the internet, for example those not wishing to, or unable to (e.g. because of cost or availability), gain access to the internet. The situation is changing rapidly. In 1997 it was reported (Coomber, 1997) that internet users tended to be white, relatively affluent and relatively well- educated males from the first world; more recent studies (e.g. Hewson et al., 2003) suggest that the internet is attracting a much more diverse population that is closer to the general population.
There are further concerns about the sampling on internet-based surveys. Internet-based surveys are based largely on volunteer samples, obtained through general posting on the Web (e.g. an advertisement giving details and directing volunteers to a site for further information), or, more popular in the social sciences, through announcements to specific newsgroups and interest groups on the Web, e.g. contacting user groups (e.g. through the SchoolNet). Lists of different kinds of user (USENET) groups, newsgroups and electronic discussion groups (e.g. Listservs) can be found on the Web. Several search engines exist that seek and return web mailing lists, such as: www.liszt.com (categorized by subject); Catalist (the official catalogue of LISTSERV lists at www.lsoft.com/catalist.html); Mailbase (www.mailbase.ac.uk) which is a major collection of over 2,500 lists concerning the academic community in the UK; and Meta- List.net (www.meta-list.net) which searches a database of nearly a quarter of a million mailing lists. Dochartaigh (2002) provides useful material on web searching for educational and social researchers.
The issue here is that the researcher is using non-probability, volunteer sampling, and this may decrease the generalizability of the findings (though, of course, this may be no more a problem on internet-based surveys than on other surveys). Opportunity samples (e.g. of undergraduate or postgraduate students using the Web, or of particular groups) may restrict the generalizability of the research, but this may be no more than in conventional research, and may not be a problem so long as it is acknowledged. The issue of volunteer samples runs deeper, for volunteers may differ from non- volunteers in terms of personality (e.g. they may be more extravert or concerned for self-actualization (Bargh et al., 2002)) and may self- select themselves into, or out of, a survey, again restricting the generalizability of the results.
One method to try to overcome the problem of volunteer bias is to strive for extremely large samples, or to record the number of hits on a website, though these are crude indices. Another method of securing the participation of non- volunteers in an internet survey is to contact them by email (assuming that their email addresses are known), e.g. a class of students, a group of teachers. However, email addresses themselves do not give the researcher any indication of the sample characteristics (e.g. age, sex, nationality, etc.).
Watt (1997) suggests that there are three types of internet sample:
an unrestricted sample (anyone can complete the questionnaire, but it may have limited representativeness);
a screened sample (quotas are placed on the subsample categories and types (e.g. gender, income, job responsibility, etc.));
a recruited sample (where respondents complete a preliminary classification questionnaire and then, based on the data provided in them, are recruited or not).
Response rate for an internet survey is typically lower than for a paper- based survey, as is the rate of completion of the whole survey (Reips, 2002a). Witmer et al. (1999: 147) report that for a paper- based survey the response could be as high as 50 per cent and as low as 20 per cent; for an internet survey it could be as low as 10 per cent or even lower. Dillman et al. (1998b) report a study that found that 84 per cent of a sample completed a particular paper- based survey, whilst only 68 per cent of a sample completed the same survey online. Solomon (2001) reported that response rates to an internet-based survey are lower than for their equivalent mail surveys. However, this issue is compounded because in an internet-based survey, there is no real knowledge of the population or the sample, unless only specific people have been approached (e.g. through email). Witmer et al. (1999) found that short versions of an internet-based questionnaire did not produce a significantly higher response rate than the long version (p. 155). Solomon (2001) suggests that response rates can be improved through the use of personalized email, follow-up reminders, the use of simple formats and pre-notifcation of the intent to survey.
Reips (2002a) provides some useful guidelines for increasing response rates on an internet survey. He suggests that response rates can be increased by utilizing the multiple site entry technique, i.e. having several websites and postings on several discussion groups that link potential participants or web surfers to the website containing the questionnaire. He also suggests (p. 249) utilizing a ‘high hurdle technique’, where ‘motivationally adverse factors are announced or concentrated as close to the beginning’ as possible, so that any potential dropouts will self- select at the start rather than during the data collection. A ‘high hurdle’ technique, he suggests, comprises:
Seriousness: |
inform the participants that the research is serious and rigorous; |
Personalization: |
ask for an email address or contact details and personal information; |
Impression of control: |
inform participants that their identity is traceable; |
Patience: loading time: |
use image files to reduce loading time of web pages; |
Patience: long texts: |
place most of the text in the first page, and successively reduce the amount on each subsequent page; |
Duration: |
inform participants how long the survey will take; |
Privacy: |
inform the participants that some personal information will be sought; |
Preconditions: |
indicate the requirements for particular software; |
Technical pretests: |
conduct tests of compatibility of software; |
Rewards: |
indicate that any rewards/incentives are contingent on full completion of the survey. |
Of course, some of these strategies could backfire on the researcher (e.g. the disclosure of personal and traceable details), but the principle here is that it is better for the participant not to take part in the first place rather than then drop out during the process. Indeed Frick et al. (1999) found that early dropout was not increased by asking for personal information at the beginning. In relation to online experiments they found that ‘the tendency of leaving the experiment when personal information is requested is higher after the experiment has already been finished’ (p. 4), i.e. it is better to ask for personal information at the beginning.
Reips (2002a) also advocates the use of ‘warm- up’ techniques in internet- based research in conjunction with the ‘high hurdle’ technique (see also Frick et al., 1999). He suggests that most dropouts occur earlier rather than later in data collection, or, indeed, at the very beginning (non- participation) and that most such initial dropouts occur because participants are overloaded with information early on. Rather, he suggests, it is preferable to introduce some simple- to-complete items earlier on to build up an idea of how to respond to the later items and to try out practice materials. Frick et al. (1999) report that offering financial incentives may be useful in reducing dropouts, ensuring that respondents continue an online survey to completion (up to twice as likely to ensure completion), and that they may be useful if intrinsic motivation is insufficient to guarantee completion.
Gwartney (2007: 17) suggests that online surveys might be most appropriate with ‘closed populations’, i.e. employees in a particular organization, as this will enable the researcher to know some of the characteristics and parameters of the respondents.
Aldridge and Levine (2001: 51–4) and Fowler (2009: 80–3) offer useful summary guides to the advantages and disadvantages of several methods of data collection in surveys: personal face- to-face interviewing; telephone interviewing; self- administered/self- completion versus interviewer- administered; group administered; mailed surveys; delivered (distributed) surveys (e.g. personally delivered or delivered to an institution); internet surveys. We refer the reader to these useful sources. Additionally Fowler (2009) discusses the attractions of combining methods of data collection (e.g. face- to-face interviews with telephone interviews, internet surveys with postal surveys).
 Companion Website
The companion website to the book includes PowerPoint slides for this chapter, which list the structure of the chapter and then provide a summary of the key points in each of its sections. This resource can be found online at www.routledge.com/textbooks/cohen7e.