1 Introduction
There are three inquiries in hydrogeological research: (1) Where is the recharge area? (2) Where is the discharge area? (3) What is the pattern of the groundwater circulation in deep and shallow zones? Accordingly, the groundwater flow in vertical and horizontal directions could be classified “local” and “regional” groundwater framework (e.g., [1–3]). Local flow is restricted inside a single basin surrounded by topographic highs and vertically circulates in the shallow subsurface. Regional flow system is not mostly limited to a single basin and groundwater circulated to deeper zones. There are three techniques used to indicate the groundwater stream in a wide territory: measuring liquid potential, numerical modeling, and utilization of tracers. Six types of tracers were used for the groundwater investigation: colorimetry, photometry, mass spectrograph, electric conductivity, hydrochemistry, and temperature [4].

Illustrates the seawater intrusion in the continental fresh groundwater

Schematic diagram of the embayment or inner shelf scale of submarine groundwater flow and discharge showing submarine flow of low-salinity water in the first confined aquifer and the zone of offshore discharge beyond the edge of the submarine confining unit [11]

Schematic diagram of the continental shelf scale of submarine groundwater phenomena showing the variable position of the fresh-saline interface in multiple confined aquifers on the shelf, the variable widths of the mixed zone at the interface, the flow of saline water inward from the exposed edges of confined aquifers, and the upward movement of saline groundwater induced by geothermal heating at depth [11]
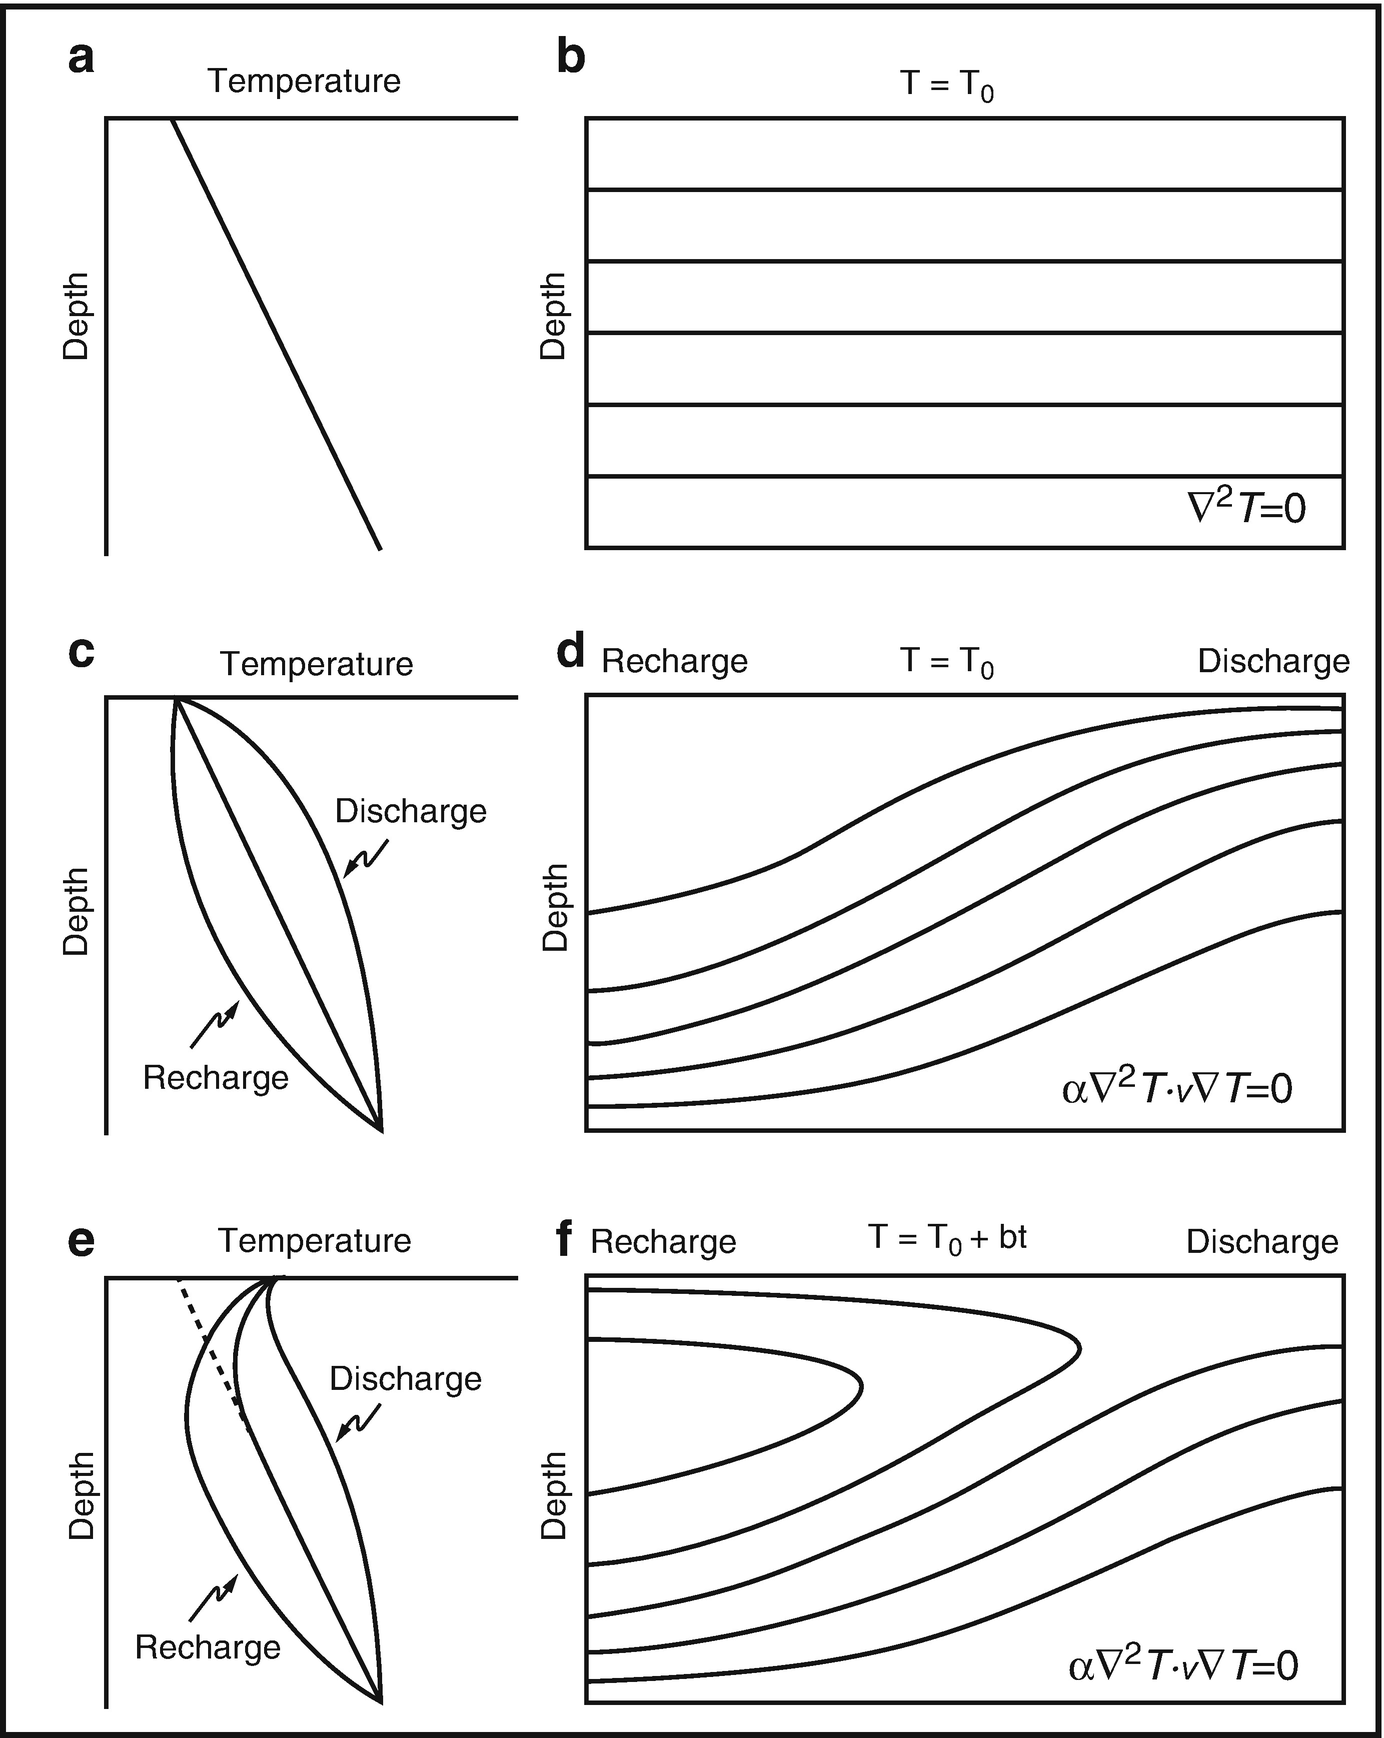
Schematic diagrams of the groundwater flow system and subsurface thermal regime under the condition of (a) and (b) no groundwater flow, (c) and (d) regional groundwater flow, and (e) and (f) regional groundwater flow with surface warming. Note: T, T o, and t are subsurface temperature, constant surface temperature, and time, respectively [21]
The chemical characteristics of the groundwater are mostly settled in the unsaturated zone. In contrast, less intense geochemical evolution occurs in the saturated zone, and changes take after dynamic changes in water quality toward regions of discharge. These procedures are time dependent and the chemical changes and, additionally, isotopic varieties might be utilized to give data on water stream pathways [22]. Utilizing multi-following strategy, Salem et al. [23, 24] prevailing to decide the connection between the groundwater and Shinano River in Nagaoka territory, Japan. In the present work, temperature and water chemistry were utilized for following the groundwater stream framework and seawater intrusion in the Nile Delta. Flow analysis is essentially in light of the idea of various leveled groundwater stream frameworks [2, 3].
2 Hydrogeology of the Nile Delta
In ancient times, the Nile River at Cairo formed a wide estuary that has been occupied by river deposits to frame the current fruitful delta of 250-km-wide base at the Mediterranean coast and around 160 km from Cairo (south) to sea coast (north). Seven branches of the Nile ran through the delta, but humans and nature have closed five of them [25]. The only two remaining channels are Rosetta, whose mouth is located just east of Alexandria, and Damietta, whose mouth is located at the northeast tip of the Delta. The other five mouths, which have been proven both historically and geologically to have existed [25].
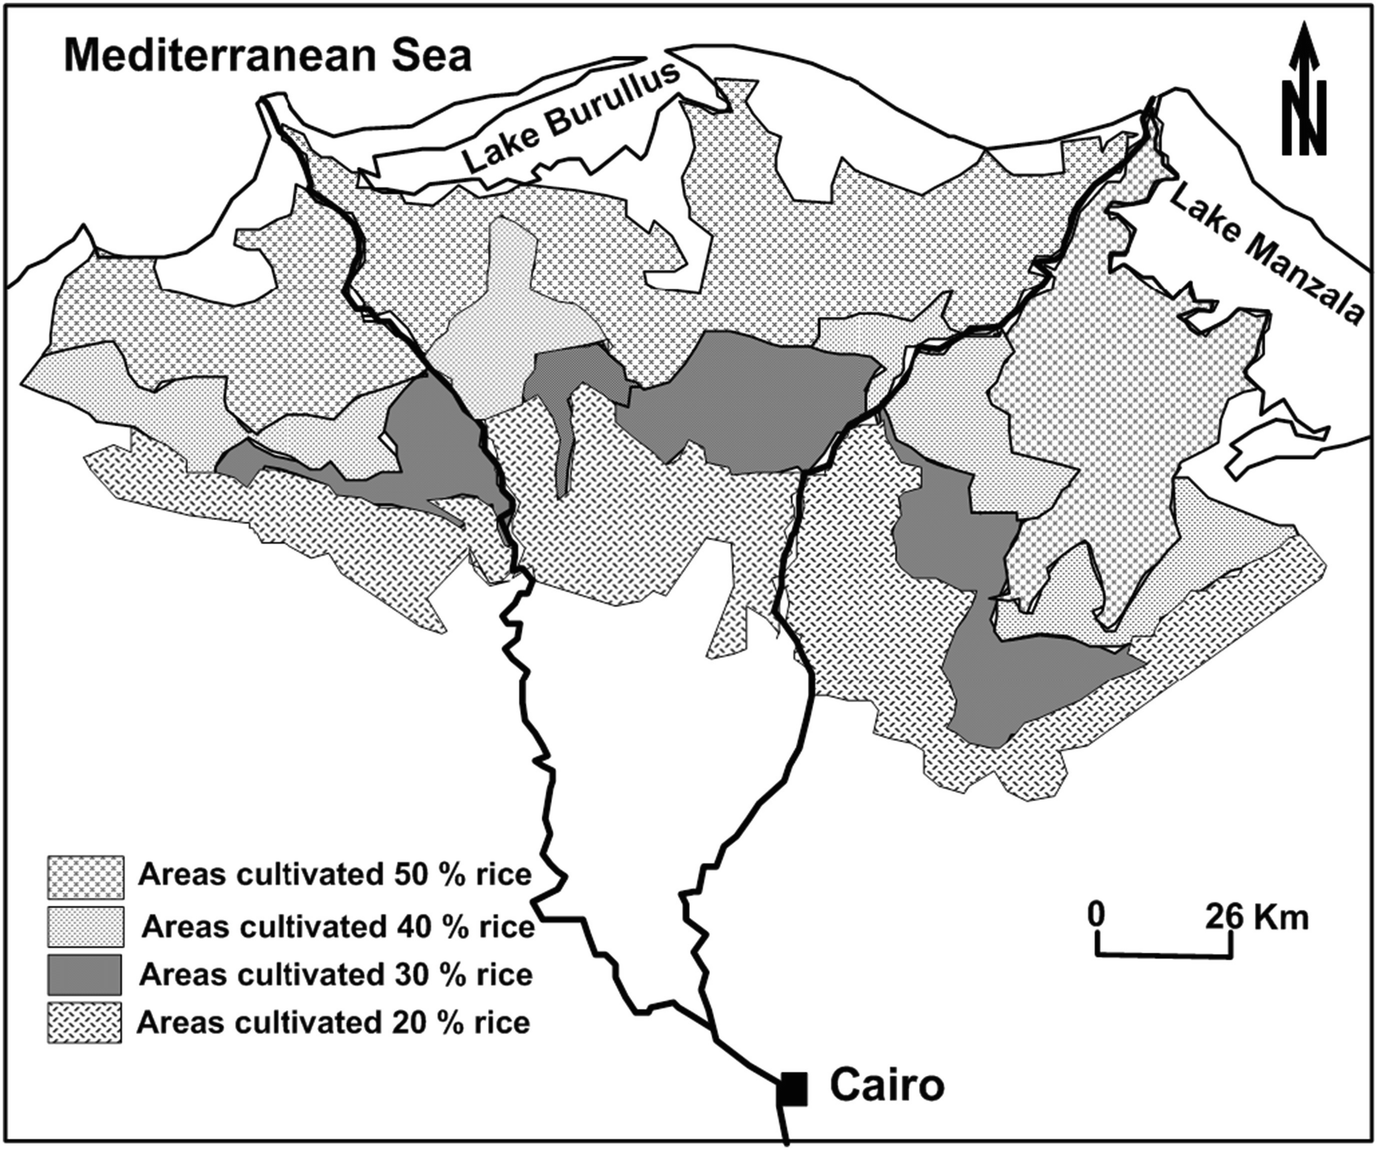
Areal distribution of the rice cultivated lands in the Nile Delta (Modified after [27])
“The Nile Delta is one of the oldest intensely cultivated areas on earth. It is very heavily populated, with population densities up to 1,600 inhabitants per square kilometer” [25]. Current increments in the populace, together with upgraded ways of life and additionally the restricted freshwater sources in the Nile Delta, have made a more prominent request on water resources, requiring enhanced groundwater administration. Any new groundwater improvement in the Nile Delta should consider the potential outcomes of seawater intrusion and guarantee satisfactory control, with the counteractive action of saline intrusion being seen as perfect. Up till now, various groundwater investigations chiefly centered on seawater intrusion on the upper 100 m of the groundwater framework and expected salinities not surpassing that of Mediterranean water. There was no information on groundwater in the deeper parts of the Quaternary Nile Delta aquifer (depth up to 1,000 m). Recent studies gathered salinity estimations and found an across-the-board event of “hypersaline” groundwater: groundwater with salinities to a great extent surpassing that of seawater at depth higher than 400 m [28, 29]. This hypersaline groundwater incredibly influences the groundwater flow system and the new water capability of the aquifer. Engelen et al. [30] investigated the causes of the hypersaline groundwater and its transport system. They considered all the applicable salinization forms in the Nile Delta aquifer, over a time space of up to 2.5 million years, which is the time traverse in which the aquifer got deposited.
Several research works dealing with the hydrogeology and hydrogeochemistry of the Nile Delta aquifer were done covering the period from 1959 to 2017, among them: Zaghloul [31], El-Fayoumy [32], Shata [33], Anon [34], El-Dairy [35], El-Hefny et al. [36], Sallouma [37], Hamza et al. [38], Kotb [39], Mousa [40], Mousa [41], El-Shamy and Greish [42], Ezz and Deen [43], Sollouma and Gomaa [44], Salem et al. [29], Salem [45], Atwia [46], Shabaan [47], Frihy and Lawrence [48], El Banna [49, 50], El Banna and Frihy [51], El Banna and Frihy [52], El-Asmar and Hereher [53], Elewa et al. [54], Mabrouk et al. [55] and Shehata and El-Sabrouty [56], Salem et al. [57], Salem and El Bayumy [58, 59], Salem et al. [60], Salem and Osman [61–63], and Salem et al. [64–66].
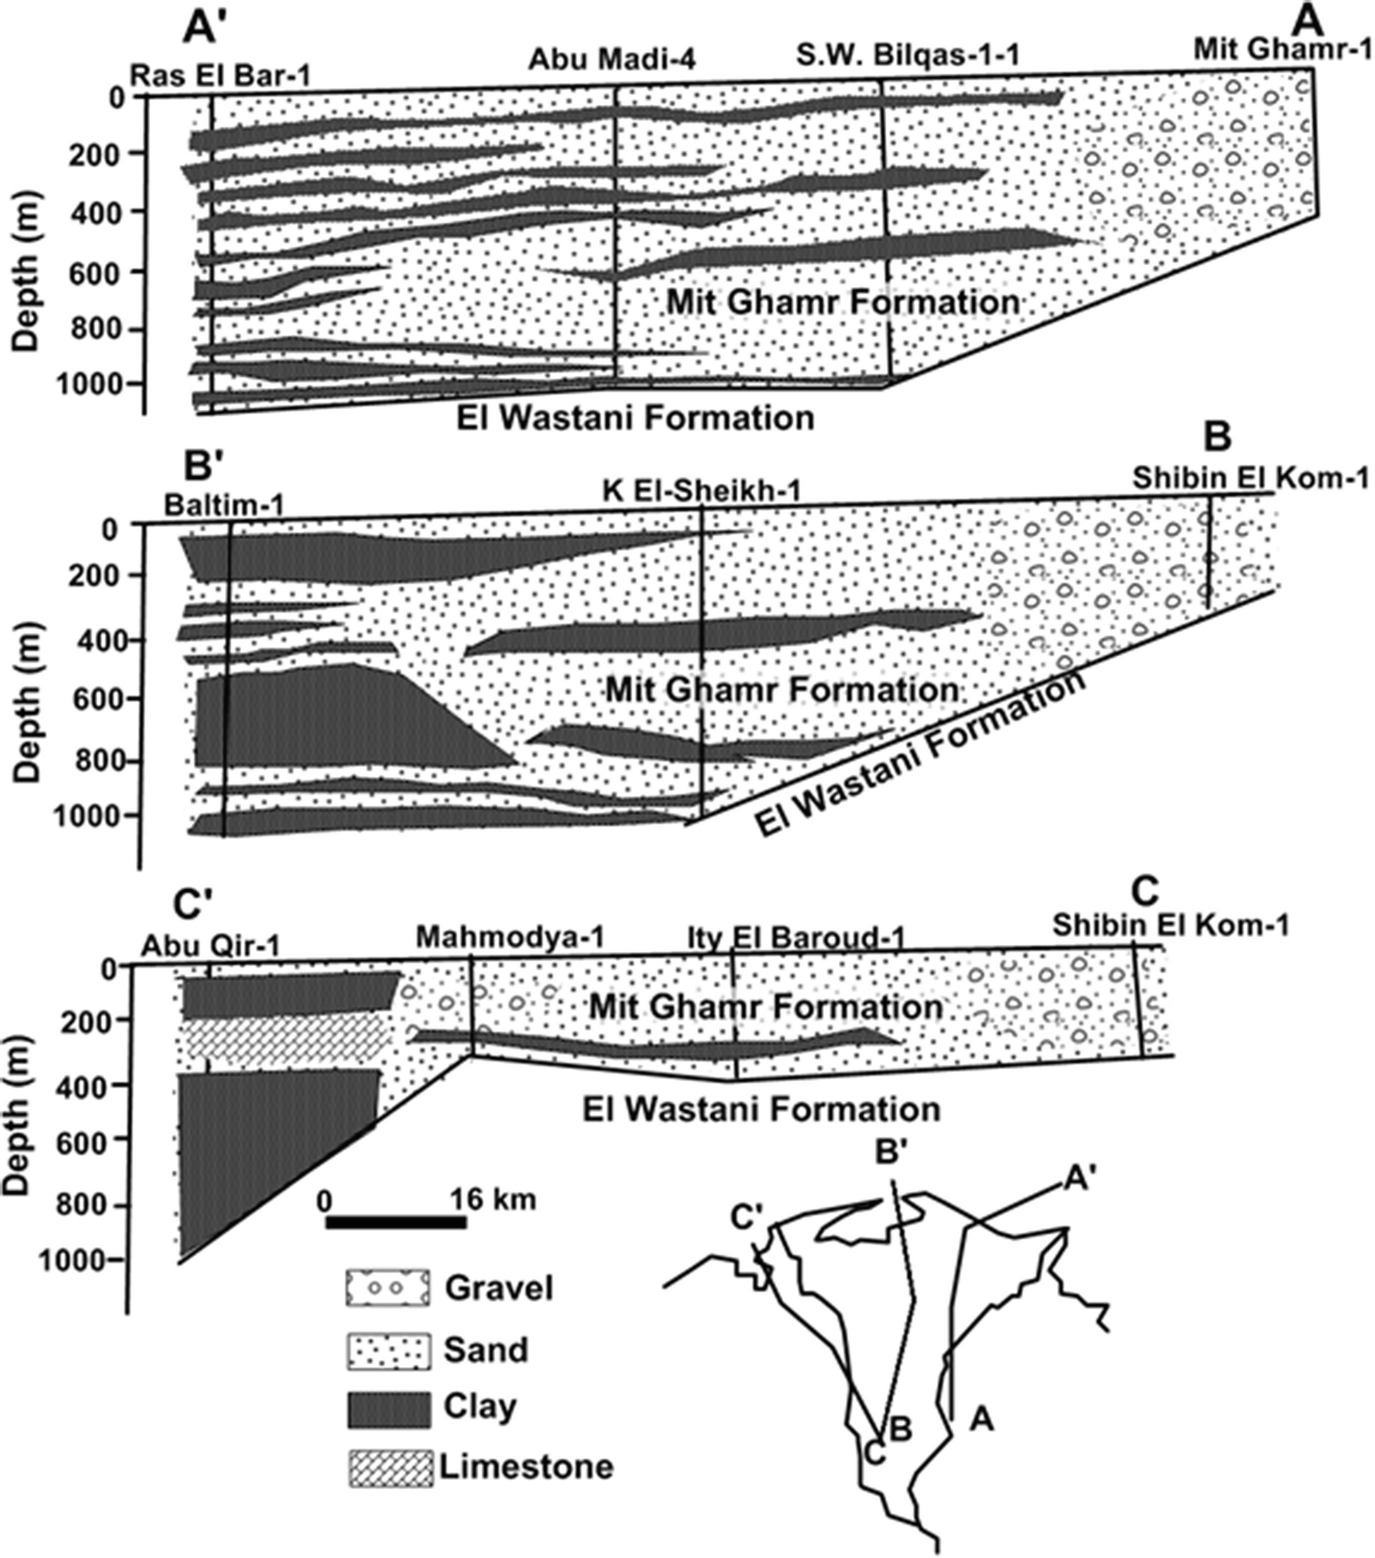
The Nile Delta aquifer system is considered to be a leaky aquifer in the southern and middle parts and a free aquifer in the western and eastern borders, where the thickness of the top Holocene deposits reaches its minimum value. In the northern parts, the top Holocene deposits strongly retard upward discharge from the Plio-Pleistocene aquifer; therefore, the aquifer becomes of a confined type. The existing aquifer, in the study area, belongs to the main Nile Delta aquifer system. It is mainly formed of the Pleistocene graded sand and gravel, changing to fine sand intercalated with clay lenses. This aquifer is a semi-confined one. The thickness of the semi-confining layer is generally between 0 and 20 m and increases reaching a thickness of 70 m at the northern part of the Nile Delta. There are not too many studies with estimations of the hydraulic parameters for the overlying clay layer in literature. Farid [67] reported that its vertical hydraulic conductivity is at 0.0025 m/day, while Leaven [68] reported it at 0.0484 m/day. With slightly lower values, Wolf [69] reported it as 0.0011 m/day, and Arlt [70] at 0.0046 m/day. On the other hand, Sherif et al. [71] reported the vertical hydraulic conductivity to be about 0.67 m/day. Recently, Salem et al. [64] studied the petrophysical and the hydrogeological properties of this clay layer (Bilqas Formation) in the central part of the middle Nile Delta. They stated that “Bilqas Formation ranges in thickness from 3 m in the southwest direction to 31 m in the northeast direction. The shale content and porosity ranges are 54% to 97% and 21% to 55%, respectively. This layer has low values of permeability (16 × 10−9 to 78 × 10−9 mD) and hydraulic conductivity (<2 × 10⁻⁹ cm/s). The water salinity of this layer ranges from 200 to 1,600 mg/l.”
The depth to the groundwater table in this aquifer ranges between 1–2 m in the north, 3–4 m in the middle, and 5 m in the south. Different estimated depths to groundwater table that have been reported by RIGW [76] and Morsy [77]. Direction of groundwater movement is northward to the sea. The irrigation and drainage networks are the main sources of groundwater recharge. The Rosetta branch, the Mediterranean Sea, coastal lakes, and pumped water used for irrigation, industrial, and domestic purposes are the main discharge forms.
3 Methodology
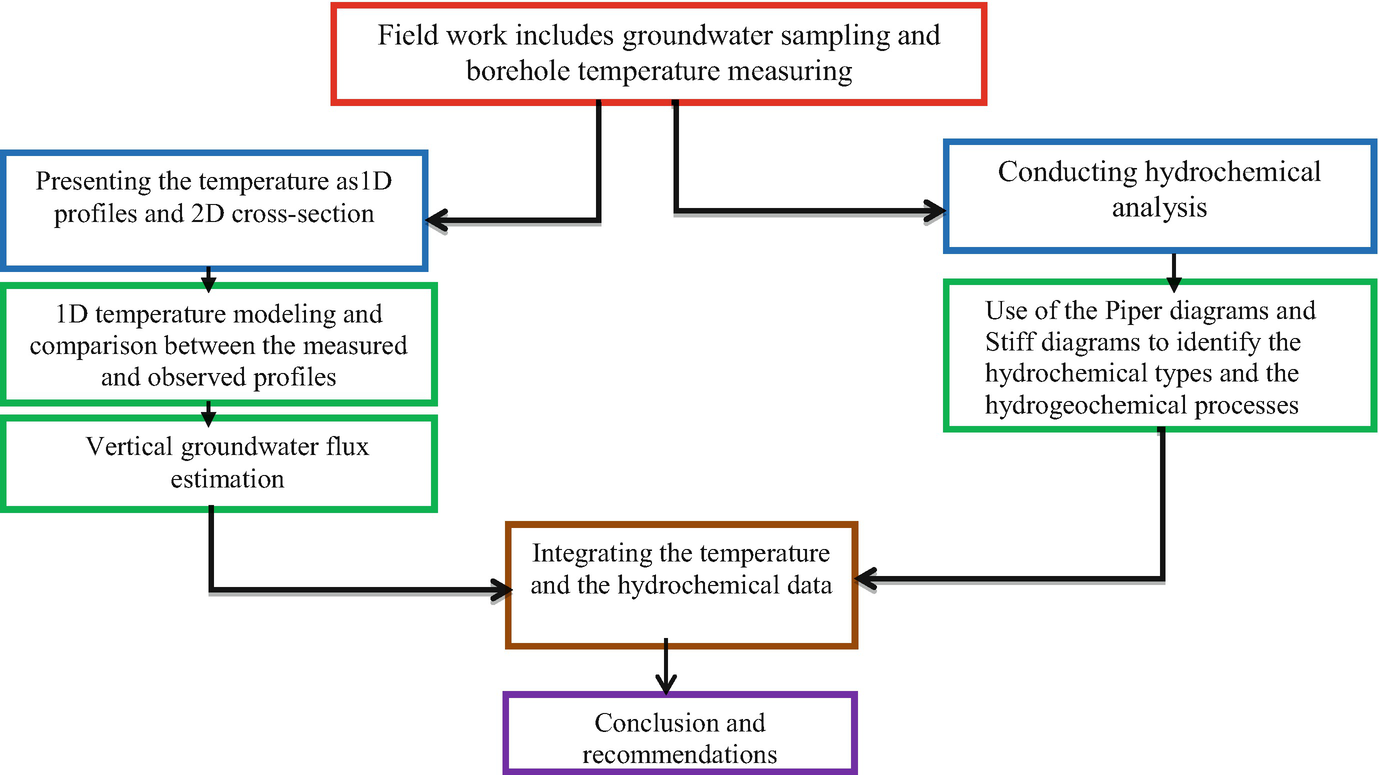
Flowchart illustrates the methodology of the current study
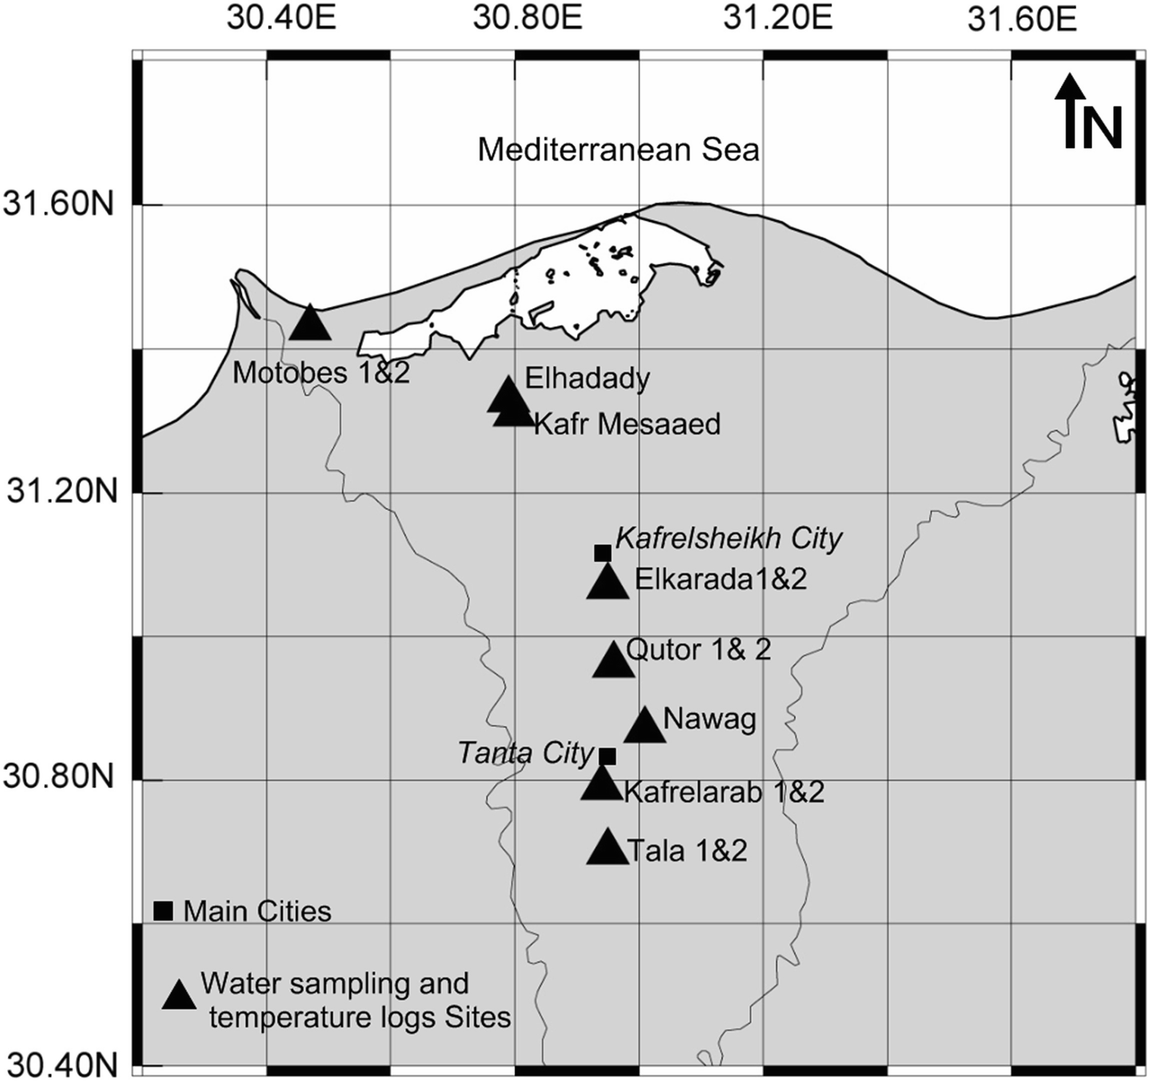
Wells location map [29]
Chemical composition of the collected water samples [29]
Physicochemical parameters | Tala (1) | Tala (2) | Kafrelarab(1) | Kafrelarab(2) | Nawag | Qutor (1) | Qutor (2) | Elkarada(1) | Elkarada(2) | Kafr Mesaaed | Elhadady | Motobes (1) | Motobes (2) | Seawater | |
|---|---|---|---|---|---|---|---|---|---|---|---|---|---|---|---|
Total depth | m | 100 | 320 | 100 | 280 | 45 | 45 | 100 | 45 | 75 | 85 | 90 | 140 | 430 | |
Water table | m | 3.9 | 3.9 | 3.5 | 3.5 | 3.0 | ND | ND | 1.6 | 0.2 | −0.7 | −0.5 | 0.0 | −14.5 | |
pH | – | 7.85 | 7.9 | 9.51 | 9.32 | 8.16 | 8.65 | 7.1 | 10.71 | 8.03 | 7.47 | 7.08 | 5.87 | 6.69 | 7.5 |
TDS | mg/l | 514 | 916 | 198 | 280 | 291 | 531 | 741 | 1,604 | 1,751 | 6,220 | 8,288 | 19,840 | 80,192 | 38,157 |
EC | mmhos/cm | 0.802 | 1.429 | 0.31 | 0.447 | 0.454 | 0.845 | 1.48 | 2.51 | 2.74 | 9.72 | 12.95 | 31.00 | 125.3 | 59.523 |
CO3 | mg/l | 0.0 | 0.0 | 17.1 | 29.6 | 0.0 | ND | ND | 57.6 | 0.0 | 0.0 | 0.0 | 0.0 | 0.0 | ND |
HCO3 | mg/l | 365.9 | 551.8 | 53.2 | 40.7 | 44.8 | 122 | 188 | 234.0 | 200.0 | 23.2 | 29.0 | 11.6 | 174 | 157.0 |
Total alkalinity | mg/l | 365.9 | 551.8 | 70.4 | 70.2 | 44.8 | ND | ND | 291.6 | 200.0 | 23.2 | 29.0 | 11.6 | 174 | 157 |
Ca | mg/l | 71.4 | 92.3 | 14.86 | 17.1 | 18.6 | 60.4 | 54.4 | 31.85 | 40.5 | 293 | 472 | 539 | 2,150 | 513 |
Mg | mg/l | 33 | 55.9 | 11.32 | 14.87 | 13.21 | 29 | 71.3 | 26.7 | 23.4 | 153 | 220 | 672 | 2,260 | 1,417 |
Na | mg/l | 38.6 | 66 | 30.4 | 47.6 | 46.9 | 60 | 96 | 500 | 523 | 1,650 | 1,870 | 4,650 | 22,700 | 11,850 |
K | mg/l | 11.6 | 19.4 | 7.42 | 8.4 | 7.5 | 5 | 5.75 | 39.7 | 16.4 | 26.9 | 37.2 | 151 | 737 | 220 |
Cl | mg/l | 45.2 | 78.5 | 33.5 | 52.4 | 64.1 | 160 | 292 | 630 | 780 | 3,290 | 3,820 | 6,844 | 43,500 | 20,800 |
NO3 | mg/l | <0.2 | <0.2 | <0.2 | <0.2 | 0.91 | 9.4 | ND | 46.90 | 18.70 | 105.0 | 111 | 66 | 4,283 | 6.6 |
SO4 | mg/l | 57.20 | 92.40 | 44.10 | 57 | 73.50 | 67.00 | 42 | 68.20 | 55.40 | 100.2 | 520 | 5,237 | 908.4 | 3,260 |
4 Result and Discussion
The two most illustrative parameters were utilized to be specific, temperature and hydrochemistry. The first of these tools gives data about vertical, rising, and downward flows. The second gives data about the arrangement of the water influenced, which thus gives data about the “palaeoprocesses,” the existence of salts in the medium, and the water origin.
4.1 Subsurface Thermal Regime
4.1.1 One-Dimensional Temperature Profiles
The vertical well logs demonstrate the thermal properties of the aquifers and enable separation of segments with generally contrasting advancements, as far as the presences or non-presence of warm water or streams of an alternate origin [78]. Temperature logs of groundwater additionally enabled the evaluation of the aquifer to be separated point by point, as for the presence of hot or cold water streams.
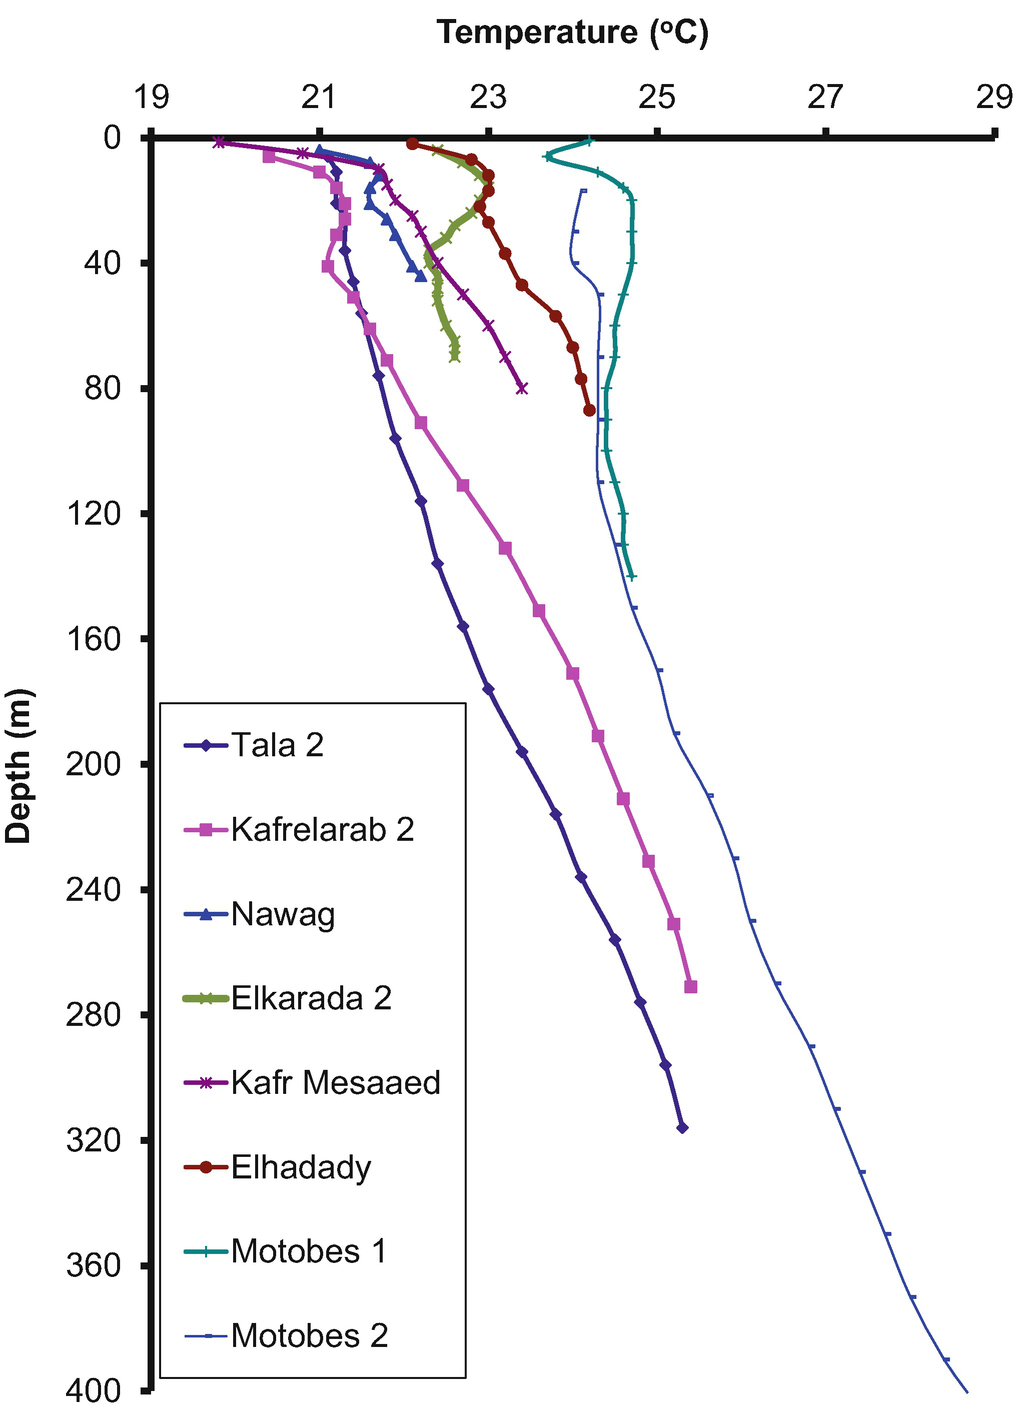
The measured temperature-depth profiles [29]
The second group of wells characterizes the northern part of Kafr Elsheikh City where Kafr Mesaaed, Elhadady, and Motobes wells (shallow and deep) are located. It has no significant profile type, but it seems different compared to the first group. Elhadady well and the shallow Rasheed well have warm water in their topmost parts. It also means that a discharge of the groundwater took place in the subsurface into the sea northward. For the same depth in the four wells, Kafr Mesaaed well has the lowest temperatures compared to the other three wells. This means that north Kafr Elsheikh City could be another recharge area different from the main recharge area of the Nile Delta aquifer. The later phenomenon happened due to excessive irrigation of highly cultivated rice fields in the northern part of the Nile Delta (Fig. 5). Motobes wells (shallow and deep) show different behavior in the shallow zone (Fig. 9). As the two wells lie close to the shoreline, this temperature difference could be related to the presence of two active groundwater flow systems one deeper and the other shallow.
The measured temperature profiles show three important observations as criteria for seawater intrusion in the Nile Delta. These observations are (1) although the horizontal distance between Nawag and Elkarada is about 30 km, their profiles met each other at a depth of 45 m below the surface; (2) in the same way, the distance between Kafrelarab well and Motobes wells is about 85 km, but the temperature difference at deep zones is less than 1°C; and (3) the profiles of Motobes and Elhadady wells are expected to meet each other at about 90 m below surface. These obtained three observations reflect an inland encroachment of seawater which is probably reached Nawag area in the deeper zones (northern Tanta City).
4.1.2 Temperature Cross Section
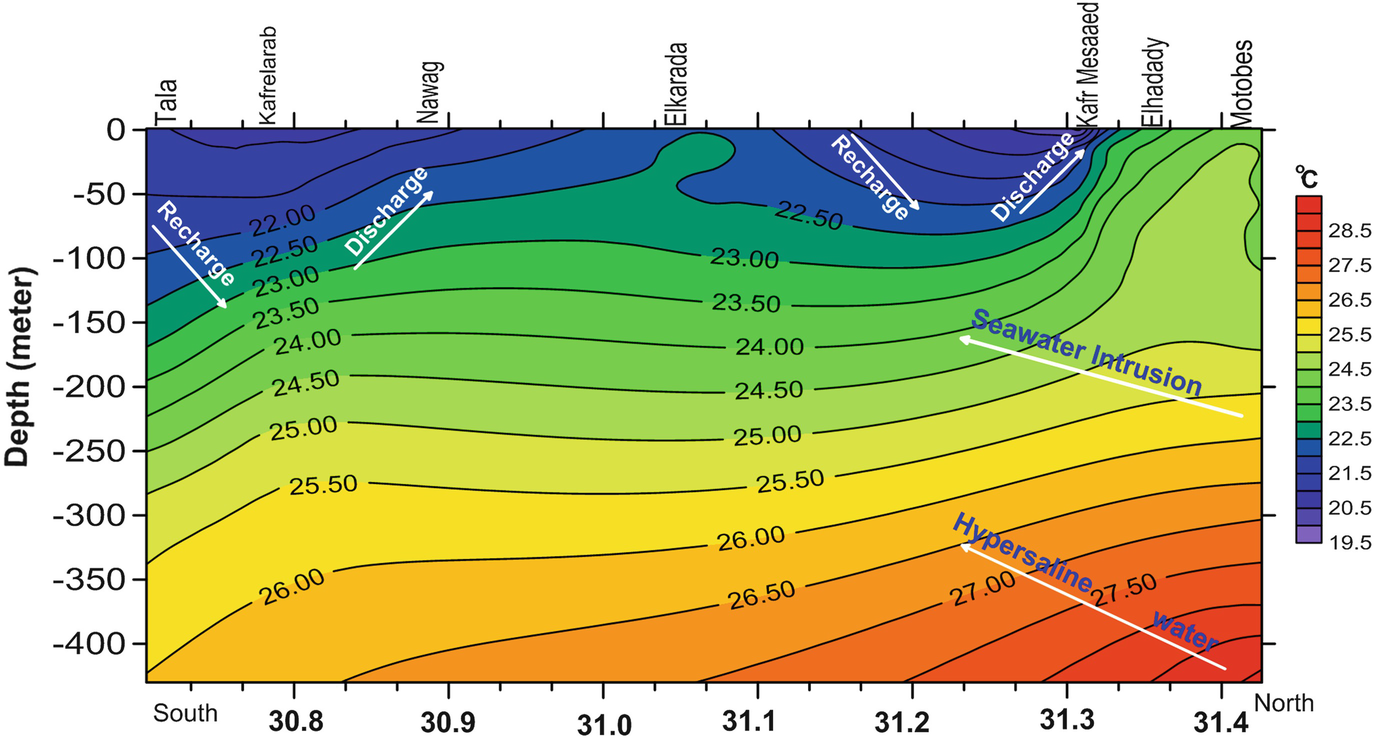
South-north cross section shows the subsurface thermal regime of the study area. Groundwater flow system is also indicated by the white arrows [29]
4.1.3 Model Calculations
![$$ {\displaystyle \begin{array}{ll}T\left(z,t\right)=& {T}_{\mathrm{o}}+{T}_{\mathrm{G}}\left(z- Ut\right)+\left\{\left(b+{T}_{\mathrm{G}}U\right)/2U\right\}\\ {}& \times \left[\left(z+ Ut\right){e}^{Uz/\alpha } \operatorname {erfc}\left\{\left(z+ Ut\right)/2{\left(\alpha t\right)}^{1/2}\right\}+\left( Ut-z\right) \operatorname {erfc}\left\{\left(z- Ut\right)/2{\left(\alpha t\right)}^{1/2}\right\}\right]\end{array}} $$](../images/437178_1_En_253_Chapter/437178_1_En_253_Chapter_TeX_Equ1.png)
where b is the rate of the surface temperature increment; t is the time after semi-equilibrium condition [21]; T o is the surface temperature; T G is the general geothermal gradient; U = υc o ρ o/cρ in which υ is the vertical groundwater flux, c o ρ o is the heat capacity of the water, and cρ is the heat capacity of the aquifer; α is the heat diffusivity of the aquifer; and erfc is the correlative error function. The modeling is restricted for semi-infinite layers with just vertical conduction and convection, and vertical groundwater flux is thought to be consistent with depth.

Binary diagram shows the comparison between the modeled and the measured temperature profile. Groundwater flux (U) values are either positive or negative indicating the downward or the upward movement, respectively
Recharge-type (downward groundwater flux) profile is only detected in Tala well (Fig. 11a) with U value equals 0.8 m/year. The other wells showed a discharge type (upward groundwater flux) with varying rates: −0.1 to −0.5, −0.35, −0.23, −0.6, −1.2, and −2.8 m/year for Kafelarab, Nawag, Elkarada, Kafr Mesaaed, Elhadady, and Motobes wells, respectively, as shown in Fig. 11a–c. These estimates indicate that fresh groundwater starts to move vertical upward southern Tanta City. The most dangerous recorded phenomenon is that seawater intrusion upward flux recorded in Motobes wells is higher than the downward recharge flux calculated in Tala well. Two observations were detected from this model. These observations include (1) the geothermal gradient decreases in the areas influenced by seawater intrusion like Motobes wells, and (2) recognized temperature profiles curvature in the shallow zones in most of the wells cannot be modeled by the current model because the groundwater flow is complicated in the shallow zones to be solved by this simple model.
4.2 Hydrogeochemistry

This reaction could happen in Kafrelarab and Nawag which contain the very low Ca2+ and HCO3 − concentrations in contrast to Tala and Qutor. Presences of nitrates in groundwater usually indicate an infiltration of water as a result of agricultural and human activities. Groundwater from the area south Nawag has very low nitrate concentrations which means that clay layer of Bilqas Formation and the irrigation system do not lead to an excess of nitrate to reach groundwater. The wells located northern Kafr Elsheikh City have high nitrate concentration marking a great contribution from the irrigation system where those areas are highly cultivated with rice as shown in Fig. 5.
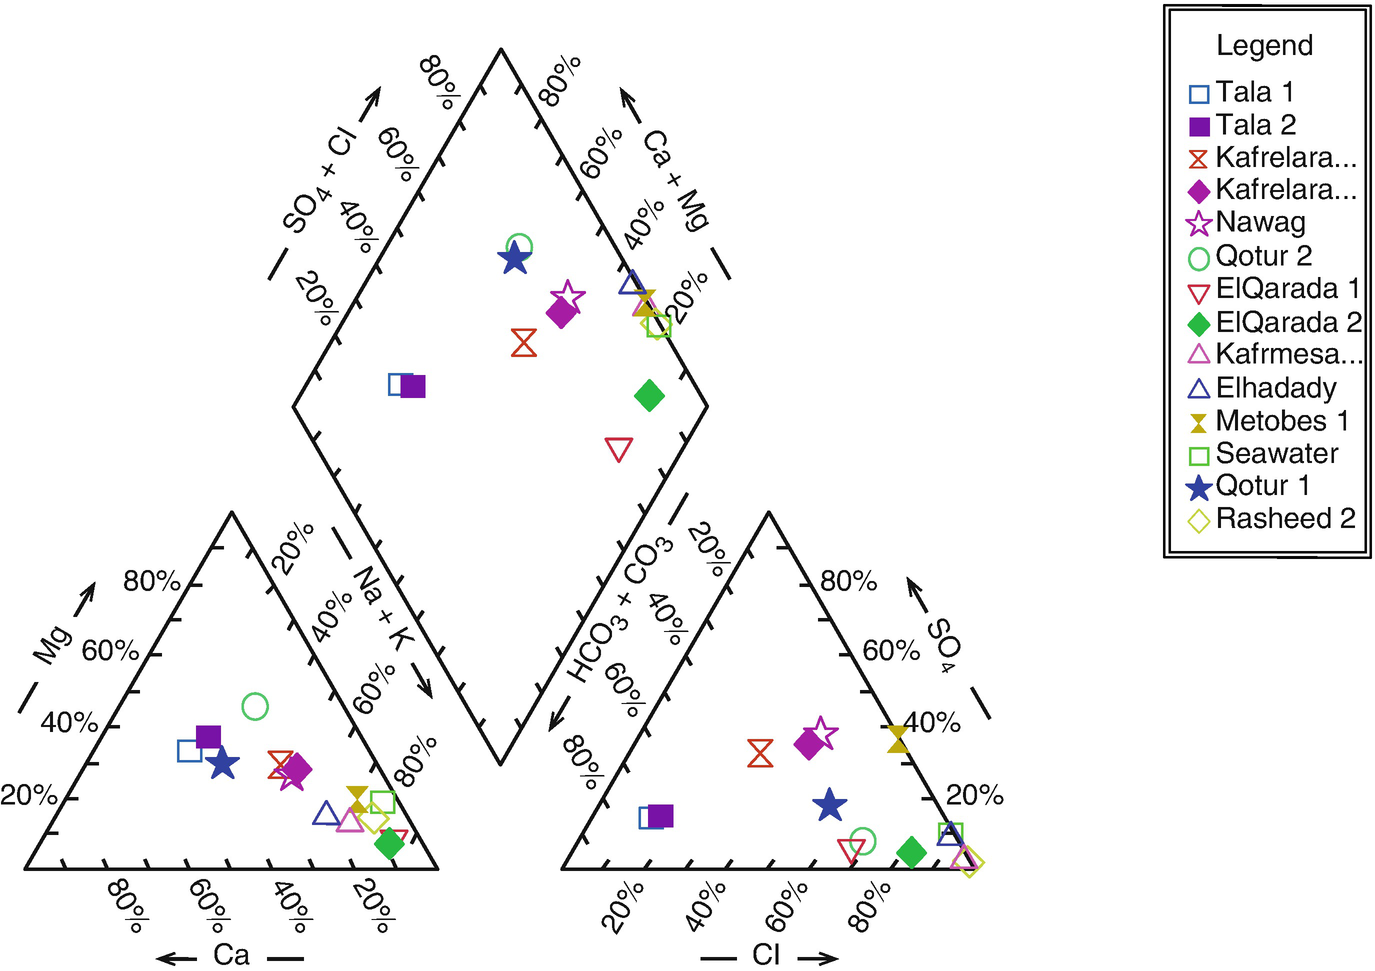
Piper diagram illustrates the hydrochemical processes [29]

where X indicates the soil exchanger. Sodium is taken by the exchanger and Ca2+ released. The water type then changes from NaCl into a CaCl2 water type. The reverse process takes place with freshening, i.e., when freshwater flushes a salt water aquifer. Where Ca2+ is taken up from water in return for Na+ with a NaHCO3 water type as a result. Water chemistry can thus indicate upcoming of seawater or, conversely, that saltwater is flushed by freshwater. These two processes could happen completely or partially.
- 1.
Kafrelarab and Nawag waters are freshwater of NaCl type; this may happen as a result of calcite precipitation during upward movement of calcium carbonate type in Tala due to an increase of pH.
- 2.
Compared to the Motobes 1 which shows a typical seawater type, Kafr Mesaaed, Elhadady, and Motobes 2 glasses of water have a relative increase in Ca2+ and lower concentration of Na+ than Cl− indicating seawater intrusion as mentioned by Appelo and Postma [82]. In the other hand, Elkarada samples show a relative increase in HCO3 −, and Na+ is slightly greater than Cl−. This could be related to freshwater infiltration from cultivated land.
- 3.
In the same way, composition of Qutor groundwater (MgCl2 type in deeper zones and CaCl2 in shallow zones) could be explained as an indicator for seawater intrusion, and it might be located in the intermediate zone between the regional fresh groundwater and the intruded seawater in the Quaternary aquifer of the Nile Delta.
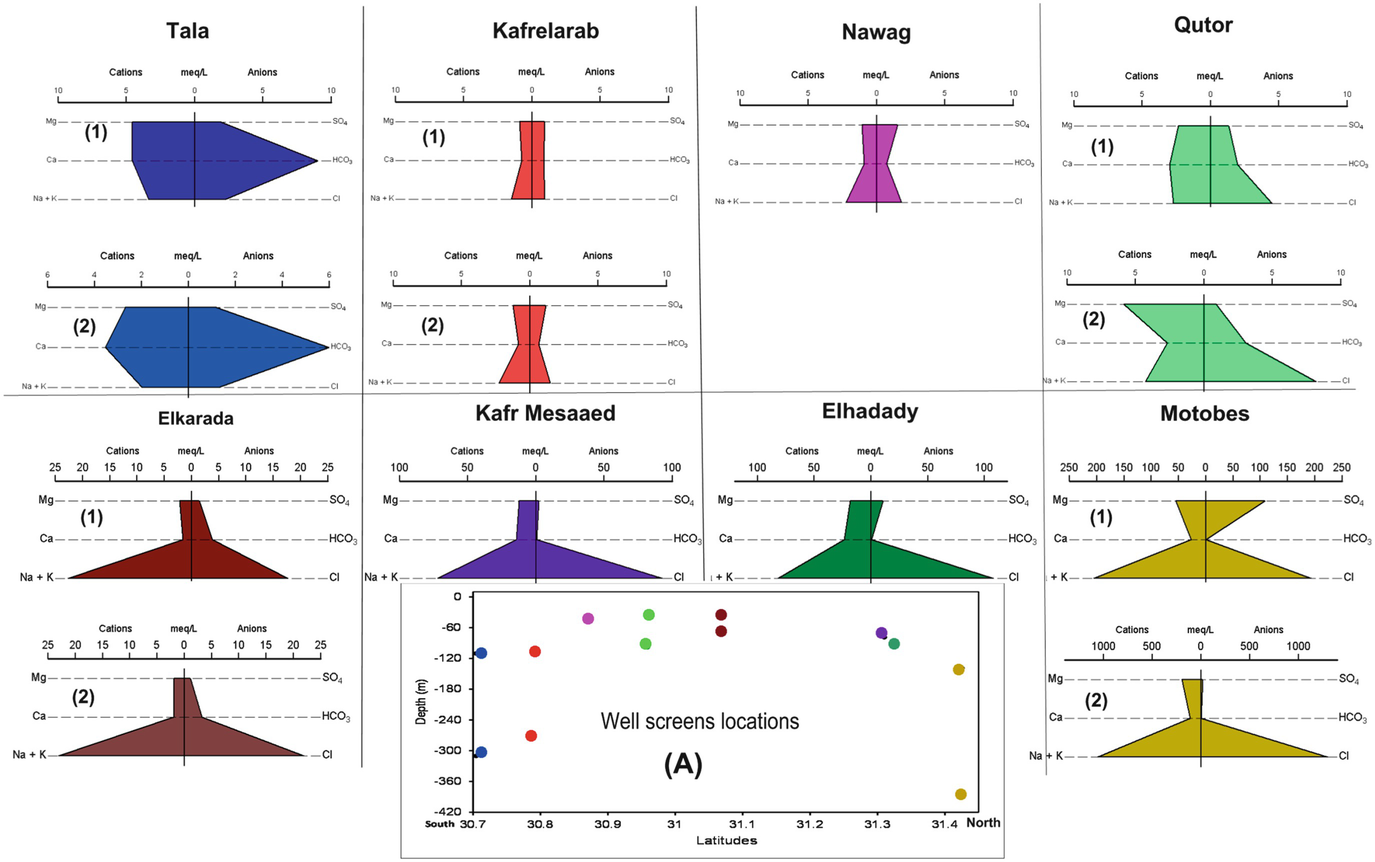
Stiff diagram shows the difference in the chemical types of the collected samples. (1) and (2) indicate the shallow and the deep groundwater at each site. (a) is south–north cross section and illustrates the average depth of the screens where the groundwater was sampled; color of the screen dots is the same of the related stiff diagrams
5 Conclusions
The integrated tracer technique between subsurface temperature and water chemistry was a good technique for tracing the groundwater flow system and seawater in the Nile Delta Quaternary aquifer. Two flow systems were detected: one is regional, and the other is local, and both of them are affected by seawater intrusion. The regional one is recharged south Tala and discharges northward in the area from Kafrelarab (south Tanta City) till ElKarada (south Kafr Elsheik City. The shape of the temperature profiles reflects a recharge type in Tala and discharge type in Kafrelarab, and the shape of the isothermal lines indicates a deep warm water flows upward to the shallow zones. Water chemistry is supporting this idea where the recharge area is characterized by CaHCO3 water type in Tala. Such water type is indicating an inland recharged freshwater. The discharge area of the system is characterized by NaCl type which is the most common water type due to calcite precipitation during upward flowing due to the change in pH. Recharge-type profile detected in Tala well has a groundwater flux (U) value equals 0.8 m/year. The other wells in this regional groundwater flow system showed a discharge type (upward groundwater flux) with varied U values: −0.1 to −0.5, −0.35, and −0.23 in Kafelarab, Nawag, and Elkarada wells, respectively. These estimates indicate that fresh groundwater starts to move vertically upward southern Tanta City.
Very low concentrations of nitrates in the groundwater of Tala and Kafrelarab and Nawag wells provide another evidence for being the water in the area south Nawag is contributed by deep circulating water. The shallow zones between Kafrelarab and Elkarada show a warming behavior as indicated from the temperature profiles. As those wells are not located in the urban areas, therefore, this thermal regime could be related to an upward and northward groundwater discharge.
The local flow system is identified from the cooling of the isothermal lines that are recognized in the area from north Kafr Elsheik till Motobes. This system is isolated from the regional one. The maximum depth of this local system is about 140 m in Kafr Mesaaed and 90 m in Elhadady. The recorded excess in nitrate concentrations indicates the agricultural and human surface activities. The temperature profiles measured in the area of this local system are of discharge value with upward flux (U) equals −0.6, −1.2, and −2.8 m/year for Kafr Mesaaed, Elhadady, and Motobes wells, respectively.
- 1.
The low-temperature difference between deep wells of Kafrelarab and Motobes wells in the deeper zones despite the long distance between them indicates nearly static seawater in the mentioned area.
- 2.
The intersections between the temperature profiles. For example, Nawag and Elkarada profiles intersect at 45 m deep; Kafr Mesaaed and Elhadady profiles met Motobes profiles at 140 m and 90 m deep, respectively.
- 3.
The nearly horizontal isothermal lines under most of the studied area in the deeper zones (till Nawag).
- 4.
The low thermal gradient noticed in Motobes wells which located close to the Mediterranean Sea compared to other wells.
The abovementioned thermal criteria indicate the existence of a nearly static water body deeper in south Kafr Elsheikh City and shallower northern Kafr Elsheikh City which might be seawater intrusion.
- 1.
Groundwater in Qutor wells has both CaCl2 and MgCl2 water types, in the shallow and deeper zones, respectively. This indicates the existence of an intermediate zone between seawater and freshwater under Qutor area. This estimation is limited to 100 m depth which is the maximum depth of Qutor wells.
- 2.
Seawater intrusion was also indicated from the partial ion exchange observed as a relative increase in Ca2+ and fewer Na+ than Cl− as in Kafr Mesaaed and Elhadady wells.
- 3.
In contrast to the regional groundwater flow system of the southern part and the local flow system in the northern part, Elkarada samples show a relative increase of HCO3 − and higher Na+ compared to Cl−. Such feature indicates partial ion exchange during freshwater propagation into the seawater. In another meaning, the groundwater under Elkarada is originally seawater mixed with a little of infiltrated freshwater.
Finally, the most dangerous information given from this research is that the groundwater in the Nile Delta is not affected only by seawater intrusion but also affected by hypersaline brine water inland propagation. The seawater affects the upper 200–250 m, but the hypersaline water was indicated in Motobes well which is of 420 m depth. The upward seawater intrusion flux rates in Motobes wells was 2.8 m/year which is much higher than the groundwater recharge flux at Tala well which was 0.8 m/day.
6 Recommendations
Governmental regulation of the pumping process from the Quaternary Nile Delta aquifer is urgently needed as the groundwater is not just facing the pollution from surface human activities and seawater intrusion but also suffers from the deeper hypersaline brine groundwater inland propagation. Integration between subsurface thermal and hydrogeochemical data is a good tool in recognition of the groundwater flow system and seawater intrusion.
Acknowledgment
This chapter is an update and revised version of the first draft which was presented at the 5th International Symposium on Geophysics, 2008, Tanta, Egypt. Also, the authors thank the editor Prof. Dr. Abdelazim Negm and the reviewers for their constructive remarks and comments.