Chapter 2 What Makes People Happy?
Everyone is entitled to his own opinion, but not to his own facts.
–– Senator Daniel Patrick Moynihan1
In the early 1980s Margaret Thatcher decided that wealth-creation should be the overarching aim of her government. At the same time a young assistant professor at the University of Illinois was moving in the opposite direction. He told his psychologist colleagues that he was going to study happiness. They said ‘What nonsense’, so the ingenious professor, named Ed Diener, said OK then, I’ll work on ‘subjective wellbeing’.
In the decades that followed, Diener and his psychological research group did literally hundreds of studies of the causes of happiness. They mainly studied the happiness of students, but also of people as different as the Maasai and the Inuit.2 In due course, economists also became involved in happiness research, and they typically looked at larger populations. Richard Easterlin of the University of California, and then Andrew Oswald of the University of Warwick, spotted that questions about happiness had been asked in many general-purpose surveys of the whole population, with good sample sizes. These included the periodic World Values Surveys, as well as surveys which followed the same people year after year in Britain, Germany and Australia. Countless researchers have used these surveys to estimate how different factors affect a person’s happiness.
But often these studies have focused on one cause at a time, making it difficult to compare the importance of different experiences in terms of their effect on happiness. So our research group at the London School of Economics has recently used all the main surveys to estimate these relationships in a way that makes it possible to compare the importance of each factor. This chapter is mainly based on our findings.3
Can happiness be measured?
But can we really compare the happiness of different people? Three things demonstrate that we can – at least to an approximation.
First, there is quite a good correlation between what people say and objective measurements taken from the brain. Richard Davidson has shown this not only in the same person (when their feelings are altered during an experiment) but also across individuals at rest. The neuroscience is still in its early days, but correlations such as these reinforce the view that people’s self-reports have objective informational content.4
Second, what people say about their happiness turns out to have huge predictive power. It helps predict their productivity, and their chances of quitting their job or their marriage, and their length of life. A sample of people over fifty were given a medical examination, and they were also asked a set of questions about happiness. They were then followed for eight years to see how many of them died. It turned out that the least happy third of people were 200 per cent more likely to die than the happiest third (see Figure 2.1).5 Even when other influences were controlled for, the least happy people were still 50 per cent more likely to die than the happiest ones.
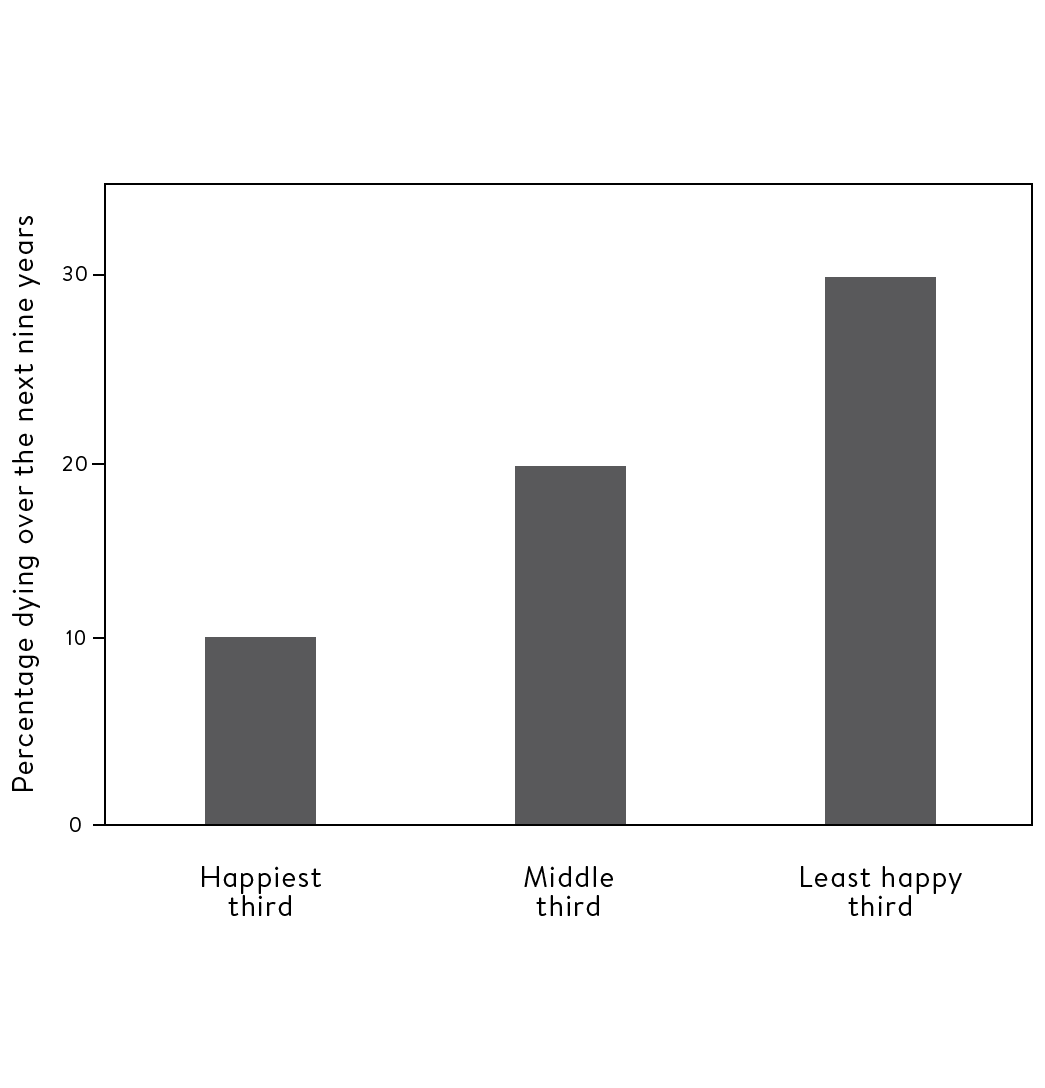
Happiness affects longevity (people originally aged fifty and over)
Finally, of course, there is the fact that we can to a good extent explain people’s answers – why they differ in the happiness they report. And that is what this chapter is about. So how important are different factors in explaining who is happy and who is not?
The effects of income and unemployment
I have spent most of my life working on income inequality and unemployment. I thought they were the most important causes of unhappiness, but research on happiness has revealed a more complicated picture.
Unemployment is really tough, as I had thought, and on average it reduces life-satisfaction by about 0.7 points (out of 10) – similar to the effect of being widowed or separated.6 But the effect of income is much less than I had expected. There have been thousands of surveys in hundreds of countries and they typically find that, holding all else constant, a person with double your income will be 0.2 points happier than you are. Similarly, a person whose income is one half of yours will be 0.2 points less happy.7 These are not huge differences and in most countries income inequality explains under 2 per cent of the variance of happiness.8
However, the case for redistribution remains clear. For what matters to people is the proportional change in their income. So, suppose a poor person is receiving an extra $100, and this is coming from someone who is ten times richer. The poor person’s gain in happiness will be ten times as large as the rich person’s loss of happiness. Though the gain to the poor person may be less than you might have thought, it is still much greater than the loss to the rich person.
But an important issue still remains: could the rich person’s dollar have been used to create even more happiness by some other policy than by giving it to someone who is poor? To answer this, we have to consider all the other causes of happiness. Which of them matter most?
What matters most?
To think about this, we can begin with the huge spread of life-satisfaction in the population which we saw on page 33 – ranging from misery to extreme happiness. We ask: what explains this variation? And to answer it we estimate an equation in which all the possible influences are included simultaneously. We can then calculate for each influence its ‘partial correlation coefficient’ with happiness. This measure, which we use frequently in the book, reflects how far each factor contributes independently to the overall variation of the thing being explained (in this case happiness).9 The analysis in the following chart is for happiness in Britain, but the results in other industrialized countries are very similar.10
As can be seen from Figure 2.2, the main influences are to do with your health, physical and mental, and with your human relationships. The most striking influence is your mental health. But your family life and your life at work are also extremely important – which is not surprising when you consider how much of our time we spend at home or at work. Our genes are of course also important, but there is nothing we can do about them.11 On the other hand, we can do a lot about the other factors, with help from teachers, managers, health professionals and people who work with families and communities.
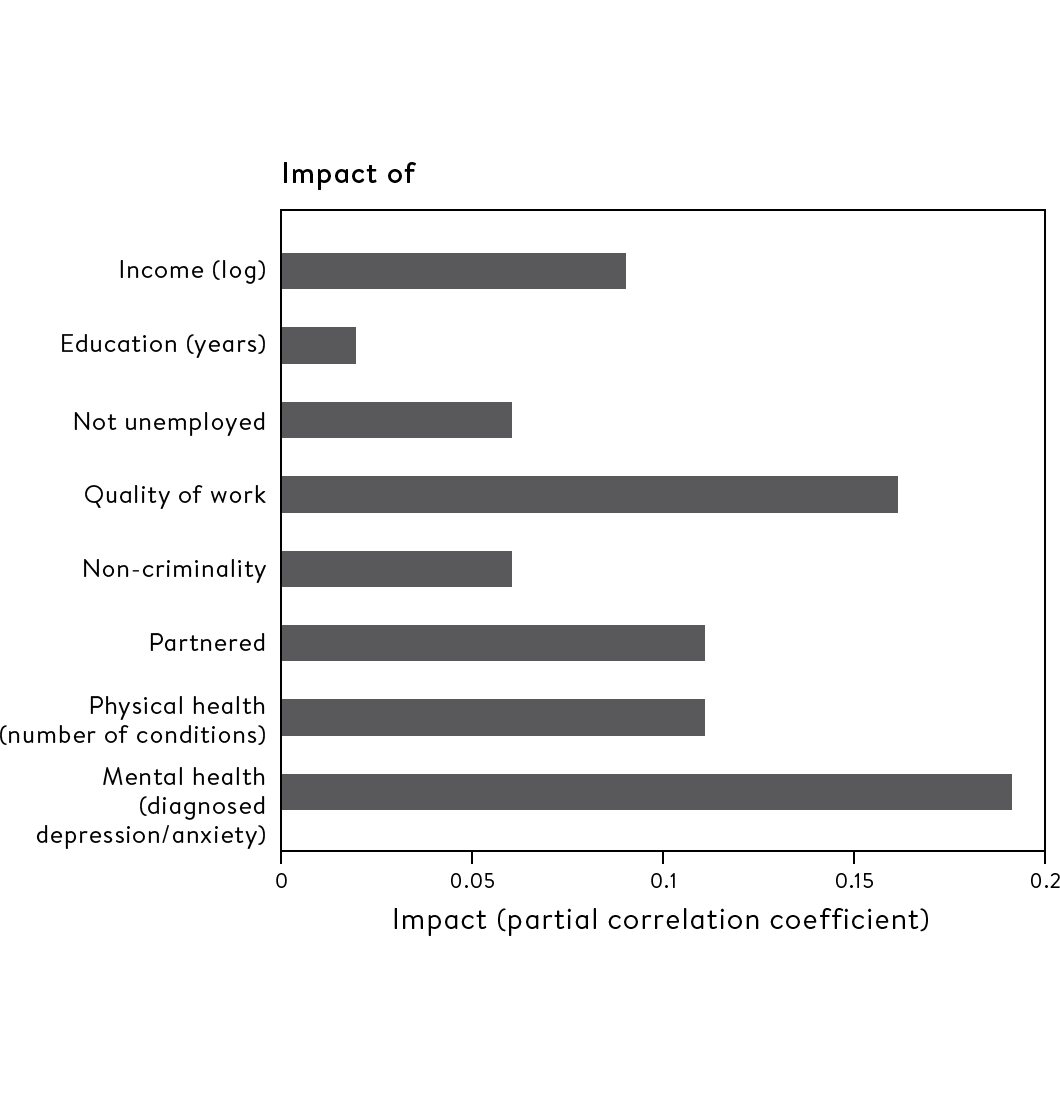
What explains the variation of adult happiness (in Britain)?
But, you might ask, do these findings underestimate the role of really low income as a key cause of distress? To investigate this we ask why some people have really low life-satisfaction, while others do not – why some people are miserable while others are not. This enables us to produce another figure like the one above, but one where we are explaining the presence or otherwise of misery (rather than the whole spread of happiness). For this purpose we measure misery by whether someone has a life-satisfaction score of less than 4 (out of 7).12
Remarkably, the new figure looks exactly like the figure above – the numbers are all slightly lower, but the pattern across the different factors is exactly the same.13 Mental illness is the most important factor, followed by physical health and family life. Low income comes below these as a cause of misery. These are results for rich countries. In poorer countries, poverty is the most important factor, but even in poor countries mental illness is as important a cause of misery as physical illness is.14
A better concept of deprivation
So it is time we took the inner life more seriously. In fact, we clearly need a new definition of deprivation. A person is as deprived when they lack the inner means to enjoy life as when they lack the external means. At this point we have to confront a common misconception, popularized some seventy years ago by the psychologist Abraham Maslow.15 He claimed there was a ‘hierarchy of needs’ beginning with the physical need for food, clothing and shelter, and reaching up through social needs to the need for spiritual exaltation. The idea of the hierarchy meant that, if your lower needs were unmet, there was no point thinking about your higher needs. Maslow provided no evidence for this and most of us have met people who are clearly flourishing with rich social connections and joy in their lives, but very little money. Empirical research confirms this.16 If the happiness movement does nothing else, let’s hope it can get rid of the hierarchy approach and convince people that mental health and a rich social life are as important to poor and rich alike.17 And they matter as much in poor countries as in rich ones. Let ‘Maslow’ provide no excuse for the shocking neglect of mental health in poor countries.
So much for how our happiness as adults is affected by our life as adults. But didn’t our childhood contribute to the adult we became? Which features of our childhood best predict our enjoyment of life as an adult?
What matters most in childhood?
There are three main aspects to how we develop as children: our academic achievement, our emotional health and our behaviour towards others. Which of these is the best predictor of whether we will have a happy adult life? In Britain it’s not academic achievement. Our emotional development at sixteen is a better predictor of our adult happiness than the whole panoply of our educational qualifications, including degrees of all kinds.18
But what then determines a child’s emotional health at age sixteen? Many people would think the child’s parents would have the most influence on this. But a study in the English city of Bristol and its surroundings shows something quite remarkable. The study followed up all the children born in the area in 1991–2, and recorded which primary school and which secondary school they went to. Each of these schools had many children who were included in the study, so that it was possible to see what difference (on average) each school made to the emotional development of the children who went there. The difference was enormous.19 In fact the happiness of a child at sixteen was equally affected by:
- which secondary school they were at;
- which primary school they had been to, and
- everything we know about their parents (their income, mental health, parenting skills, family conflict, etc.).
These results, discussed further in Chapter 6, show just how much difference teachers and parents can make to the happiness of their children – both when the children are young and when they have become adults.
So we can learn a lot by studying the differences between individuals in a given country. These differences within countries explain 80 per cent of the variation in happiness across the whole human race.20 So there is no reason why you should not be happy just because of where you live – provided it is at peace. However, there are also important differences between countries and these give real clues to the role of culture in affecting our happiness.
Why are some countries happier?
Countries vary hugely in their happiness levels, which shows there is no genetically determined set-point for the level of human happiness. If conditions improve, everyone in a country can become happier. The best source of data on country differences is the Gallup World Poll. These data have been the central source of information for the World Happiness Report, produced annually since 2012. The Report gives country rankings of happiness and trends in happiness for almost every country in the world. Not surprisingly, it attracts over 700,000 downloads a year. Table 2.1 below shows the latest rankings.
As in most other surveys, the happiest countries are those very egalitarian countries in Scandinavia. The Netherlands and Switzerland, two other vital democracies, are also in the top ten, together with three English-speaking countries: Australia, Canada and New Zealand. Then come a mixture of the main West European nations, including the UK, together with the United States. But interspersed among them are some Latin American countries, while lower down come other Latin American countries, together with Spain and Italy and some of the ex-Communist countries of Central Europe. Countries from the Gulf also figure quite high in the rankings. Moving to the bottom twenty, the great bulk of these countries are scenes of conflict – or have been in recent years.
So what, more generally, explains these rankings? John Helliwell has identified six factors which, when taken together, explain 76 per cent of the variance in average happiness across countries:21
- trust (the proportion of people who think ‘most people can be trusted’)
- generosity (the proportion who have donated money to a charity in the present month)
- social support (the proportion who have relatives or friends they can count on to help them whenever they need them)
- freedom (the proportion who are satisfied with their freedom to choose what they want to do with their life)
- health (years of healthy life expectancy)
- income (GDP per head).22
The effect of each variable is shown in Table 2.2 below. We can begin with trust. In some countries like Brazil almost no one trusts other people, while in Scandinavia it is around 70 per cent.23 As Table 2.1 shows, a country where everyone trusts is 1 whole point happier (out of 10) than a country where no one trusts. Thus higher levels of trust help the Scandinavian countries to be happier. These are countries where the culture is more collaborative and less competitive than in the rest of Europe. Trust is also higher in Canada, Australia and New Zealand than in the UK and the USA.
Another key influence is social support – someone to rely on. This makes a huge difference. It tends to be high in Latin America, due to the close family ties that exist in that culture.24 But freedom is also important,25 as of course is health. And the absolute effect of income across countries is similar to its effect within countries.26
From this analysis we can see that social variables (as opposed to personal variables) also have an important effect on our happiness. It really matters whether you can trust people, and have someone who will help you in times of trouble. This reminds us of the importance of those who set the tone for a society – the community leaders and the politicians.
Table 2.1 – Ranking of countries by their average happiness (on the scale 0–10)
| 1 | Finland | 7.8 |
| Denmark | 7.6 | |
| Norway | 7.5 | |
| Iceland | 7.5 | |
| Netherlands | 7.5 | |
| Switzerland | 7.5 | |
| Sweden | 7.3 | |
| New Zealand | 7.3 | |
| Canada | 7.3 | |
| 10 | Austria | 7.2 |
| Australia | 7.2 | |
| Costa Rica | 7.2 | |
| Israel | 7.1 | |
| Luxembourg | 7.1 | |
| United Kingdom | 7.1 | |
| Germany | 7.0 | |
| Ireland | 7.0 | |
| Belgium | 6.9 | |
| United States | 6.9 | |
| 20 | Czech Republic | 6.9 |
| United Arab Emirates | 6.8 | |
| Malta | 6.7 | |
| Mexico | 6.6 | |
| France | 6.6 | |
| Taiwan | 6.4 | |
| Chile | 6.4 | |
| Guatemala | 6.4 | |
| Saudi Arabia | 6.4 | |
| Qatar | 6.4 | |
| 30 | Spain | 6.4 |
| Panama | 6.3 | |
| Brazil | 6.3 | |
| Uruguay | 6.3 | |
| Singapore | 6.3 | |
| El Salvador | 6.3 | |
| Italy | 6.2 | |
| Bahrain | 6.2 | |
| Slovakia | 6.2 | |
| Trinidad and Tobago | 6.2 | |
| 40 | Poland | 6.2 |
| Uzbekistan | 6.2 | |
| Lithuania | 6.1 | |
| Colombia | 6.1 | |
| Slovenia | 6.1 | |
| Nicaragua | 6.1 | |
| Kosovo | 6.1 | |
| Argentina | 6.1 | |
| Romania | 6.1 | |
| Cyprus | 6.0 | |
| 50 | Ecuador | 6.0 |
| Kuwait | 6.0 | |
| Thailand | 6.0 | |
| Latvia | 5.9 | |
| South Korea | 5.9 | |
| Estonia | 5.9 | |
| Jamaica | 5.9 | |
| Mauritius | 5.9 | |
| Japan | 5.9 | |
| Honduras | 5.9 | |
| 60 | Kazakhstan | 5.8 |
| Bolivia | 5.8 | |
| Paraguay | 5.8 | |
| Hungary | 5.8 | |
| North Cyprus | 5.7 | |
| Peru | 5.7 | |
| Portugal | 5.7 | |
| Russia | 5.6 | |
| Philippines | 5.6 | |
| Pakistan | 5.6 | |
| 70 | Serbia | 5.6 |
| Moldova | 5.5 | |
| Libya | 5.5 | |
| Montenegro | 5.5 | |
| Tajikistan | 5.5 | |
| Croatia | 5.4 | |
| Hong Kong | 5.4 | |
| Dominican Republic | 5.4 | |
| Bosnia & Herzegovina | 5.4 | |
| Turkey | 5.4 | |
| 80 | Malaysia | 5.3 |
| Belarus | 5.3 | |
| Greece | 5.3 | |
| Mongolia | 5.3 | |
| Macedonia | 5.3 | |
| Nigeria | 5.3 | |
| Kyrgyzstan | 5.3 | |
| Turkmenistan | 5.2 | |
| Algeria | 5.2 | |
| Morocco | 5.2 | |
| 90 | Azerbaijan | 5.2 |
| Morocco | 5.2 | |
| Lebanon | 5.2 | |
| Indonesia | 5.2 | |
| China | 5.2 | |
| Vietnam | 5.2 | |
| Cameroon | 5.0 | |
| Bulgaria | 5.0 | |
| Ghana | 5.0 | |
| Ivory Coast | 4.9 | |
| 100 | Nepal | 4.9 |
| Jordan | 4.9 | |
| Benin | 4.9 | |
| Congo (Brazzaville) | 4.8 | |
| Gabon | 4.8 | |
| Laos | 4.7 | |
| South Africa | 4.7 | |
| Albania | 4.7 | |
| Venezuela | 4.7 | |
| Palestine | 4.7 | |
| 110 | Senegal | 4.7 |
| Niger | 4.7 | |
| Somalia | 4.7 | |
| Namibia | 4.6 | |
| Burkina Faso | 4.6 | |
| Guinea | 4.6 | |
| Armenia | 4.6 | |
| Iran | 4.5 | |
| Guinea | 4.5 | |
| Georgia | 4.5 | |
| 120 | Gambia | 4.5 |
| Kenya | 4.5 | |
| Mauritania | 4.5 | |
| Mozambique | 4.5 | |
| Tunisia | 4.5 | |
| Bangladesh | 4.5 | |
| Iraq | 4.4 | |
| Congo (Kinshasa) | 4.4 | |
| Myanmar | 4.4 | |
| Mali | 4.4 | |
| 130 | Sierra Leone | 4.4 |
| Sri Lanka | 4.4 | |
| Chad | 4.4 | |
| Ukraine | 4.3 | |
| Ethiopia | 4.3 | |
| Swaziland | 4.2 | |
| Uganda | 4.2 | |
| Egypt | 4.2 | |
| Zambia | 4.1 | |
| Togo | 4.1 | |
| 140 | India | 4.0 |
| Liberia | 4.0 | |
| Comoros | 4.0 | |
| Madagascar | 3.9 | |
| Lesotho | 3.8 | |
| Burundi | 3.8 | |
| Zimbabwe | 3.7 | |
| Haiti | 3.6 | |
| Botswana | 3.5 | |
| Syria | 3.5 | |
| 150 | Malawi | 3.4 |
| Yemen | 3.4 | |
| Rwanda | 3.3 | |
| Tanzania | 3.2 | |
| Afghanistan | 3.2 | |
| Central African Republic | 3.1 | |
| South Sudan | 2.9 |
Table 2.2
How is national happiness (0–10) affected by national variables?
| Variable | Change in variable | Impact of change |
|---|---|---|
| Trust | 100% v. 0% | 0.98 |
| Generosity | 100% v. 0% | 0.85 |
| Social support | 100% v. 0% | 2.10 |
| Freedom | 100% v. 0% | 1.27 |
| Health | extra year | 0.03 |
| Income | doubles | 0.25 |
But despite all this, some people maintain that each person has a set-point of happiness as a result of their genes. The huge international differences show just how false that belief is. Moreover, as we shall see in Chapter 11, when people move from one country to another, their happiness is often transformed. So we can indeed create a happier world.
Are we getting happier?
But are we actually getting happier? The answer is that it depends on where you live. In the US, people are no happier now than they were in the 1950s, despite huge improvements in living standards at least up to the 1970s.27 In West Germany people are no happier than in the 1970s when records began.28 And in China they are no happier than they were in 1990 when their records began.29 However, in more countries than not, happiness rose from 1980 to 2007.30 But since 2007 world happiness has stagnated: it has fallen in nearly as many countries as those where it has risen.31
What accounts for these facts? The first point to make about movements in happiness is that they are cyclical – happiness rises in economic booms and falls in recessions.32 But does long-term economic growth increase happiness? This is still an unresolved issue. Richard Easterlin, using only countries with long time-series on happiness, claims that when you compare countries, there is no relation between their rate of economic growth and their increase in happiness. If this is true, there are two obvious possible explanations. Either people are comparing themselves with other people whose incomes also rose, or they are simply adapting to higher income and taking it for granted. Our research group has examined both explanations and found more evidence of social comparison than of adaptation.33
However, two careful American researchers, Betsey Stevenson and Justin Wolfers, dispute Easterlin’s original finding.34 So the most we can say is that economic growth is no guarantee of increased happiness. We should surely welcome it, but only as one of a whole range of ways to make the world happier.
We should certainly not sacrifice too much else in the pursuit of higher income. And this is what seems to be happening. Worldwide there is an increase in stress. As Figure 2.3 shows, more and more people are saying ‘Yes’, when asked ‘Did you experience a lot of stress yesterday?’ Although the graph covers only the USA and Western Europe, the trend is worldwide, in an online annex.35
Conclusions
The science of happiness thus offers us the following new insights:
- Within countries, differences in happiness among adults are due to inner differences in mental and physical health as much as to the outer differences. And the most important outer differences are the quality of our human relationships at home, at work and in the community. Income inequality explains at most 2 per cent of the differences in happiness. Thus we need a new concept of deprivation – it should mean deprivation of happiness (and not simply deprivation of income).
- To become a happy adult, it is more important to be a happy child than to get good grades. But schools have a huge influence on the happiness of their children.
- Everyone is affected by the overall institutions and ethos of their country. Countries are happier if (as in Scandinavia) there is a high level of trust, strong social support, personal freedom and low levels of corruption.
- Because happiness has so many causes, economic growth, though desirable, is no guarantee of rising happiness.
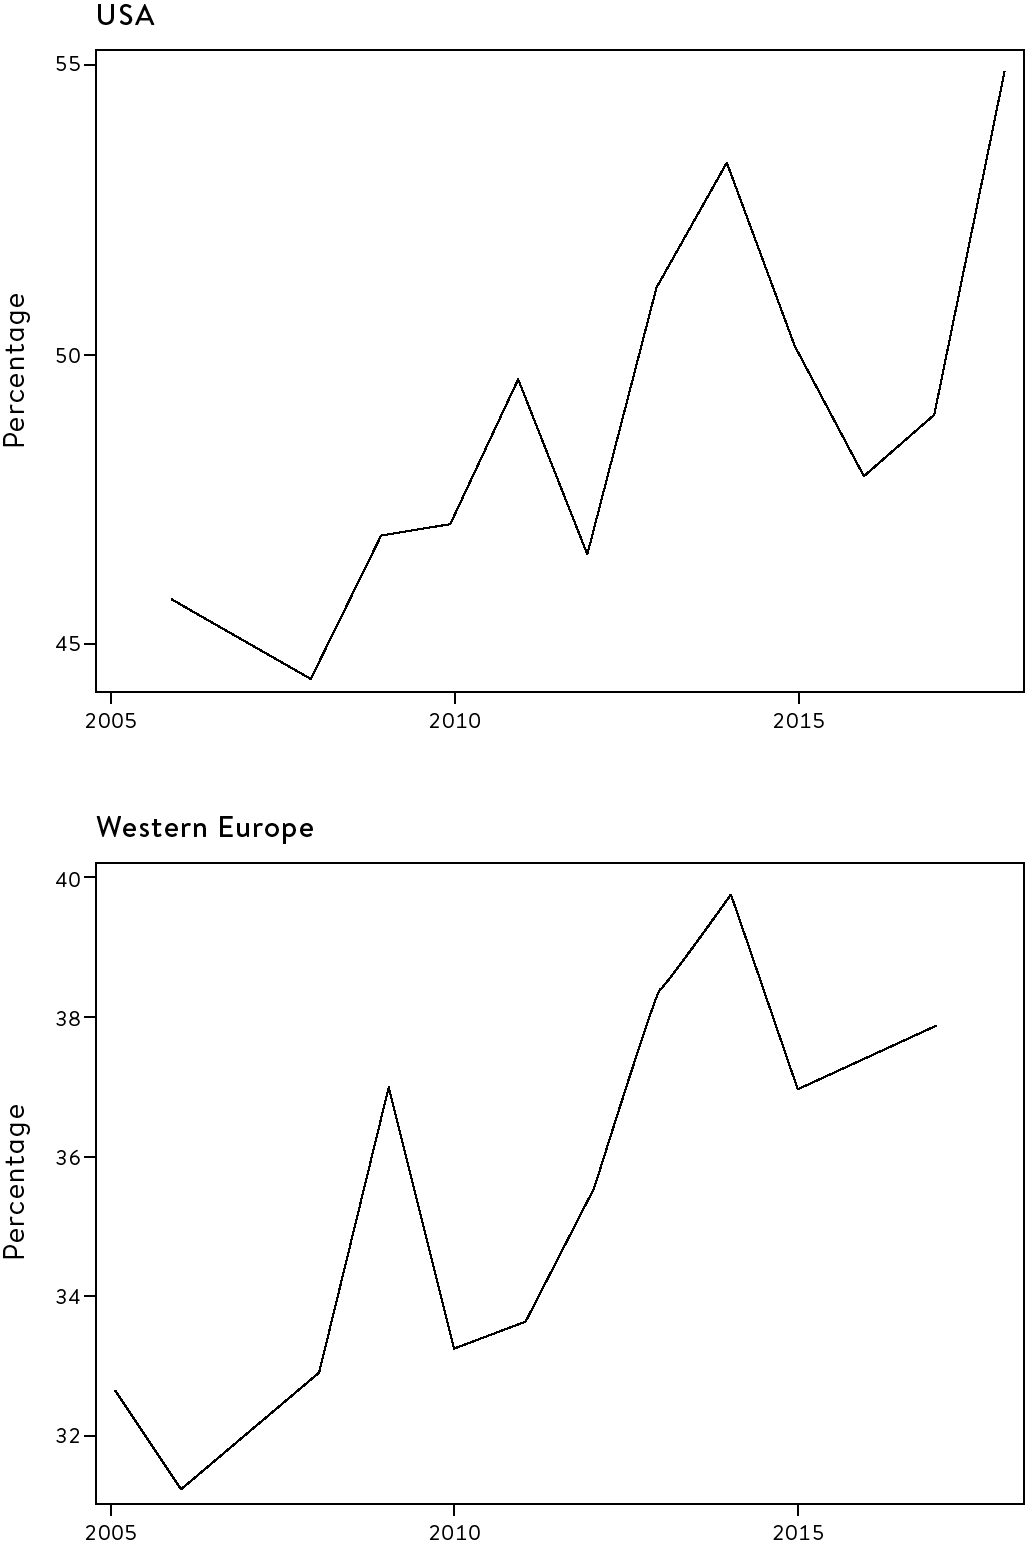
Stress is increasing (percentage saying ‘I experienced a lot of stress yesterday’)
These insights throw fresh light on how we can improve our lives. They suggest major new areas where we need to develop better strategies both for individuals and for communities – action on child wellbeing, on wellbeing at work, on mental health, on families and on community cohesion.
But they do not tell us what exactly we should do in each of these areas. That is where experimental science comes in. This has made great strides in many areas of our social life, as we shall see in Part Two. But in none of these areas have the advances been more striking than in clinical psychology – the science of how we can gain control over our mental life. Closely related to that, there has been the growing rise in meditation and mindfulness, for which, again, there is a scientific basis. So techniques of mind-training are the third strand in the happiness revolution.